. 2014 Nov 20;515(7527):414-8.
doi: 10.1038/nature13716. Epub 2014 Aug 17.

Synaptic dysregulation in a human iPS cell model of mental disorders

Affiliations

Synaptic dysregulation in a human iPS cell model of mental disorders

Zhexing Wen et al. Nature. .

Abstract

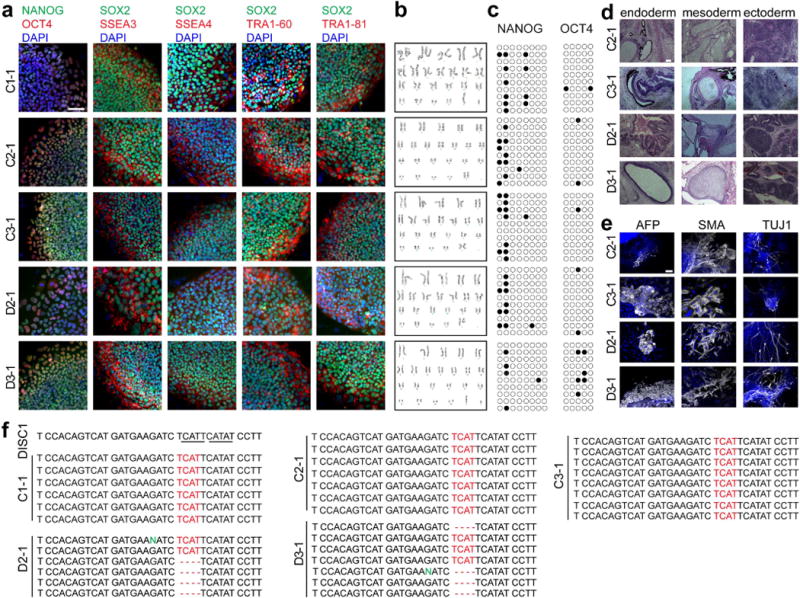
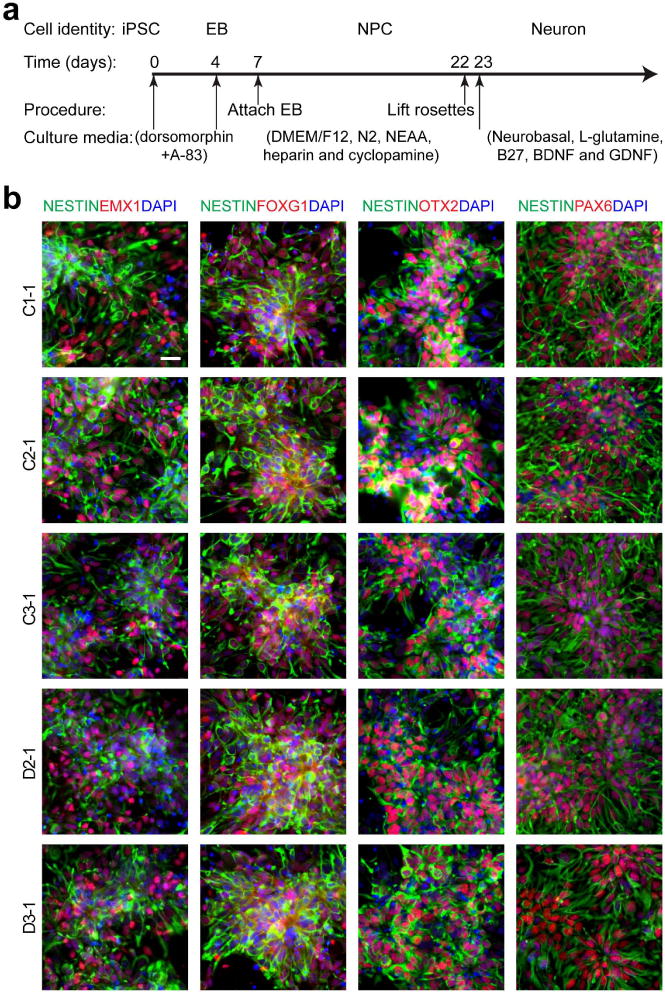
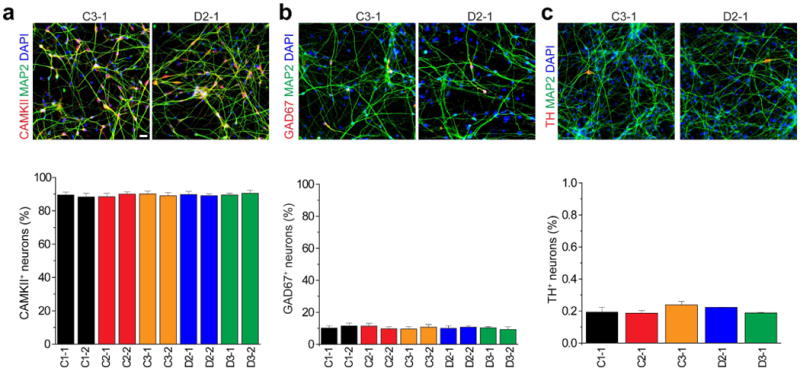
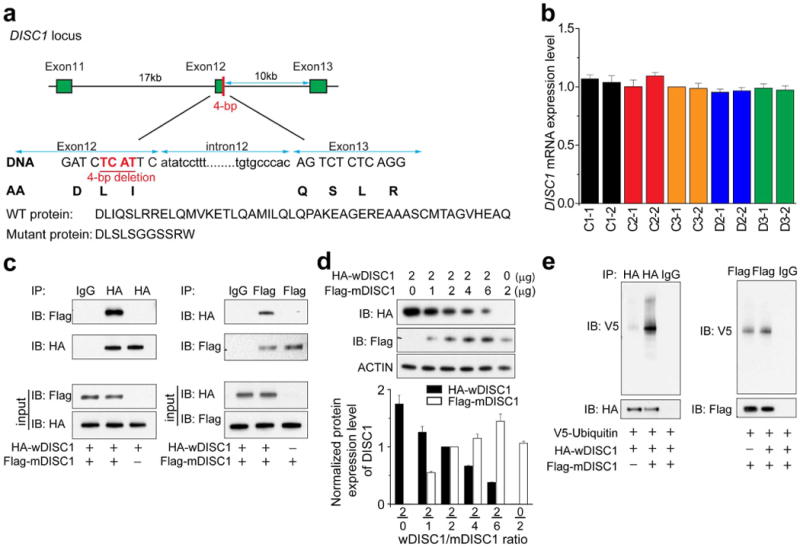
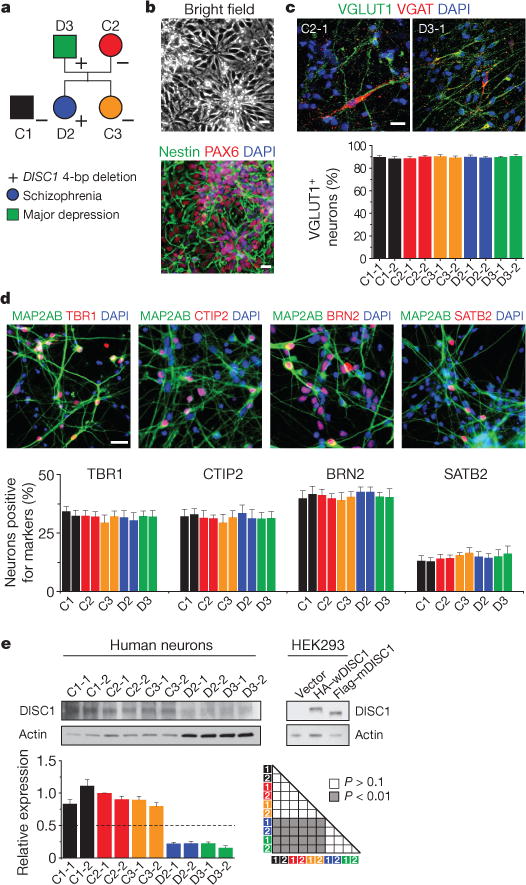
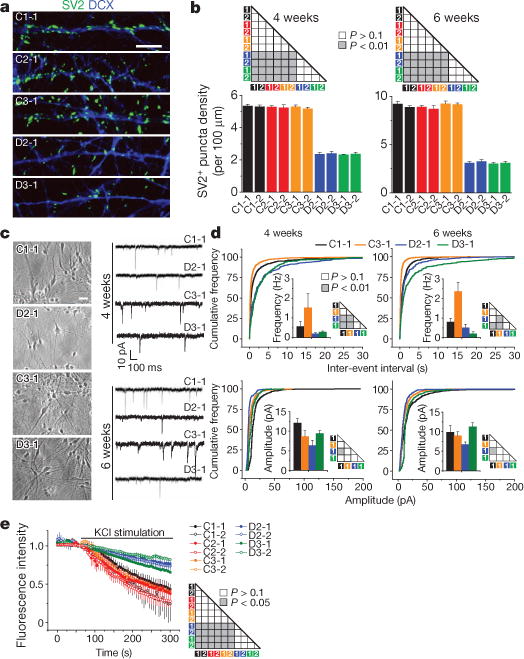
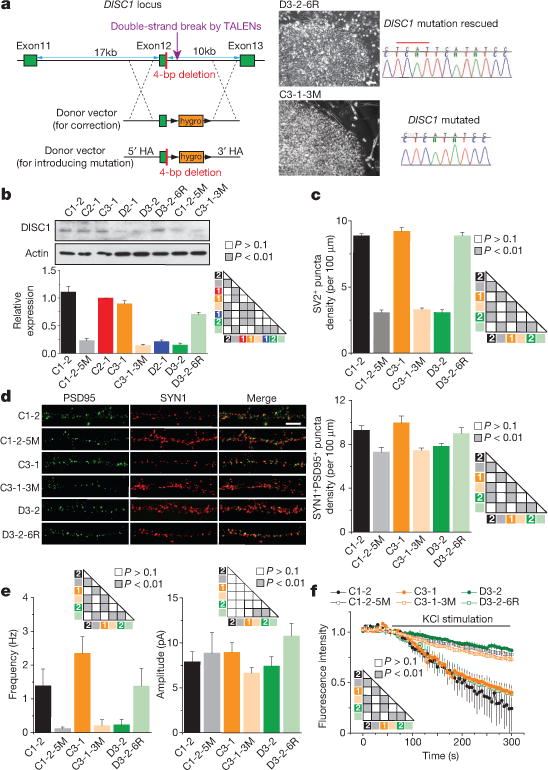
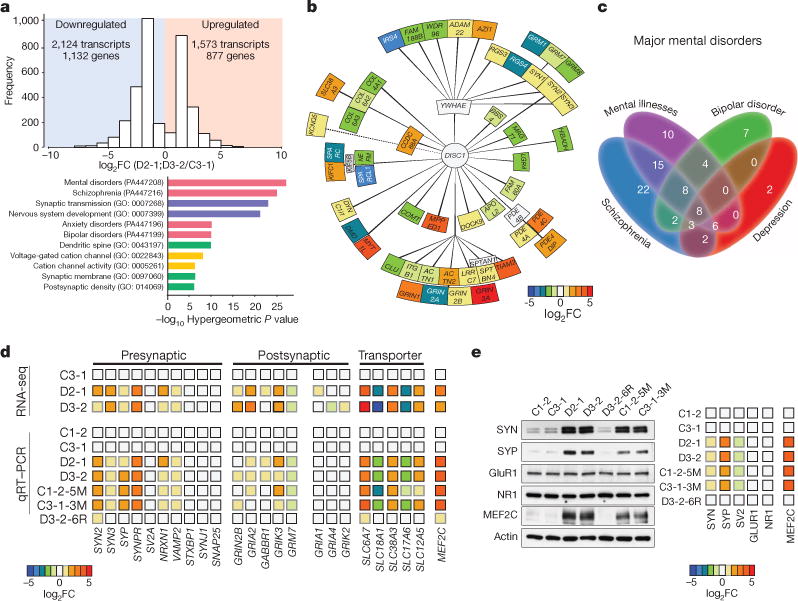
Dysregulated neurodevelopment with altered structural and functional connectivity is believed to underlie many neuropsychiatric disorders, and 'a disease of synapses' is the major hypothesis for the biological basis of schizophrenia. Although this hypothesis has gained indirect support from human post-mortem brain analyses and genetic studies, little is known about the pathophysiology of synapses in patient neurons and how susceptibility genes for mental disorders could lead to synaptic deficits in humans. Genetics of most psychiatric disorders are extremely complex due to multiple susceptibility variants with low penetrance and variable phenotypes. Rare, multiply affected, large families in which a single genetic locus is probably responsible for conferring susceptibility have proven invaluable for the study of complex disorders. Here we generated induced pluripotent stem (iPS) cells from four members of a family in which a frameshift mutation of disrupted in schizophrenia 1 (DISC1) co-segregated with major psychiatric disorders and we further produced different isogenic iPS cell lines via gene editing. We showed that mutant DISC1 causes synaptic vesicle release deficits in iPS-cell-derived forebrain neurons. Mutant DISC1 depletes wild-type DISC1 protein and, furthermore, dysregulates expression of many genes related to synapses and psychiatric disorders in human forebrain neurons. Our study reveals that a psychiatric disorder relevant mutation causes synapse deficits and transcriptional dysregulation in human neurons and our findings provide new insight into the molecular and synaptic etiopathology of psychiatric disorders.


Conflict of interest statement

The authors declare no competing financial interests. Readers are welcome to comment on the online version of the paper.

Figures

Extended Data Figure 1
Extended Data Figure 1. Basic characterization of iPS cell lines
a–c, Sample confocal images of immunostaining of pluripotency-associated markers for different iPS cell lines (a, scale bar, 50 μm) and sample images of karyotyping (b). Also shown is sample bisulphite-sequencing analysis of promoter regions of pluripotency genes NANOG and OCT4 (c). Each row represents one allele: closed circles represent methylated cytosine and open circles represent unmethylated cytosine. d, e, Pluripotency of iPS cell lines. Shown are sample images of cell types of three germ-layers in teratomas following transplantation to SCID mice (d, scale bar, 100 μm) and immunostaining for AFP (an endoderm marker), SMA (a mesoderm marker) or TUJ1 (an ectoderm/neuronal marker), upon in vitro differentiation of iPS cells (e, scale bar, 50 μm). f, Confirmation of the genotype of different iPS cell lines by Sanger sequencing. Shown are sample genomic DNA sequences around exon 12 and intron 12 of different iPS cell lines. Each line represents one allele. See Supplementary Table 1a for a summary of similar characterization for all iPS cell lines used in this study.
Extended Data Figure 2
Extended Data Figure 2. Forebrain-specific neural differentiation of iPS cell lines
a, Schematic diagram of the differentiation procedure. b, Sample confocal images of immunostaining for nestin and forebrain progenitor markers, EMX1, FOXG1, OTX2, and PAX6, and DAPI. Scale bar, 20 μm.
Extended Data Figure 3
Extended Data Figure 3. Neuronal subtype differentiation of iPS cell lines
a, Expression of glutamatergic neuron marker α-CAMKII. Shown are sample confocal images of immunostaining of CAMKII and MAP2AB and quantification. Scale bar, 20 μm. Values represent mean ± s.e.m. n = 5 cultures. b, Expression of GABAergic neuron marker GAD67. Same as in a, except that GAD67 was examined. c, Expression of dopaminergic neuron marker tyrosine hydroxylase in cultures. Same as in a, except that tyrosine hydroxylase was examined in one iPS cell line each from five individuals.
Extended Data Figure 4
Extended Data Figure 4. Effect of the 4-bp deletion mutation of DISC1 on wild-type DISC1 at the protein level
a, Schematic diagram of the DISC1 locus harbouring the frameshift 4-bp deletion mutation. Also shown are predicated protein sequences at the C terminus of wDISC1 and mDISC1. b, Quantification of DISC1 mRNA levels from qPCR analysis of exon 2. Data were normalized to that of C3-1 neurons. Values represent mean ± s.e.m., n = 3. c, Sample western blot images of co-immunoprecipitation analyses of differentially tagged wDISC1 and mDISC1 upon co-expression in HEK293 cells. d, Dose-dependent depletion of soluble wDISC1 by mDISC1 upon co-expression in HEK293 cells. Shown are sample western blot images and quantification. Data were normalized to that of the 2:2 ratio condition for each experiment. Values represent mean ± s.e.m. (n = 3). e, Increased ubiquitination of wDISC1 upon mDISC1 co-expression. Expression plasmids for V5-tagged ubiquitin and HA-tagged wDISC1 were co-transfected with or without Flag-tagged mDISC1 into HEK293 cells. Samples were prepared with lysate buffer containing SDS to dissociate the protein complex, and then wDISC1 was immunoprecipitated with anti-HA antibodies, followed by western blot analysis using anti-V5 antibodies. Note markedly increased covalent-bound ubiquitin for wDISC1 upon mDISC1 co-expression.
Extended Data Figure 5
Extended Data Figure 5. Morphological development of forebrain neurons in culture
Shown are summaries of soma size and total dendritic length of forebrain neurons derived from two iPS cell lines from each individual at 1 to 4 weeks after neuronal differentiation. Numbers associated with the bars indicate total numbers of neurons examined. Values represent mean ± s.e.m. n = 5 cultures; ANOVA analysis.
Extended Data Figure 6
Extended Data Figure 6. I–V characteristics of forebrain neurons derived from different iPS cell lines
Shown are summaries of recordings from forebrain neurons derived from 4 iPS cell lines in co-culture with astrocytes for 1, 2 or 4weeks. Values represent mean ± s.e.m., n = 6–15 cells for each condition.
Extended Data Figure 7
Extended Data Figure 7. Basic characterization of isogenic iPS cell lines
a, b, Sample images of immunostaining of pluripotency-associated markers for different isogenic iPS cell lines (a; scale bars, 50 μm) and sample images for karyotyping (b). See Supplementary Table 1a for a summary.
Extended Data Figure 8
Extended Data Figure 8. Validations of differential gene and protein expression in forebrain neurons from different isogenic iPS cell lines
a, Heat-map of expression profile of 500 genes. b, Dot plot of gene expression analysis of a selected group of 23 genes from RNA-seq and qRT–PCR analyses of independent samples of C3-1 and D2-1 neurons. Data represent mean values (n = 3). c, Quantitative mRNA analysis of a selected group of synapserelated genes in forebrain neurons from different isogenic lines. Data from RNA-seq analysis (n = 3 samples each) are also shown for comparison. Values represent mean ± s.e.m. (n = 3; *P<0.01; ANOVA). The same data are summarized in a heat-map illustration shown in Fig. 4d. d, Quantitative analysis of protein expression based on western blot analysis. Values represent mean ± s.e.m. (n = 3; *P<0.01; ANOVA). The same data are summarized in a heat-map illustration shown in Fig. 4e.
Figure 1
Figure 1. Normal neural differentiation, but markedly reduced total DISC1 protein levels in forebrain neurons derived from patient iPS cells carrying the DISC1 mutation
a, A schematic diagram of the pedigree for iPS cell generation. In addition, iPS cells from a control individual outside of the pedigree (C1, male) were used in the current study. The symbol + indicates one copy of the 4-bp deletion in the DISC1 gene; the symbol – indicates lack of the 4-bp deletion in the DISC1 gene. b–d, Neural differentiation of iPS cells. b, Sample bright-field and confocal images of nestin and PAX6 immunostaining of hNPCs. See Extended Data Fig. 2 for characterization of additional forebrain neural progenitor markers. c, Sample confocal images of immunostaining of human neurons at 4 weeks after neuronal differentiation for VGLUT1 (also known as SLC17A7) and VGAT, and quantification of VGLUT1+ neurons among different iPS cell lines. Values represent mean ± s.e.m. n = 5 cultures. See Extended Data Fig. 3 for characterization of other markers. d, Sample confocal images of immunostaining for MAP2AB and neuronal subtype markers of different cortical layers, and quantification of neuronal subtype differentiation among different iPS cell lines. Values represent mean ± s.e.m. n = 4 cultures. Scale bars, 20 μm. e, DISC1 protein levels in forebrain neurons derived from different iPS cell lines. Shown are sample western blot images and quantification. Data were normalized to actin for sample loading and then normalized to C2-1 in the same blot for comparison. Values represent mean ± s.e.m. n = 3; ANOVA test. Note that the DISC1 antibodies used recognized both full-length human wDISC1 (HA-tagged) and mDISC1 (Flag-tagged) exogenously expressed in HEK293 cells.
Figure 2
Figure 2. Defects of glutamatergic synapses in forebrain neurons carrying the DISC1 mutation
a, b, Decreased density of SV2+ puncta by human forebrain neurons derived from patient iPS cell lines carrying the DISC1 mutation compared to control lines. a, Sample confocal images of SV2 and DCX immunostaining of neurons at 6 weeks after neuronal differentiation. Scale bar, 20 μm. b, Summaries of quantification of SV2+ puncta density for neurons derived from two iPS cell lines for each individual. Values represent mean ± s.e.m. n = 5 cultures; ANOVA test. c, d, Defects in glutamatergic synaptic transmission by DISC1 mutant neurons. Forebrain hNPCs were co-cultured on confluent astrocyte feeder layers. c, Sample phase images of co-culture and sample whole-cell voltage-clamp recording traces of excitatory spontaneous synaptic currents (SSCs). Scale bar, 20 μm. d, Distribution plots of SSC event intervals and amplitudes. n = 10–12 neurons for each condition; Kolmogorov–Smirnov test. Mean frequencies and amplitudes are also shown. e, Decreased vesicle release by DISC1 mutant neurons. Six-week-old neurons were imaged for KCl (60 mM) induced release of FM1-43. Values represent mean ± s.e.m. n = 4 cultures; ANOVA test.
Figure 3
Figure 3. A causal role of the DISC1 mutation in regulating synapse formation in human forebrain neurons
a, Generation of two types of isogenic iPS cell lines. Shown on the left is a schematic illustration of the gene editing strategy for correction of the mutation (4-bp deletion; red bar)in a mutant iPS cell line and for knock-in of the same mutation into two control iPS cell lines. HA, homology arm. Shown on the right are sample images of iPS cell colonies for the correction line (D3-2-6R) and the knock-in line (C3-1-3M) and confirmation by Sanger sequencing. Scale bar, 50 mm. b, Expression of DISC1 protein in forebrain neurons derived from different isogenic iPS cell lines. Shown are sample western blot images and quantification of the total DISC1 protein level. Data were normalized to actin for sample loading and then to C2-1 in the same blot for comparison. Values represent mean ± s.e.m. n = 3; ANOVA test. c–f, mDISC1-dependent regulation of synaptic puncta density and vesicle release. d, Sample confocal images of SYN1 and PSD95 immunostaining. Scale bar, 20 μm. Also shown are summaries of densities of SV2+ puncta (c) or SYN1+ and PSD95+ pair (d) of 6-week-old neurons. Values represent mean ± s.e.m. n = 4 cultures; ANOVA test. e, Summaries of SSC frequencies and amplitudes. Values represent mean ± s.e.m. n = 10–16 neurons for each condition; Kolmogorov–Smirnov test. f, Summary of FM1-43 imaging analysis, similar to analysis in Fig. 2e. Values represent mean ± s.e.m. n = 4 cultures; ANOVA test.
Figure 4
Figure 4. Dysregulation of neuronal transcriptome encoding a subset of presynaptic proteins, DISC1-interacting proteins and mental-disorder-associated proteins in human forebrain neurons carrying the DISC1 mutation
a–c, Summary of RNA-seq analysis of 4-week-old forebrain neurons derived from C3-1, D2-1 and D3-2 iPS cells, n = 3 samples for each iPS cell line. a, Histographs of differentially expressed genes in DISC1 mutant neurons (both D2 and D3) compared to control neurons and GO analysis. b, Illustration of differentially expressed genes encoding DISC1-interaction proteins. Heat-map indicates mean values of differential expression for each gene. c, Illustration of differentially expressed genes that are related to mental disorders. See Supplementary Table 2e for the gene list. d, Validation of differential mRNA expression of selected genes related to synapses in 3forebrain neurons from different isogenic iPS cell lines. Shown is a heat-map of mean values of each gene under different conditions, n = 3 experiments. Values were normalized to those of C3-1 neurons. See Extended Data Fig. 8c for details. e, Validation of differential protein expression of selected genes in forebrain neurons from isogenic iPS cell lines. Shown is a heat-map of mean values of each protein under different conditions, n = 3 experiments. See Extended Data Fig. 8d for details.

Similar articles

Cited by

References

    1. Weinberger DR. Implications of normal brain development for the pathogenesis of schizophrenia. Arch Gen Psychiatry. 1987;44:660–669. - PubMed
    1. Mirnics K, Middleton FA, Lewis DA, Levitt P. Analysis of complex brain disorders with gene expression microarrays: schizophrenia as a disease of the synapse. Trends Neurosci. 2001;24:479–486. - PubMed
    1. Johnson RD, Oliver PL, Davies KE. SNARE proteins and schizophrenia: linking synaptic and neurodevelopmental hypotheses. Acta Biochim Pol. 2008;55:619–628. - PubMed
    1. Honer WG, Young CE. Presynaptic proteins and schizophrenia. Int Rev Neurobiol. 2004;59:175–199. - PubMed
    1. Gulsuner S, et al. Spatial and temporal mapping of de novo mutations in schizophrenia to a fetal prefrontal cortical network. Cell. 2013;154:518–529. - PMC - PubMed

Publication types

MeSH terms

Associated data