

The miR-379/miR-410 cluster at the imprinted Dlk1-Dio3 domain controls neonatal metabolic adaptation
- PMID: 25124681
- PMCID: PMC4282508
- DOI: 10.15252/embj.201387038
The miR-379/miR-410 cluster at the imprinted Dlk1-Dio3 domain controls neonatal metabolic adaptation
Abstract
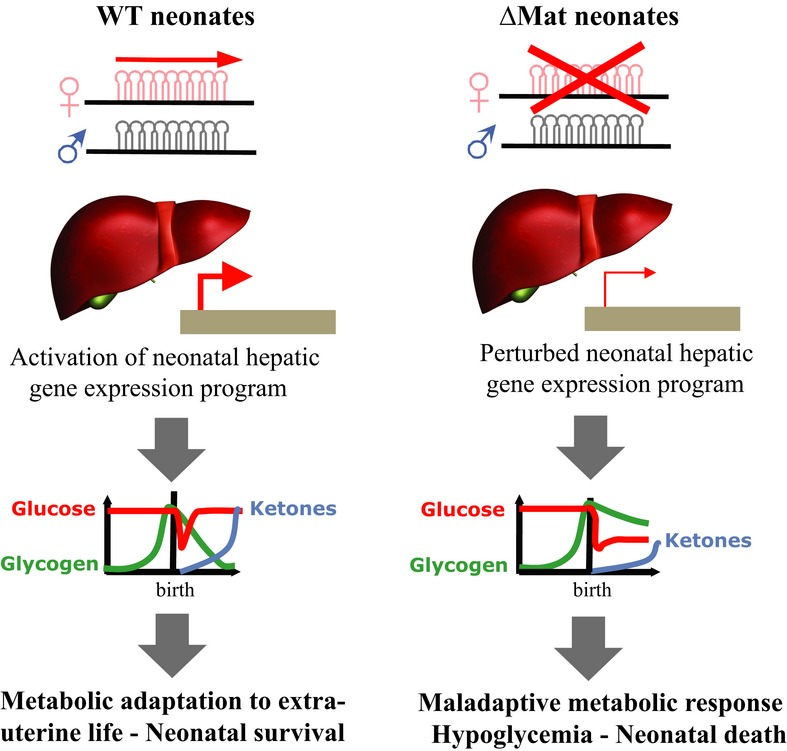
In mammals, birth entails complex metabolic adjustments essential for neonatal survival. Using a mouse knockout model, we identify crucial biological roles for the miR-379/miR-410 cluster within the imprinted Dlk1-Dio3 region during this metabolic transition. The miR-379/miR-410 locus, also named C14MC in humans, is the largest known placental mammal-specific miRNA cluster, whose 39 miRNA genes are expressed only from the maternal allele. We found that heterozygote pups with a maternal--but not paternal--deletion of the miRNA cluster display partially penetrant neonatal lethality with defects in the maintenance of energy homeostasis. This maladaptive metabolic response is caused, at least in part, by profound changes in the activation of the neonatal hepatic gene expression program, pointing to as yet unidentified regulatory pathways that govern this crucial metabolic transition in the newborn's liver. Not only does our study highlight the physiological importance of miRNA genes that recently evolved in placental mammal lineages but it also unveils additional layers of RNA-mediated gene regulation at the Dlk1-Dio3 domain that impose parent-of-origin effects on metabolic control at birth and have likely contributed to mammal evolution.
Keywords: epigenetic; genomic imprinting; metabolic adaptation; microRNA; mouse model.
© 2014 The Authors.
Figures
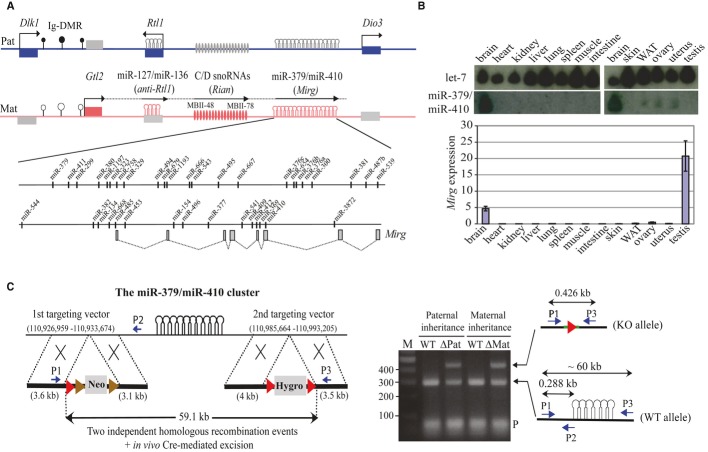
Schematic representation of the ˜1-Mbp imprinted Dlk1-Dio3 region on mouse distal chromosome 12. Paternally expressed protein-coding genes (Dlk1, Rtl1, and Dio3) are symbolized by blue rectangles, while maternally expressed miRNA and C/D snoRNA genes are depicted by pink stem loops and ovals, respectively. Gtl2 (pink rectangle) is a long, maternally expressed non-coding RNA (ncRNA) gene. Anti-Rtl1, Rian, and Mirg correspond to poorly characterized maternally expressed ncRNAs from which some, but not all, miRNAs and C/D snoRNAs are processed. It should be noted, however, that some deposited RNA sequences may simply represent RNA species whose functionality, if any, remains questionable (Chiang et al, 2010). Arrows indicate the sense of transcription, with the horizontal broken line highlighting the notion that Gtl2, anti-Rtl1, Rian, and Mirg may belong to the same transcription unit. Differentially methylated regions, including the imprinting center (Ig-DMR) that controls imprinted expression over the domain, are indicated by filled and open lollipops (methylated and un-methylated, respectively). The relative positions of hairpin-like (pre-miRNA) structures within the miR-379/miR-410 cluster are indicated in the enlarged inset. Note that most pre-miRNA genes at the 3′ end of the cluster are positioned within introns of Mirg (gray rectangles and dotted lines represent exons and splicing events, respectively).
Top: The tissue-specific expression pattern of miRNAs was assayed by Northern blot analysis of adult mouse tissues as indicated on the panel, using a mixture of 32P-labelled oligonucleotides antisense to some miRNAs scattered along the cluster (miR-411, 323, 376b, 376a, 134, 154, and 410). The same membrane was probed with a let-7 oligo probe (gel loading control). Bottom: The tissue-specific expression pattern of Mirg host gene transcripts was assayed by RT–qPCR relative to Gapdh using the same set of tissues. Note that Mirg expression, but not that of miRNAs, is detected in testes, indicating that post-transcriptional regulation may occur in this tissue. WAT: white adipose tissue. Data are expressed as mean ± s.e.m.
Cre/loxP-mediated site-specific deletion of the miR-379/miR-410 cluster. Left: Targeting strategy for disrupting the miR-379/miR-410 cluster through two independent homologous recombination events. Genome coordinates: UCSC Genome Browser, mouse, NCB137/mm9. Red and brown arrows indicate loxP and FRT recognition sites for the Cre and Flp site-specific recombinases, respectively. Right: PCR confirmation of the deletion using appropriate P1, P2, and P3 primers. The sequence of the deleted region was further confirmed by DNA sequencing. ΔMat and ΔPat represent heterozygous individuals with maternally and paternally inherited deletions, respectively, while WT correspond to wild-type littermate controls. M: DNA ladder (bp).
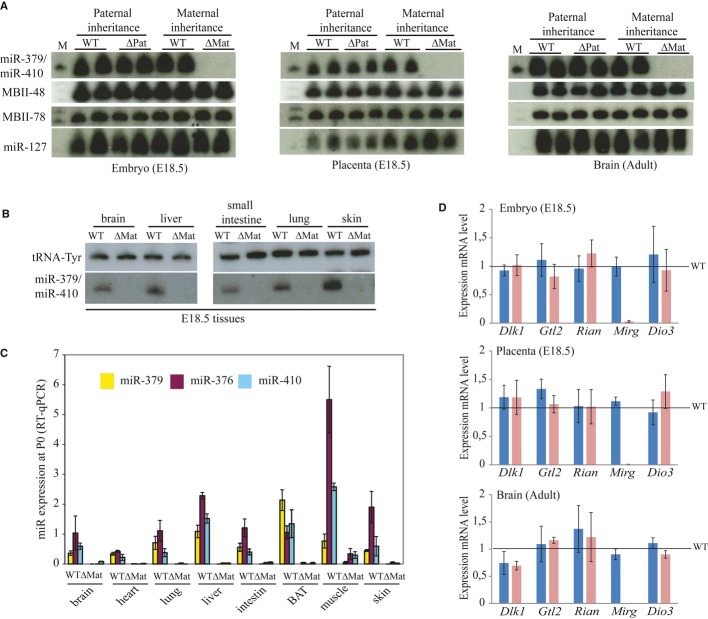
Expression of the miR-379/miR-410 cluster and its flanking C/D snoRNA (MBII-78, MBII-48) and miRNA (miR-127) genes was assayed by Northern blot analysis of the indicated samples (two individuals per genotype).
Expression of the miR-379/miR-410 cluster was assayed by Northern blot analysis of the dissected tissues indicated above the panels from WT or ΔMat E18.5 embryos. A tRNA-specific probe was used as the internal loading control.
Expression of selected miRNAs (miR-379, miR-376a, and miR-410) was assayed by RT–qPCR relative to U6 snRNA in P0 tissues prepared from WT or ΔMat individuals (n = 3 per genotype), as indicated below the histograms. BAT: brown adipose tissue. Data are expressed as mean ± s.e.m.
Expression of mRNAs (Dlk1 and Dio3) and mRNA-like transcripts (Gtl2, Rian, Mirg) was assayed by RT–qPCR relative to Gapdh mRNA in the indicated tissues. Blue and pink bars represent expression levels in ΔPat and ΔMat individuals, respectively (six individuals per genotype). Expression levels of WT were arbitrarily set to 1.
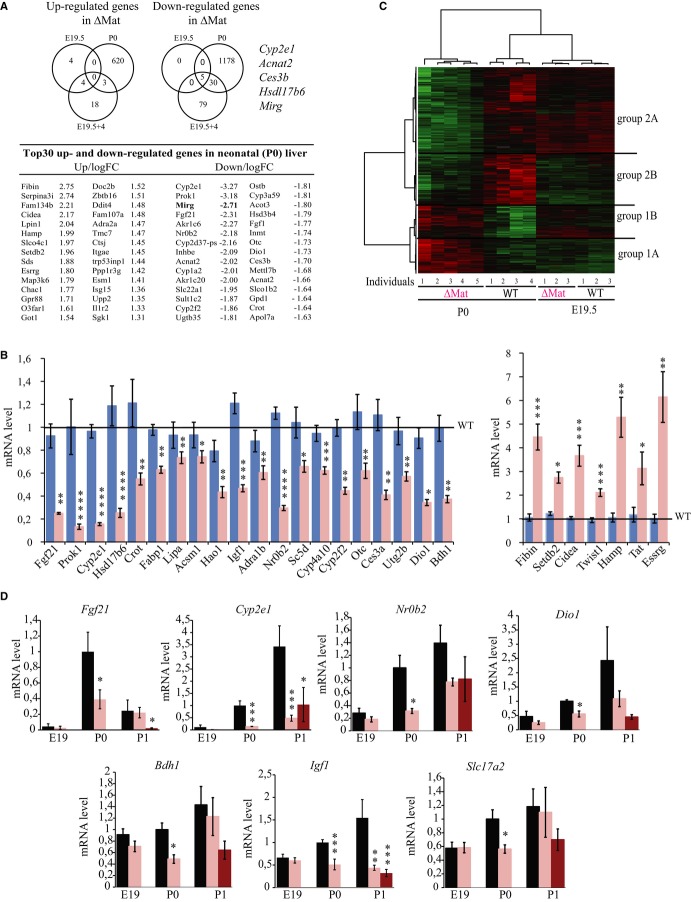
Top: Venn diagrams showing the number of up- and down-regulated genes revealed by Agilent microarrays at E19.5, E19.5 + 4, and P0 in ΔMat and WT livers (BH-adjusted P-value < 0.05). Bottom: Top 30 of up- and down-regulated genes. ncRNA genes and other poorly characterized transcripts, except the microRNA host gene (Mirg), were omitted from this microarray list.
Expression levels of selected misregulated genes validated by RT–qPCR. Blue and pink bars represent expression levels in ΔPat and ΔMat individuals, respectively. WT expression levels were arbitrarily set to 1.
Heatmap and hierarchical clustering of genes regulated in ΔMat vs. WT newborn livers at E19.5 or P0 (2,147 unique probes with BH-adjusted P-value < 0.05). Red: up-regulated; green: down-regulated; black: no change.
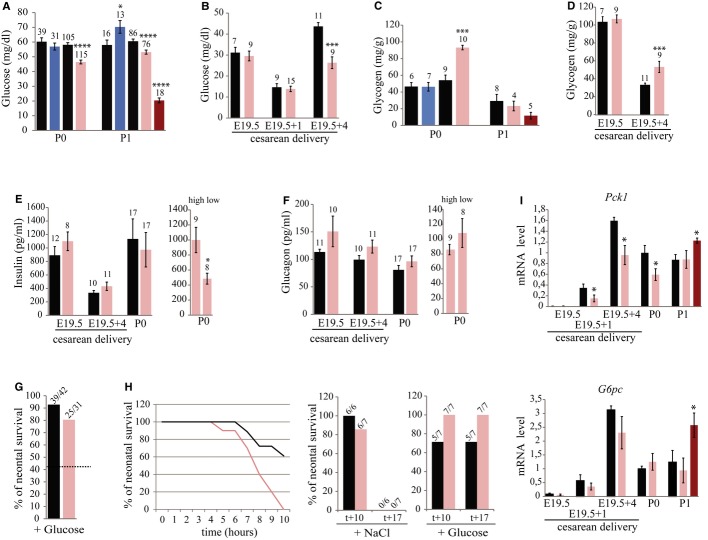
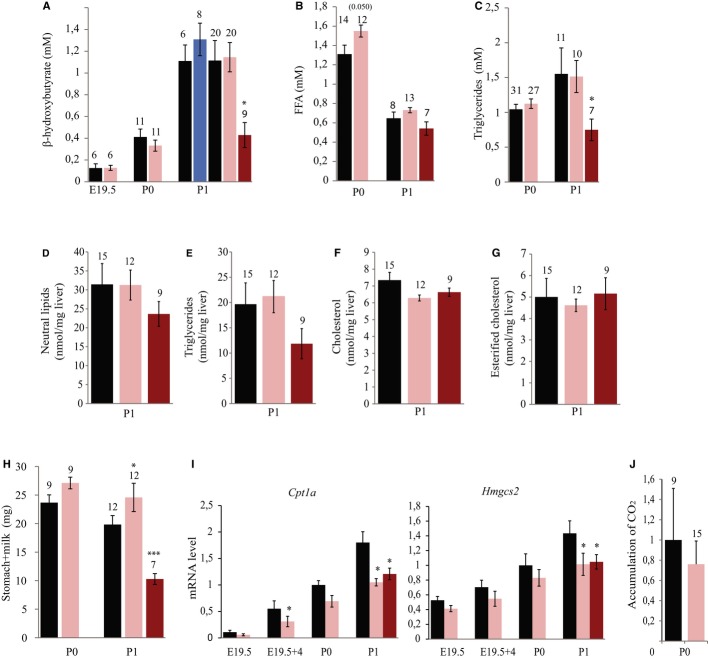
Perinatal expression of some genes was assayed by RT–qPCR analysis. Black and pink bars indicate expression levels in ΔPat and ΔMat individuals, respectively. Dark pink represents the most hypoglycemic mutant neonates at P1. WT expression levels at P0 were arbitrarily set to 1. Note that the dramatic decrease in Fgf21 mRNA levels in P1 hypoglycemic neonates may reflect the fact that fasting neonates display lower levels of Fgf21 expression (Hondares et al, 2010).
Similar articles
-
At least ten genes define the imprinted Dlk1-Dio3 cluster on mouse chromosome 12qF1.PLoS One. 2009;4(2):e4352. doi: 10.1371/journal.pone.0004352. Epub 2009 Feb 5. PLoS One. 2009. PMID: 19194500 Free PMC article.
-
Identification of Dlk1-Dio3 imprinted gene cluster noncoding RNAs as novel candidate biomarkers for liver tumor promotion.Toxicol Sci. 2013 Feb;131(2):375-86. doi: 10.1093/toxsci/kfs303. Epub 2012 Oct 22. Toxicol Sci. 2013. PMID: 23091169
-
Deletion of the miR-379/miR-410 gene cluster at the imprinted Dlk1-Dio3 locus enhances anxiety-related behaviour.Hum Mol Genet. 2016 Feb 15;25(4):728-39. doi: 10.1093/hmg/ddv510. Epub 2016 Jan 6. Hum Mol Genet. 2016. PMID: 26744330
-
[Review on the genomic imprinting at the mammalian DLK1-DIO3 cluster.].Yi Chuan. 2010 Aug;32(8):769-78. doi: 10.3724/sp.j.1005.2010.00769. Yi Chuan. 2010. PMID: 20709673 Review. Chinese.
-
The microRNAs within the DLK1-DIO3 genomic region: involvement in disease pathogenesis.Cell Mol Life Sci. 2013 Mar;70(5):795-814. doi: 10.1007/s00018-012-1080-8. Epub 2012 Jul 24. Cell Mol Life Sci. 2013. PMID: 22825660 Free PMC article. Review.
Cited by
-
DLK1/DIO3 locus upregulation by a β-catenin-dependent enhancer drives cell proliferation and liver tumorigenesis.Mol Ther. 2024 Apr 3;32(4):1125-1143. doi: 10.1016/j.ymthe.2024.01.036. Epub 2024 Feb 3. Mol Ther. 2024. PMID: 38311851 Free PMC article.
-
Quantification of microRNA editing using two-tailed RT-qPCR for improved biomarker discovery.RNA. 2021 Nov;27(11):1412-1424. doi: 10.1261/rna.078867.121. Epub 2021 Aug 25. RNA. 2021. PMID: 34433636 Free PMC article.
-
Changes in circulating microRNA levels can be identified as early as day 8 of pregnancy in cattle.PLoS One. 2017 Apr 5;12(4):e0174892. doi: 10.1371/journal.pone.0174892. eCollection 2017. PLoS One. 2017. PMID: 28380001 Free PMC article.
-
The Dlk1-Gtl2 Locus Preserves LT-HSC Function by Inhibiting the PI3K-mTOR Pathway to Restrict Mitochondrial Metabolism.Cell Stem Cell. 2016 Feb 4;18(2):214-28. doi: 10.1016/j.stem.2015.11.001. Epub 2015 Nov 25. Cell Stem Cell. 2016. PMID: 26627594 Free PMC article.
-
Single-nucleus transcriptomics reveals functional compartmentalization in syncytial skeletal muscle cells.Nat Commun. 2020 Dec 11;11(1):6375. doi: 10.1038/s41467-020-20064-9. Nat Commun. 2020. PMID: 33311457 Free PMC article.
References
-
- Attane C, Foussal C, Le Gonidec S, Benani A, Daviaud D, Wanecq E, Guzman-Ruiz R, Dray C, Bezaire V, Rancoule C, Kuba K, Ruiz-Gayo M, Levade T, Penninger J, Burcelin R, Penicaud L, Valet P, Castan-Laurell I. Apelin treatment increases complete Fatty Acid oxidation, mitochondrial oxidative capacity, and biogenesis in muscle of insulin-resistant mice. Diabetes. 2012;61:310–320. - PMC - PubMed
-
- Barrans A, Collet X, Barbaras R, Jaspard B, Manent J, Vieu C, Chap H, Perret B. Hepatic lipase induces the formation of pre-beta 1 high density lipoprotein (HDL) from triacylglycerol-rich HDL2. A study comparing liver perfusion to in vitro incubation with lipases. J Biol Chem. 1994;269:11572–11577. - PubMed
Publication types
MeSH terms
Substances
LinkOut - more resources
Full Text Sources
Other Literature Sources
Molecular Biology Databases
