Upregulation of immunoproteasome subunits in myositis indicates active inflammation with involvement of antigen presenting cells, CD8 T-cells and IFNΓ
- PMID: 25098831
- PMCID: PMC4123911
- DOI: 10.1371/journal.pone.0104048
Upregulation of immunoproteasome subunits in myositis indicates active inflammation with involvement of antigen presenting cells, CD8 T-cells and IFNΓ
Abstract
Objective: In idiopathic inflammatory myopathies (IIM) infiltration of immune cells into muscle and upregulation of MHC-I expression implies increased antigen presentation and involvement of the proteasome system. To decipher the role of immunoproteasomes in myositis, we investigated individual cell types and muscle tissues and focused on possible immune triggers.
Methods: Expression of constitutive (PSMB5, -6, -7) and corresponding immunoproteasomal subunits (PSMB8, -9, -10) was analyzed by real-time RT-PCR in muscle biopsies and sorted peripheral blood cells of patients with IIM, non-inflammatory myopathies (NIM) and healthy donors (HD). Protein analysis in muscle biopsies was performed by western blot. Affymetrix HG-U133 platform derived transcriptome data from biopsies of different muscle diseases and from immune cell types as well as monocyte stimulation experiments were used for validation, coregulation and coexpression analyses.
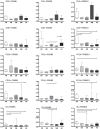
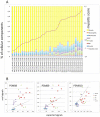
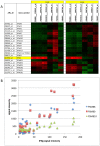
Results: Real-time RT-PCR revealed significantly increased expression of immunoproteasomal subunits (PSMB8/-9/-10) in DC, monocytes and CD8+ T-cells in IIM. In muscle biopsies, the immunosubunits were elevated in IIM compared to NIM and exceeded levels of matched blood samples. Proteins of PSMB8 and -9 were found only in IIM but not NIM muscle biopsies. Reanalysis of 78 myositis and 20 healthy muscle transcriptomes confirmed these results and revealed involvement of the antigen processing and presentation pathway. Comparison with reference profiles of sorted immune cells and healthy muscle confirmed upregulation of PSMB8 and -9 in myositis biopsies beyond infiltration related changes. This upregulation correlated highest with STAT1, IRF1 and IFNγ expression. Elevation of T-cell specific transcripts in active IIM muscles was accompanied by increased expression of DC and monocyte marker genes and thus reflects the cell type specific involvement observed in peripheral blood.
Conclusions: Immunoproteasomes seem to indicate IIM activity and suggest that dominant involvement of antigen processing and presentation may qualify these diseases exemplarily for the evolving therapeutic concepts of immunoproteasome specific inhibition.
Conflict of interest statement
Figures


Similar articles
-
The immunoproteasomes are key to regulate myokines and MHC class I expression in idiopathic inflammatory myopathies.J Autoimmun. 2016 Dec;75:118-129. doi: 10.1016/j.jaut.2016.08.004. Epub 2016 Aug 10. J Autoimmun. 2016. PMID: 27522114
-
Idiopathic inflammatory myopathies: from immunopathogenesis to new therapeutic targets.Int J Rheum Dis. 2015 Nov;18(8):818-25. doi: 10.1111/1756-185X.12736. Epub 2015 Sep 19. Int J Rheum Dis. 2015. PMID: 26385431 Review.
-
Gamma delta T cell receptor gene expression by muscle-infiltrating lymphocytes in the idiopathic inflammatory myopathies.Clin Exp Immunol. 1995 Jun;100(3):519-28. doi: 10.1111/j.1365-2249.1995.tb03732.x. Clin Exp Immunol. 1995. PMID: 7774065 Free PMC article.
-
Curcumin suppresses the induction of indoleamine 2,3-dioxygenase by blocking the Janus-activated kinase-protein kinase Cdelta-STAT1 signaling pathway in interferon-gamma-stimulated murine dendritic cells.J Biol Chem. 2009 Feb 6;284(6):3700-8. doi: 10.1074/jbc.M807328200. Epub 2008 Dec 15. J Biol Chem. 2009. PMID: 19075017
-
Dendritic cells and the immunopathogenesis of idiopathic inflammatory myopathies.Curr Opin Rheumatol. 2008 Nov;20(6):669-74. doi: 10.1097/BOR.0b013e3283157538. Curr Opin Rheumatol. 2008. PMID: 18946326 Review.
Cited by
-
CDK1 and CCNB1 as potential diagnostic markers of rhabdomyosarcoma: validation following bioinformatics analysis.BMC Med Genomics. 2019 Dec 23;12(1):198. doi: 10.1186/s12920-019-0645-x. BMC Med Genomics. 2019. PMID: 31870357 Free PMC article.
-
Synovial tissue transcriptomes of long-standing rheumatoid arthritis are dominated by activated macrophages that reflect microbial stimulation.Sci Rep. 2020 May 13;10(1):7907. doi: 10.1038/s41598-020-64431-4. Sci Rep. 2020. PMID: 32404914 Free PMC article.
-
Identification of Potential Prognosticators for Sepsis through Expression Analysis of Transcriptomic Data from Sepsis Survivors and Nonsurvivors.Acta Med Philipp. 2023 Jul 27;57(7):11-23. doi: 10.47895/amp.vi0.3934. eCollection 2023. Acta Med Philipp. 2023. PMID: 39483296 Free PMC article.
-
Inclusion body myositis, viral infections, and TDP-43: a narrative review.Clin Exp Med. 2024 May 2;24(1):91. doi: 10.1007/s10238-024-01353-9. Clin Exp Med. 2024. PMID: 38693436 Free PMC article. Review.
-
Complement-Mediated Enhancement of Monocyte Adhesion to Endothelial Cells by HLA Antibodies, and Blockade by a Specific Inhibitor of the Classical Complement Cascade, TNT003.Transplantation. 2017 Jul;101(7):1559-1572. doi: 10.1097/TP.0000000000001486. Transplantation. 2017. PMID: 28640789 Free PMC article.
References
-
- Dalakas MC, Hohlfeld R (2003) Polymyositis and dermatomyositis. Lancet 362: 971–982. - PubMed
-
- Dalakas MC (2004) Inflammatory disorders of muscle: progress in polymyositis, dermatomyositis and inclusion body myositis. Curr Opin Neurol 17: 561–567. - PubMed
-
- Dalakas MC (2006) Mechanisms of disease: signaling pathways and immunobiology of inflammatory myopathies. Nat Clin Pract Rheumatol 2: 219–227. - PubMed
-
- Rechsteiner M, Hoffman L, Dubiel W (1993) The multicatalytic and 26S proteases. J Biol Chem 268: 6065–6068. - PubMed
-
- Muratani M, Tansey WP (2003) How the ubiquitin-proteasome system controls transcription. Nat Rev Mol Cell Biol 4: 192–201. - PubMed
Publication types
MeSH terms
Substances
Grants and funding
LinkOut - more resources
Full Text Sources
Other Literature Sources
Medical
Molecular Biology Databases
Research Materials
Miscellaneous

