. 2014 Aug 20;83(4):894-905.
doi: 10.1016/j.neuron.2014.06.033. Epub 2014 Jul 31.

Sensory integration in mouse insular cortex reflects GABA circuit maturation

Affiliations

Sensory integration in mouse insular cortex reflects GABA circuit maturation

Nadine Gogolla et al. Neuron. .

Abstract

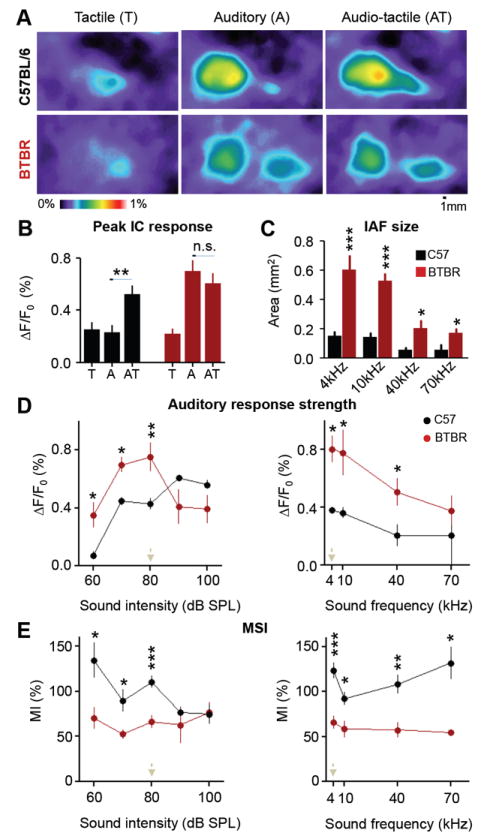
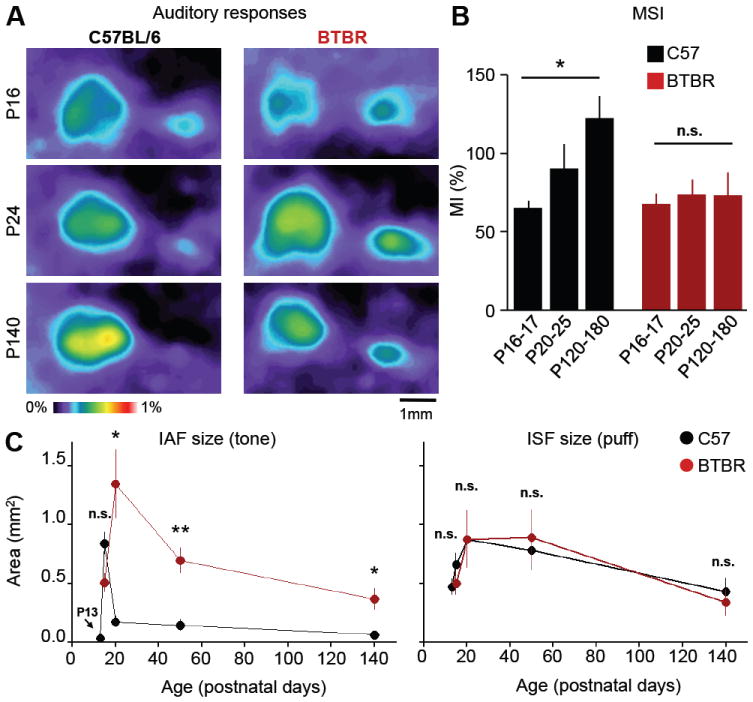
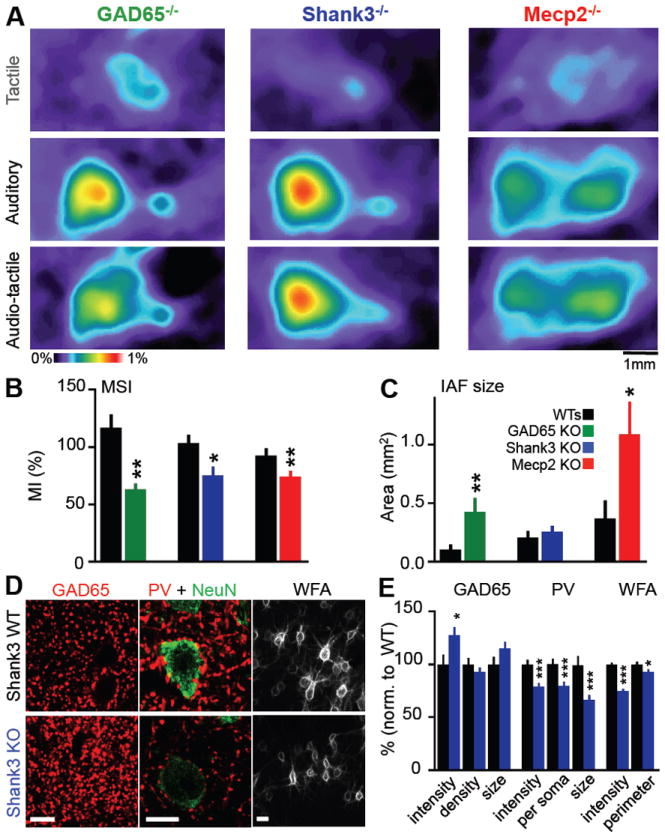
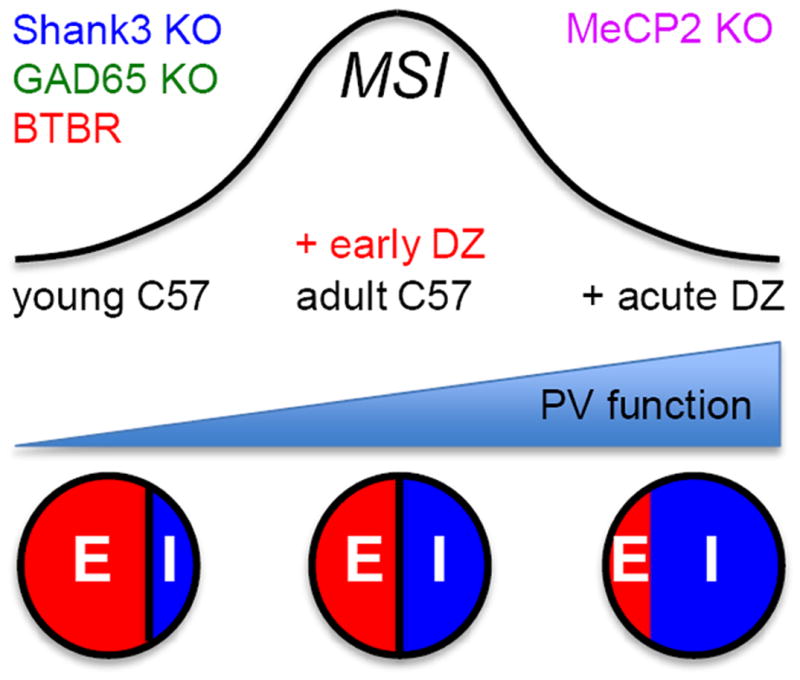
Insular cortex (IC) contributes to a variety of complex brain functions, such as communication, social behavior, and self-awareness through the integration of sensory, emotional, and cognitive content. How the IC acquires its integrative properties remains unexplored. We compared the emergence of multisensory integration (MSI) in the IC of behaviorally distinct mouse strains. While adult C57BL/6 mice exhibited robust MSI, this capacity was impaired in the inbred BTBR T+tf/J mouse model of idiopathic autism. The deficit reflected weakened γ-aminobutyric acid (GABA) circuits and compromised postnatal pruning of cross-modal input. Transient pharmacological enhancement by diazepam in BTBR mice during an early sensitive period rescued inhibition and integration in the adult IC. Moreover, impaired MSI was common across three other monogenic models (GAD65, Shank3, and Mecp2 knockout mice) displaying behavioral phenotypes and parvalbumin-circuit abnormalities. Our findings offer developmental insight into a key neural circuit relevant to neuropsychiatric conditions like schizophrenia and autism.


Figures

Figure 1
Figure 1. Intrinsic imaging of sensory integration in the mouse posterior insular cortex
(A) Left: Schematic of intrinsic flavoprotein imaging in temporal cortex. Right: Field of view (bottom) on the mouse brain (top). D, dorsal; C, caudal; R, rostral; V, ventral. Dotted purple lines demarcate the auditory cortices (AuCx) and posterior insular cortex (IC). (B) Stimuli for one trial consisted of sets of 30 alternating presentations of auditory, tactile and audio-tactile stimuli (10 each). (C) Regions of interest (ROI) for MSI measurements. Top left: Maximum intensity projections (MIPs) of 35 images following stimulus onset in 3-4 averaged trials. Bottom left: Binary Masks of MIPs were created at 15% maximal response constant threshold. Right: Overlay of binary masks for the insular somatosensory (ISF) and auditory (IAF) fields. ROIs were placed within the IAF at the interface with the ISF. (D) Localization of the IAF. Left: Schematic drawing of a coronal section at the level of the injection site into IAF (here -1.06 mm from Bregma). Middle: DiI trace within IAF on a Neurotrace (Nissl) stained section. Right: Higher magnification of the region in the dotted square. (AIP, agranular insular cortex posterior part; Cl, claustrum; DI, dysgranular insular cortex; GI, granular insular cortex; SII, secondary somatosensory cortex).
Figure 2
Figure 2. Differential multisensory processing in the insular cortex of C57 and BTBR mice
(A) Activation patterns upon tactile [T], auditory [A] and audio-tactile [AT] stimulation in adult C57 (top row) and BTBR mice (bottom row). (B) Peak response fluorescence (ΔF/F0) in the IC upon A, T and AT stimulation. AT responses are larger than auditory responses in adult C57 but not in BTBR mice (t test; **P < 0.01; n.s. = not significant, P > 0.05). (C) The size of tone activated IC (IAF) is consistently larger in adult BTBR than in C57 mice at different sound frequencies. (t test ***P<0.001, *P < 0.05). (D) Peak auditory response strengths upon different sound intensities (left) and frequencies (right) in the IAF. Left: BTBR exhibit significantly larger auditory responses at low to medium sound intensities (≤80dB) than C57 mice. Right: BTBR mice exhibit stronger auditory responses than C57 across frequencies lower than 70kHz. (E) Comparison of MSI expressed as a multisensory index (MI = [AT/(A+T)]*100) in C57 and BTBR mice. Left: C57 mice adhere to the inverse effectiveness rule as lower sound intensities elicit significantly stronger MSI than higher sound intensities (One-way ANOVA, *P<0.05), while MSI in BTBR mice is equally impaired throughout all sound intensities (One-way ANOVA, n.s., P=0.78). Right: C57 mice exhibit significantly stronger MSI than BTBR mice at all frequencies tested. (t tests; *P < 0.05, **P < 0.01, ***P < 0.001, n.s., P > 0.05). All values: mean ± s.e.m.
Figure 3
Figure 3. Impaired maturation of multisensory integration in BTBR mice
(A) With postnatal development, auditory representations contract in the IC of C57 mice but remain enlarged in BTBR mice. (B) MSI increases with age in the IC of C57 but not BTBR mice. One-way ANOVA (C57: *P < 0.05, BTBR: not significant, n.s.). (C) Left: insular auditory field (IAF) is rapidly pruned in C57 (no size change > P20) but not in BTBR mice (ANOVA, P<0.05) whose IAF sizes are significantly larger than in C57 mice at all ages > P20 (t test; *P<0.05, **P<0.01). Right: insular somatosensory field (ISF) sizes do not change within each group > P15 (for each, ANOVA P > 0.05) or differ between groups at any age (t tests; P > 0.05).
Figure 4
Figure 4. Weak inhibition impairs MSI in the IC of BTBR mice
(A) Decreased expression of inhibitory markers in BTBR mice. Left: Representative micrographs of GAD65 (top), PV (middle) and WFA (bottom) immunofluorescence in IC of C57 (left) and BTBR (right) mice. Scale bar: 10μm. Right: Quantitative analysis of GAD65+ puncta (top), PV+ puncta (middle) and WFA+ perineuronal nets (PNN). All values: mean ± s.e.m., normalized to C57 (100%). (B) Miniature inhibitory postsynaptic currents (mIPSCs) recorded in layer (L) 2/3 pyramidal cells of the granular insular cortex (GI) of C57 (black, sample trace top left) and BTBR (red, sample trace bottom left) mice. Note the significant decrease in mIPSC frequency in BTBR mice. C57, n=17; BTBR, n=22 cells. (C) Diazepam (DZ) bath application (15μM) prolongs inhibitory currents, producing a significant increase in mIPSC half-width and decay time in BTBR mice (top, sample traces before / after DZ; bottom, half-width measures). (D) Acute DZ treatment in vivo (arrow) yields transient loss of MSI in C57 (black, top), but rescues MSI temporarily in BTBR (red, bottom). Asterisks indicate significant differences from just before injection. All values: mean ± s.e.m. (t test; *P < 0.05, **P < 0.01, ***P < 0.001, n.s., P > 0.05).
Figure 5
Figure 5. Enhanced inhibition early in life permanently rescues MSI in BTBR mice
(A) Timeline of two diazepam (DZ) protocols in BTBR mice (see Experimental Procedures for details). (B) Uni- and multisensory responses in treated BTBR mice. Top row: vehicle-treated; bottom row: early DZ-treated. Note decrease in IAF size and rescue of multisensory integration in early DZ-treated animals. (C) Increased MSI by early DZ- as compared to adult DZ- or early vehicle treatment. (D) IAF size restricted significantly after early (but not adult) DZ treatment. (E) Early DZ rescues inhibitory markers in the IC of BTBR mice: immunohistochemistry against GAD65+ (left), PV+ puncta around NeuN+ somata (middle) and WFA+ perineuronal nets (PNN) (right) after early vehicle or DZ-treatment. Scale bars: 20μm (left), 4 μm (middle), 30 μm (right). (F) Quantitative analysis of GAD65+ puncta intensity, density and size (left), PV+ puncta intensity, number per NeuN+ soma and size (middle), PNN intensity, branch length and perimeter (right). All values: mean ± s.e.m., normalized to vehicle control (100%). (t test: *P < 0.05, **P < 0.01, ***P < 0.001, n.s., P > 0.05).
Figure 6
Figure 6. Shared multisensory integration deficits across monogenic mouse models of autism
(A) Tactile, auditory and audio-tactile responses in GAD65, Shank3 or MeCP2 knockout (KO) mice and (B) their impaired MSI. (C) Adult IAF sizes are enlarged in GAD65 and Mecp2 KO mice, but remain unaltered by deletion of Shank3. (D) Immunostaining for GABA markers in the IC of Shank3 KO animals exhibits (E) increased intensity of GAD65 puncta, while the intensity, number per pyramidal cell soma and size of PV puncta is decreased, as are WFA+ PNN size and intensity, compared to wild-type. Scale bar: 10μm. All values: mean ± s.e.m. (t test; *P < 0.05, **P <0.01).
Figure 7
Figure 7. Optimal range of PV circuit function underlies MSI in the IC
Multisensory integration in the IC reflects an optimal E/I circuit balance, in particular that of PV circuit function. Pharmacological or genetic manipulations which excessively weaken or strengthen PV-circuit function disrupt MSI in the adult insula.

Similar articles

Cited by

References

    1. Ackermann H, Riecker A. The contribution(s) of the insula to speech production: a review of the clinical and functional imaging literature. Brain Struct Funct. 2010;214:419–33. - PubMed
    1. Allen JS, Emmorey K, Bruss J, Damasio H. Morphology of the insula in relation to hearing status and sign language experience. J Neurosci. 2008;28:11900–5. 10. - PMC - PubMed
    1. Augustine JR. Circuitry and functional aspects of the insular lobe in primates including humans. Brain Res Brain Res Rev. 1996;22:229–44. - PubMed
    1. Babineau BA, Yang M, Berman RF, Crawley JN. Low home cage social behaviors in BTBR T+tf/J mice during juvenile development. Physiol Behav. 2013:114–115. 49–54. - PMC - PubMed
    1. Barkat TR, Polley DB, Hensch TK. A critical period for auditory thalamocortical connectivity. Nat Neurosci. 2011;14:1189–94. - PMC - PubMed

Publication types

MeSH terms