. 2014 Aug 1;28(15):1695-709.
doi: 10.1101/gad.244434.114.

Two distinct promoter architectures centered on dynamic nucleosomes control ribosomal protein gene transcription

Affiliations

Two distinct promoter architectures centered on dynamic nucleosomes control ribosomal protein gene transcription

Britta Knight et al. Genes Dev. .

Erratum in

  • Genes Dev. 2014 Oct 1;28(19):2188

Abstract

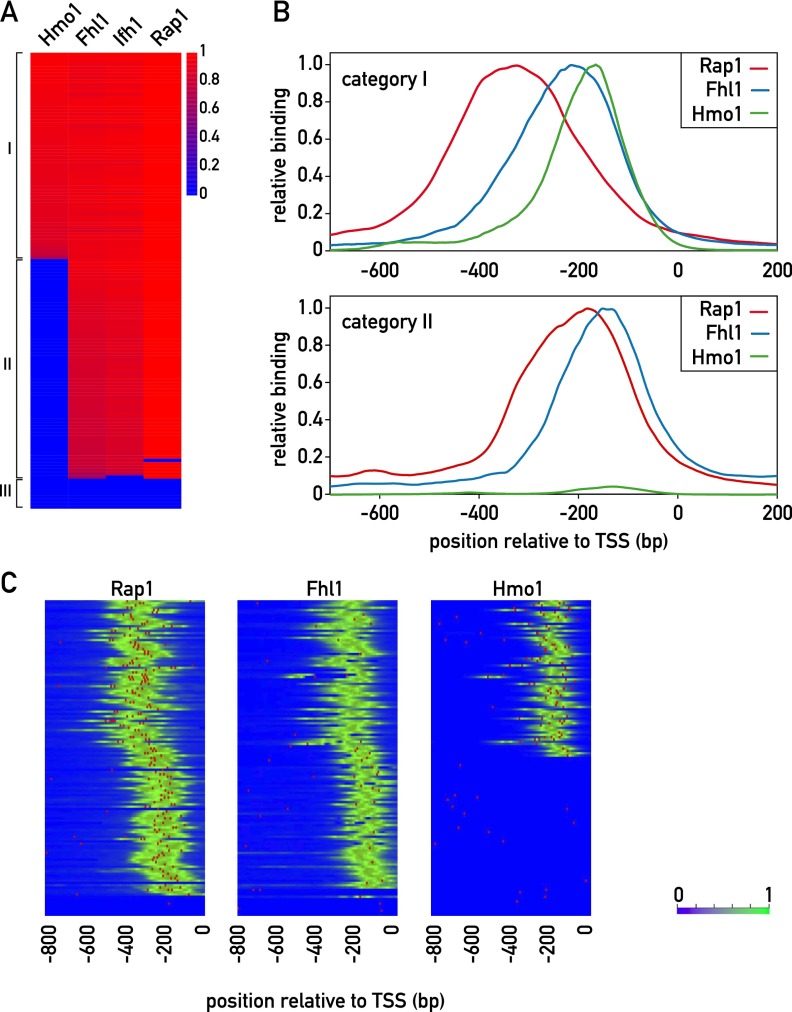
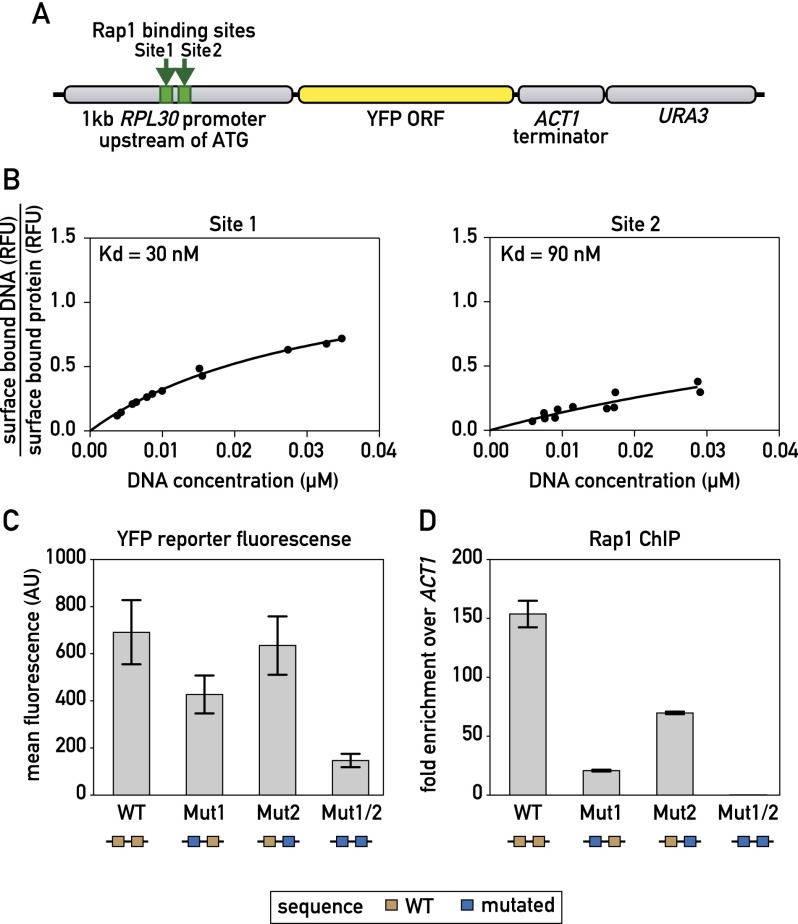
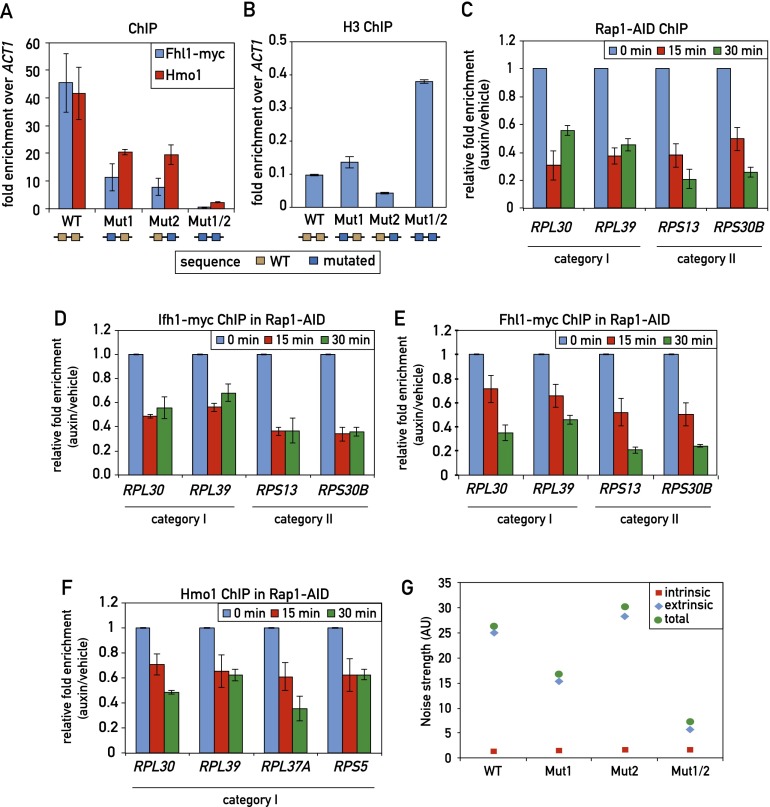
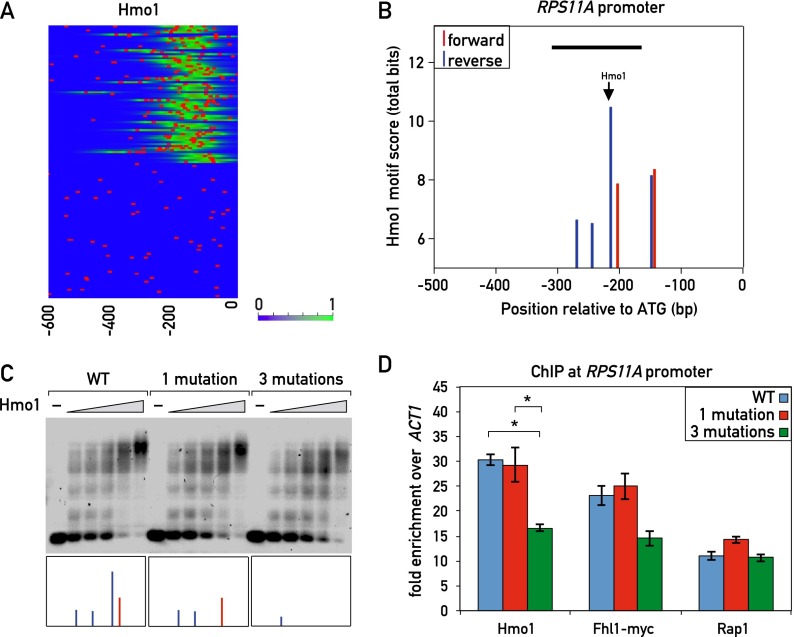
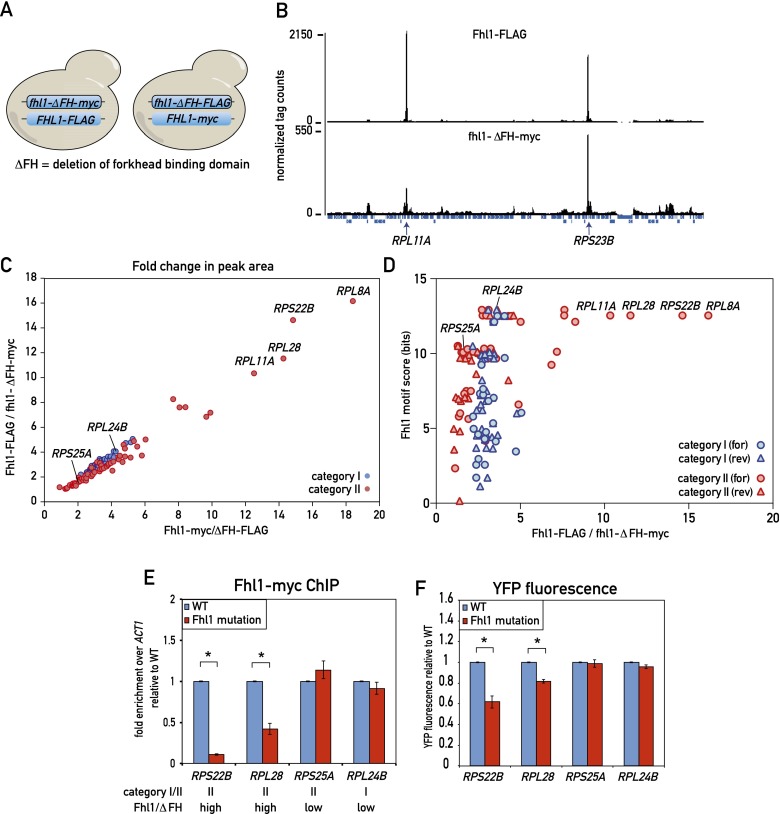
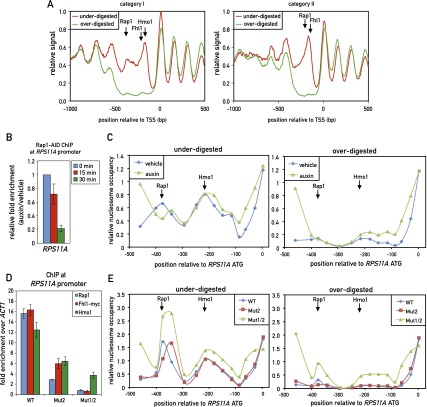
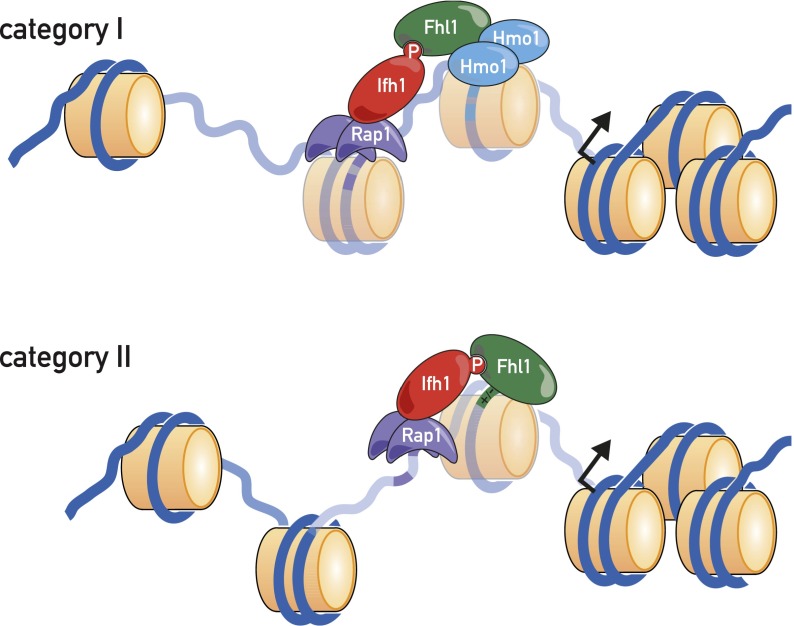
In yeast, ribosome production is controlled transcriptionally by tight coregulation of the 138 ribosomal protein genes (RPGs). RPG promoters display limited sequence homology, and the molecular basis for their coregulation remains largely unknown. Here we identify two prevalent RPG promoter types, both characterized by upstream binding of the general transcription factor (TF) Rap1 followed by the RPG-specific Fhl1/Ifh1 pair, with one type also binding the HMG-B protein Hmo1. We show that the regulatory properties of the two promoter types are remarkably similar, suggesting that they are determined to a large extent by Rap1 and the Fhl1/Ifh1 pair. Rapid depletion experiments allowed us to define a hierarchy of TF binding in which Rap1 acts as a pioneer factor required for binding of all other TFs. We also uncovered unexpected features underlying recruitment of Fhl1, whose forkhead DNA-binding domain is not required for binding at most promoters, and Hmo1, whose binding is supported by repeated motifs. Finally, we describe unusually micrococcal nuclease (MNase)-sensitive nucleosomes at all RPG promoters, located between the canonical +1 and -1 nucleosomes, which coincide with sites of Fhl1/Ifh1 and Hmo1 binding. We speculate that these "fragile" nucleosomes play an important role in regulating RPG transcriptional output.

Keywords: Rap1; fragile nucleosome; ribosomal protein gene; transcription; yeast.


Figures

Figure 1.
Figure 1.
Identification of distinct promoter architectures for RPG promoters. (A) ChIP-seq signals for the TFs Hmo1, Fhl1, Ifh1, and Rap1. The log-transformed signals (peak area) are color-coded as indicated. Signals were normalized to the maximum value over the whole set of RPG promoters for each TF. In the cases where no peak was found on the promoter, the value is given as 0. (B) Normalized average ChIP-seq profiles (Y-axis) for category I (top panel) and category II (bottom panel) promoters (X-axis; 0 indicates TSS). (Red) Rap1; (blue) Fhl1; (green) Hmo1. (C) Rap1, Fhl1, and Hmo1 ChIP-seq signals (green) and motifs (red) for all RPG promoters, ordered as in A. Motifs were defined according to the ChIP-seq-derived weight matrix in Supplemental Figure S2A. (Left) For Rap1, the threshold was 9.6 bits, and the maximum score was 23.5 bits. (Middle) For Fhl1, the threshold was 8.7 bits, and the maximum score was 12.5 bits. (Right) For Hmo1, the threshold was 10.6, and the maximum score was 15.2 bits. See also Supplemental Figures S1–S4 and Supplemental Tables S2 and S3.
Figure 2.
Figure 2.
Correlation between Rap1-binding constant and promoter output. (A) Schematic showing the RPL30 promoter-YFP reporter construct that was integrated at the LEU2 locus. (B) MITOMI measurements of the fraction of surface-bound target DNA are plotted against the concentration of target DNA in solution for the indicated binding site probes. Dissociation constants (Kd) were determined by performing a nonlinear regression fit using a one-site binding model. (C) YFP fluorescence measured by flow cytometry of exponentially growing cells containing the indicated RPL30 promoter-YFP reporter constructs. Data are represented as mean ± SEM. (D) Rap1 occupancy (qPCR-ChIP) on the indicated RPL30 promoter-YFP reporter constructs. Data are represented as mean ± SEM. See also Supplemental Figure S5.
Figure 3.
Figure 3.
Effect of Rap1 on TF recruitment and transcription noise strength. (A) Fhl1 and Hmo1 promoter occupancy (qPCR-ChIP) on the indicated RPL30 promoter alleles. Data are represented as mean ± SEM. (B) Histone H3 occupancy (qPCR-ChIP) on the indicated RPL30 promoter alleles. Data are represented as mean ± SEM. (C–F) RPG promoter occupancy of Rap1-AID (C), Ifh1-Myc (D), Fhl1-Myc (E), and Hmo1 (F) at the indicated times following auxin-induced depletion of AID-tagged Rap1. Data are plotted as auxin relative to vehicle treatment and normalized to t = 0. Data are represented as mean ± SEM. (G) The intrinsic and extrinsic noise strength of the wild-type and mutant versions of the RPL30 promoter were measured by microscopy using diploid yeast cells containing both RPL30 promoter-YFP reporter and RPL30 promoter-CFP reporter constructs.
Figure 4.
Figure 4.
Sequence specificity of Hmo1 binding. (A) Hmo1 ChIP-seq signal (green) and Hmo1 motifs (red bars; derived with a low threshold of 5 bits from the ChIP-seq-derived position weight matrix [PWM] in Supplemental Fig. S2A). (B) Hmo1 motif scores (total bits based on ChIP-seq-derived PWM in Supplemental Fig. S2A) for both forward (red) and reverse (blue) sites at the RPS11A promoter. Peak Hmo1 binding by ChIP-seq is shown with an arrow. The black bar indicates the fragment of DNA that was used in the EMSA in C. (C) Cy5-labeled DNA templates of the wild-type RPS11A promoter fragment (−313 bp to −163 bp relative to the ATG; left) or the indicated mutant fragments (middle and right) were incubated with increasing amounts of 6xHis-Hmo1 protein and electrophoresed on a 0.7% agarose gel (see the Materials and Methods for details). The boxes at the bottom represent the forward (red) and reverse (blue) Hmo1 motifs that were present in the corresponding DNA fragment (see B for details). (D) Hmo1, Rap1, and Fhl1 occupancy, measured by qPCR-ChIP, on the wild-type and Hmo1 site mutant RPS11A promoters. Data are represented as mean ± SEM. A one-way ANOVA test was used to compare the means for each factor. (*) P < 0.05 using a Tukey post-hoc test. See also Supplemental Figure S6.
Figure 5.
Figure 5.
Role of the Fhl1 FH domain in RPG promoter binding in vivo. (A) Schematic depicting the experimental setup. (Left) Diploid cells expressing both Fhl1-Flag and fhl1-ΔFH-myc were analyzed by parallel anti-Flag and anti-myc ChIP-seq from a single culture. (Right) The experiment was repeated with an isogenic tagged swapped strain (Fhl1-myc, fhl1-ΔFH-Flag). (B) ChIP-seq “tag count” plots from a region on chromosome VII for the indicated Fhl1 proteins. The positions of two RPGs in this region (RPL11A and RPS23B) are marked. (C) ChIP-seq peak area ratios (for the indicated tagged proteins) for all category I (blue) and category II (red) RPGs. Specific genes referred to below or in the text are marked. (D) The score of the strongest potential Fhl1-binding motif (either forward or reverse, as indicated) found in the 500-bp region upstream of the TSS for each RPG (bit scores calculated as in Fig. 4B) is plotted against the ChIP-seq peak area ratio for the wild type versus ΔFH (Fhl1-Flag-fhl1-ΔFH-myc) for the respective promoter. (E) Fhl1-myc ChIP signals for wild-type and Fhl1 site mutants of the indicated RPG promoters. The category and ChIP-seq ratio (wild type vs. fhl1-ΔFH) are indicated below the gene name for each promoter. Data are represented as mean ± SEM. A Student’s t-test was used to compare the means between wild type and the Fhl1 site mutants for each promoter. (*) P < 0.05. (F) The YFP fluorescence of the indicated promoter constructs (both wild type and Fhl1 site mutants) was measured by flow cytometry of exponentially growing cells and is reported relative to the wild-type value. Data are represented as mean ± SEM. A Student’s t-test was used to compare the means between wild type and the Fhl1 site mutants for each promoter. (*) P < 0.05. See also Supplemental Figure S7.
Figure 6.
Figure 6.
TF binding at both category I and category II promoters overlaps with unusually MNase-labile chromatin. (A) Chromatin was underdigested or overdigested with MNase and sequenced (see the Materials and Methods). The average relative signal (a proxy for nucleosome occupancy) for category I (left) and category II (right) promoters aligned to their TSSs is plotted. Arrows mark the average positions of peak binding of Rap1, Fhl1, and Hmo1, as measured by ChIP-seq. (B) RPS11A promoter occupancy of Rap1 after auxin-induced depletion of AID-tagged Rap1. Data are plotted as auxin relative to vehicle treatment and normalized to t = 0. Data are represented as mean ± SEM. (C) Chromatin was underdigested (left panel) or overdigested (right panel) with MNase either before or 30 min after auxin-induced depletion of AID-tagged Rap1. Tiling qPCR reactions were used to measure DNA protection. (D) RPS11A promoter occupancy of Rap1, Fhl1-myc, and Hmo1 on the wild-type RPS11A promoter and promoters with one (Mut2) or two (Mut1/2) Rap1 sites mutated. The RPS11A promoter contains two forward Rap1-binding sites located at −404 bp and −384 bp upstream of the ATG. Mut2 corresponds to mutation of the −384-bp site, and Mut1/2 corresponds to mutation of both sites. Data are represented as mean ± SEM. (E) Chromatin from the indicated strains (RPS11A wild-type or mutant promoters, as described in C was underdigested (left panel) or overdigested (right panel) with MNase. DNA was measured as in C. See also Supplemental Figures S8 and S9.
Figure 7.
Figure 7.
Schematic of TFs and nucleosomes present at category I and category II RPG promoters.

Similar articles

Cited by

References

    1. Badis G, Chan ET, van Bakel H, Pena-Castillo L, Tillo D, Tsui K, Carlson CD, Gossett AJ, Hasinoff MJ, Warren CL, et al. . 2008. A library of yeast transcription factor motifs reveals a widespread function for Rsc3 in targeting nucleosome exclusion at promoters. Mol Cell 32: 878–887 - PMC - PubMed
    1. Bailey TL, Williams N, Misleh C, Li WW. 2006. MEME: discovering and analyzing DNA and protein sequence motifs. Nucleic Acids Res 34: W369–W373 - PMC - PubMed
    1. Berry DB, Gasch AP. 2008. Stress-activated genomic expression changes serve a preparative role for impending stress in yeast. Mol Biol Cell 19: 4580–4587 - PMC - PubMed
    1. Brauer MJ, Huttenhower C, Airoldi EM, Rosenstein R, Matese JC, Gresham D, Boer VM, Troyanskaya OG, Botstein D. 2008. Coordination of growth rate, cell cycle, stress response, and metabolic activity in yeast. Mol Biol Cell 19: 352–367 - PMC - PubMed
    1. Cai L, McCormick MA, Kennedy BK, Tu BP. 2013. Integration of multiple nutrient cues and regulation of lifespan by ribosomal transcription factor Ifh1. Cell Rep 4: 1063–1071 - PMC - PubMed

Publication types

MeSH terms