. 2014 Jul 31;158(3):659-72.
doi: 10.1016/j.cell.2014.06.050.

Partitioning circadian transcription by SIRT6 leads to segregated control of cellular metabolism

Affiliations

Partitioning circadian transcription by SIRT6 leads to segregated control of cellular metabolism

Selma Masri et al. Cell. .

Abstract

Circadian rhythms are intimately linked to cellular metabolism. Specifically, the NAD(+)-dependent deacetylase SIRT1, the founding member of the sirtuin family, contributes to clock function. Whereas SIRT1 exhibits diversity in deacetylation targets and subcellular localization, SIRT6 is the only constitutively chromatin-associated sirtuin and is prominently present at transcriptionally active genomic loci. Comparison of the hepatic circadian transcriptomes reveals that SIRT6 and SIRT1 separately control transcriptional specificity and therefore define distinctly partitioned classes of circadian genes. SIRT6 interacts with CLOCK:BMAL1 and, differently from SIRT1, governs their chromatin recruitment to circadian gene promoters. Moreover, SIRT6 controls circadian chromatin recruitment of SREBP-1, resulting in the cyclic regulation of genes implicated in fatty acid and cholesterol metabolism. This mechanism parallels a phenotypic disruption in fatty acid metabolism in SIRT6 null mice as revealed by circadian metabolome analyses. Thus, genomic partitioning by two independent sirtuins contributes to differential control of circadian metabolism.


Figures

Figure 1
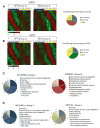
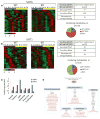
Figure 1. The SIRT6 and SIRT1 Circadian Transcriptomes
(A and B) DNA microarray analysis was performed using mouse liver total RNA from ZT 0, 4, 8, 12, 16, and 20. Using JTK_cycle, genes selected to be circadian at a p value < 0.01 are displayed as heat maps for WT and SIRT6 KO livers (A) and WT and SIRT1 KO livers (B). Heat maps on the left side show genes that oscillate in WT (groups 1 and 3) with dampened or flat gene expression in SIRT6 KO (group 2) or SIRT1 KO (group 4). Heat maps on the right side display genes with more robust circadian expression when the sirtuins are disrupted. Pie charts indicate actual numbers of circadian genes for the SIRT6 and SIRT1 transcriptomes. Biological function analysis was performed using DAVID. GO terms for molecular function, biological process, and cellular component were used. (C and D) Top ten GO terms, based on a 0.01 p value cutoff, are shown for the SIRT6 transcriptome (C) and the SIRT1 transcriptome (D). Numbers bordering different pie slices indicate how many times that GO term was found in the four pie charts shown.
Figure 2
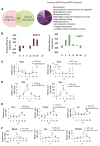
Figure 2. Comparison of SIRT6 and SIRT1-Dependent Circadian Gene Expression
(A) Venn diagram displays genes with common circadian expression profiles in SIRT6 KO and SIRT1 KO microarray data sets. Right panel illustrates GO terms enriched in the 160 common genes similarly regulated by SIRT6 and SIRT1. Top ten GO terms (molecular function, biological process, and cellular component) were selected based on a 0.01 p value cutoff using DAVID. (B) Relative phase of expression of significant genes (p value < 0.01) from SIRT6 and SIRT1 microarray data. Phase of SIRT6 KO or SIRT1 KO genes at indicated ZTs is shown relative to WT. (C) Gene expression profiles of Npnt in WT and SIRT6 KO or SIRT1 KO mouse liver based on quantitative real-time PCR analysis. Total RNA was extracted from three to five independent livers at indicated ZTs. (D) Gene expression, based on real-time PCR, for Dbp in WT and SIRT6/SIRT1 disrupted livers. (E) Expression profiles for Fasn, Hmgcr, and Lss genes with increased circadian amplitude exclusively in SIRT6 KO versus WT. (F) Expression of genes oscillating more robustly only in SIRT1 KO livers versus WT, including Rgs16, Sds, and Mthfd1l. Gene expression was normalized relative to 18S rRNA expression. Error bars indicate SEM. Significance was calculated using Student’s t test and *, **, and *** indicate p value cutoffs of 0.05, 0.01, and 0.001, respectively. Primer sequences used for gene expression analysis are in Table S2.
Figure 3
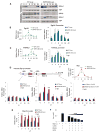
Figure 3. SIRT6 Regulates the Circadian Transcriptional Machinery
(A) Western analysis of fractionated liver (nucleoplasm and chromatin-enriched fractions) at indicated ZTs. (B and C) ChIP analysis in WT and SIRT1 KO livers at indicated ZTs using n = 3 independent livers per genotype and time point. Left panels display gene expression profile, and right panels display BMAL1 recruitment to Rgs16 and Mthfd1l gene promoters by ChIP, as compared to rabbit IgG negative control. (D) BMAL1 ChIP analysis in WT and SIRT6 KO liver to the Dbp promoter and Intron 1. Schematic of the Dbp promoter: blue boxes illustrate locations of E boxes, and red arrows indicate locations of real-time PCR primers used for ChIP. Numbers shown above E boxes indicate locations relative to the TSS. Dbp expression is on the right. BMAL1 ChIP data illustrate recruitment to the Dbp promoter, Intron I, and 3′ UTR regions. (E) AcH3 ChIP data at the Dbp Promoter in WT and SIRT6 KO livers at indicated ZTs. (F) Luciferase assays were performed in JEG3 and HEK293 cells by ectopically expressing CLOCK, BMAL1, and SIRT6 with a Dbp luciferase reporter. 50–100 ng of CLOCK and BMAL1 expression plasmids were expressed with increasing amounts of SIRT6 (2–50 ng). Error bars indicate SEM. For real-time PCR and ChIP data, significance was calculated using Student’s t test and *, **, and *** indicate p value cutoffs of 0.05, 0.01, and 0.001, respectively. Primer sequences used for gene expression and ChIP analysis are listed in Tables S2 and S3.
Figure 4
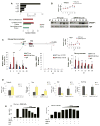
Figure 4. SIRT6, CLOCK, and BMAL1 Interact in an Exclusive Complex from SIRT1
(A and B) Co-IP experiments were performed in HEK293 cells by ectopically expressing myc-CLOCK, myc-BMAL1, flag-SIRT6, and myc-SIRT1. IP was performed with either anti-myc antibody or Flag-M2 agarose beads overnight, as indicated. Western was performed with anti-myc and anti-flag antibodies as indicated. (C) myc-CLOCK and myc-BMAL1 were ectopically expressed in HEK293 cells with flag-SIRT6 alone or flag-SIRT6 + myc-SIRT1. Whole-cell extracts (WCEs) were used for Flag IP. (D) WT liver was fractionated at the indicated ZTs, and nucleoplasmic and chromatin fractions were probed for endogenous SIRT6 and SIRT1 protein expression. (E) myc-CLOCK and myc-BMAL1 were ectopically expressed in HEK293 cells with flag-SIRT6 alone or flag-SIRT6 + myc-SIRT1. Cells were fractionated and chromatin fraction was used for Flag IP. (F) Sequential IPs were performed from HEK293 cells ectopically expressing HA-SIRT6, Flag-SIRT1, and myc-CLOCK. Primary IP was performed with Flag (SIRT1), and secondary IP from the same lysates was done with HA (SIRT6) to reveal myc-CLOCK interaction. (G) BMAL1 acetylation assay was performed in HEK293 cells with ectopic expression of myc-CLOCK, myc-BMAL1, Flag-SIRT6, and Flag-SIRT1 (WT and catalytic mutant). IP was performed with anti-myc and Western with anti-Ac BMAL1 antibody.
Figure 5
Figure 5. SIRT6 Modulates SREBP-Mediated Circadian Transcription
(A) MotifMap analysis of transcription factor binding sites enriched in gene promoters with altered expression when SIRT6 is disrupted (p value cutoff of 0.01 using JTK_cycle) (top). Search criteria were limited to 1 kb upstream of the TSS, with an FDR cutoff of 0.2 and a BBLS score of 0. Bottom displays overlapping SREBP1 target genes with SIRT6 and SIRT1-dependent genes. Genes are grouped in biological function by GO terms indicated. (B) Gene expression as determined by real-time PCR and protein expression by western of Srebp-1c in WT and SIRT6 KO nuclear extracts. (C) ChIP analysis on the Fasn promoter in WT and SIRT6 KO livers. Schematic of the Fasn promoter, with SRE-1 (green box) and E box (blue box) sites indicated. Right panel indicates Fasn gene expression, and bottom panel displays SREBP1 recruitment to the Fasn promoter and 3′ UTR by ChIP. AcH3 levels as determined by ChIP analysis at the Fasn promoter are shown. (D) Gene expression as determined by real-time PCR of Srebp-1c, Fasn, Dbp, and Rev-Erbα at ZT4 and ZT16 in WT and SREBP-1c KO livers. Gene expression was normalized relative to 18S rRNA expression. (E) Luciferase assays in JEG3 and HEK293 cells using two different Fasn luciferase reporters ectopically expressed with SREBP-1c (50 ng), SIRT6 (2–50 ng) or SIRT1 (50 ng). Left panel displays data using the Fasn-Luc −1594/+65 reporter, which contains the SRE binding site for SREBP1c-mediated transcription. Right panel shows luciferase activity using the Fas-Luc −65 MT reporter. Error bars indicate SEM. For real-time PCR and ChIP data, significance was calculated using Student’s t test, and *, **, and *** indicate p value cutoffs of 0.05, 0.01, and 0.001, respectively. Primer sequences used for gene expression and ChIP analysis are listed in Tables S2 and S3.
Figure 6
Figure 6. The SIRT6 and SIRT1 Circadian Metabolomes
(A and B) Heat maps displaying oscillating metabolites as determined by JTK_cycle (p value < 0.05) for SIRT6 (A) and SIRT1 (B) metabolomes. Left panels display circadian metabolites exclusively in WT liver, and right panels show metabolites with more robust oscillation when the sirtuin is disrupted. Tables and pie charts indicate number of significant metabolites using ANOVA and JTK_cycle at p value < 0.05 for time point and genotype. (C) Biological classification of significant circadian metabolites for SIRT6 and SIRT1. Metabolites were grouped into six biological classifications indicated, and total numbers of significant metabolites in SIRT KOs were normalized to WT livers. (D) Fatty acid metabolic pathways are outlined, and significantly disrupted genes or metabolites for SIRT6 are shown. Genes are indicated in black, and metabolites are indicated in red font.
Figure 7
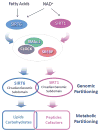
Figure 7. SIRT6 versus SIRT1-Dependent Circadian Functions
Scheme representing diverging functions of SIRT6 and SIRT1 in controlling circadian gene expression and metabolism. Different control mechanisms result in a SIRT6- and SIRT1-specific partitioning of the circadian genome that is paralleled by differential metabolic phenotypes.

Comment in

Similar articles

Cited by

References

    1. Asher G, Gatfield D, Stratmann M, Reinke H, Dibner C, Kreppel F, Mostoslavsky R, Alt FW, Schibler U. SIRT1 regulates circadian clock gene expression through PER2 deacetylation. Cell. 2008;134:317–328. - PubMed
    1. Belden WJ, Lewis ZA, Selker EU, Loros JJ, Dunlap JC. CHD1 remodels chromatin and influences transient DNA methylation at the clock gene frequency. PLoS Genet. 2011;7:e1002166. - PMC - PubMed
    1. Bellet MM, Nakahata Y, Boudjelal M, Watts E, Mossakowska DE, Edwards KA, Cervantes M, Astarita G, Loh C, Ellis JL, et al. Pharmacological modulation of circadian rhythms by synthetic activators of the deacetylase SIRT1. Proc Natl Acad Sci USA. 2013;110:3333–3338. - PMC - PubMed
    1. Bennett MK, Lopez JM, Sanchez HB, Osborne TF. Sterol regulation of fatty acid synthase promoter. Coordinate feedback regulation of two major lipid pathways. J Biol Chem. 1995;270:25578–25583. - PubMed
    1. Chang HC, Guarente L. SIRT1 mediates central circadian control in the SCN by a mechanism that decays with aging. Cell. 2013;153:1448–1460. - PMC - PubMed

Publication types

Associated data