. 2014 Sep 4;513(7516):65-70.
doi: 10.1038/nature13485. Epub 2014 Jul 27.

RNA G-quadruplexes cause eIF4A-dependent oncogene translation in cancer

Affiliations

RNA G-quadruplexes cause eIF4A-dependent oncogene translation in cancer

Andrew L Wolfe et al. Nature. .

Abstract

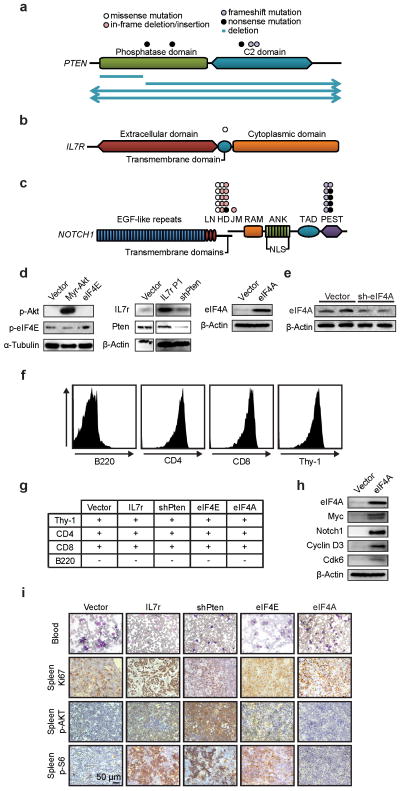
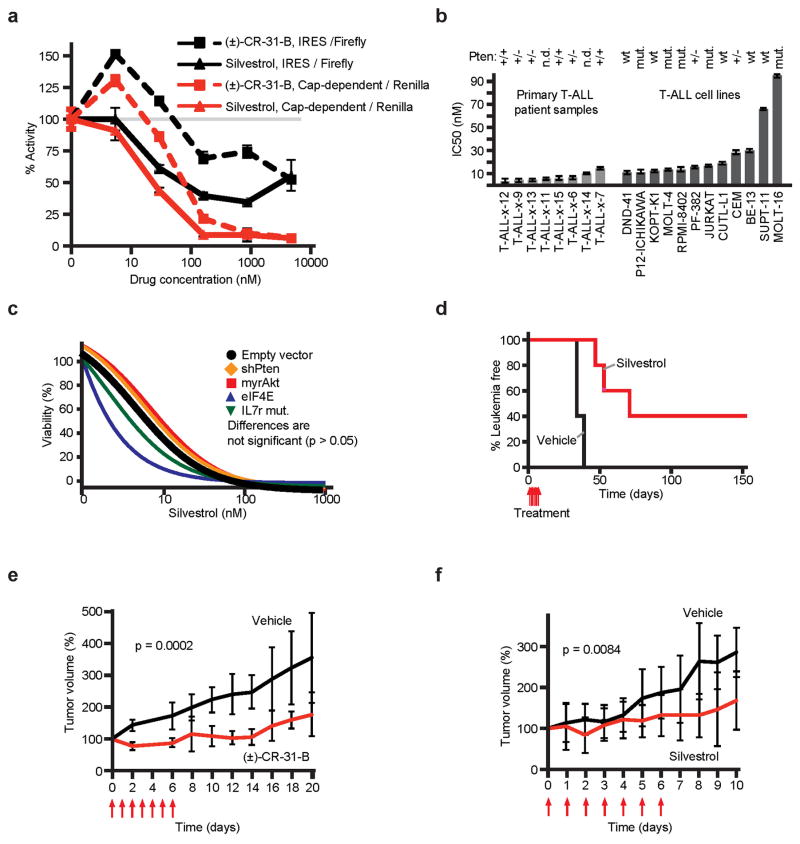
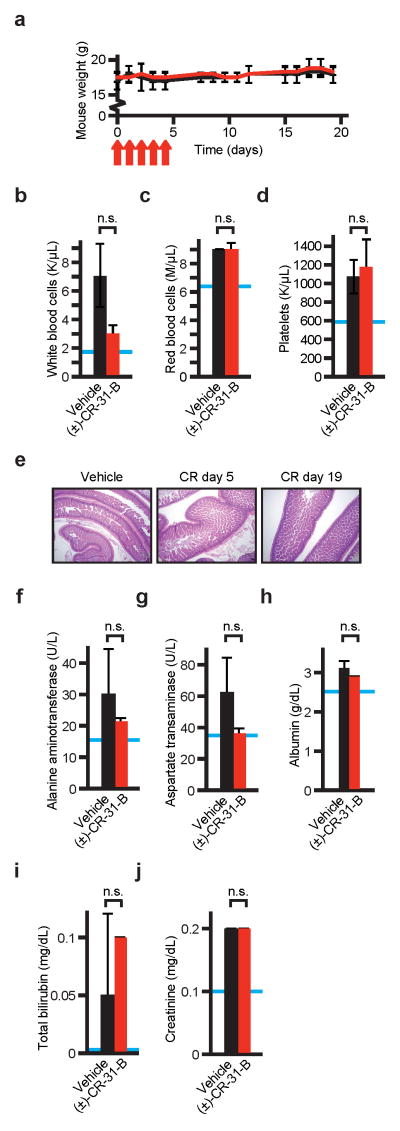
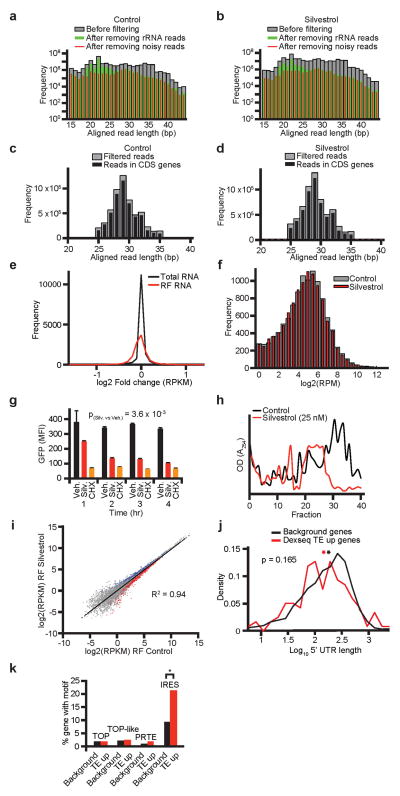
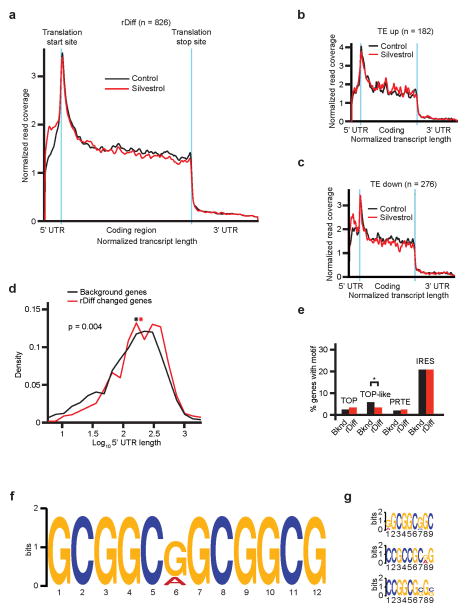
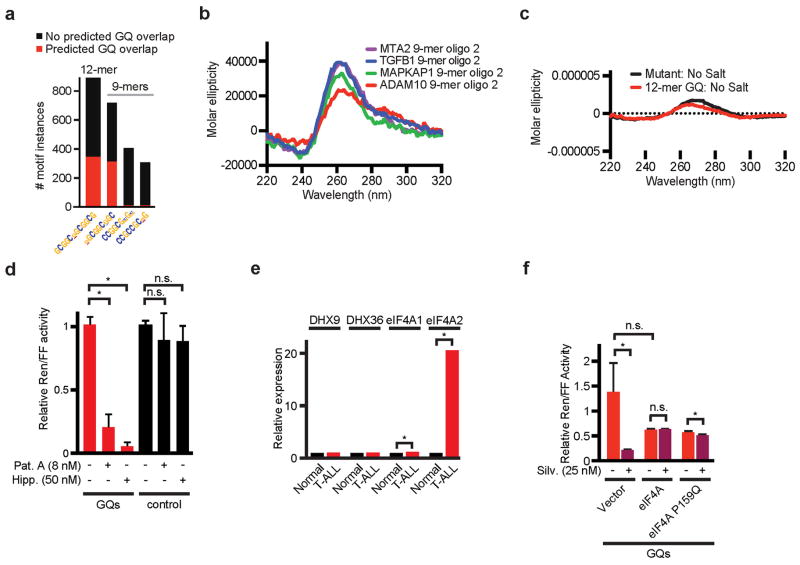
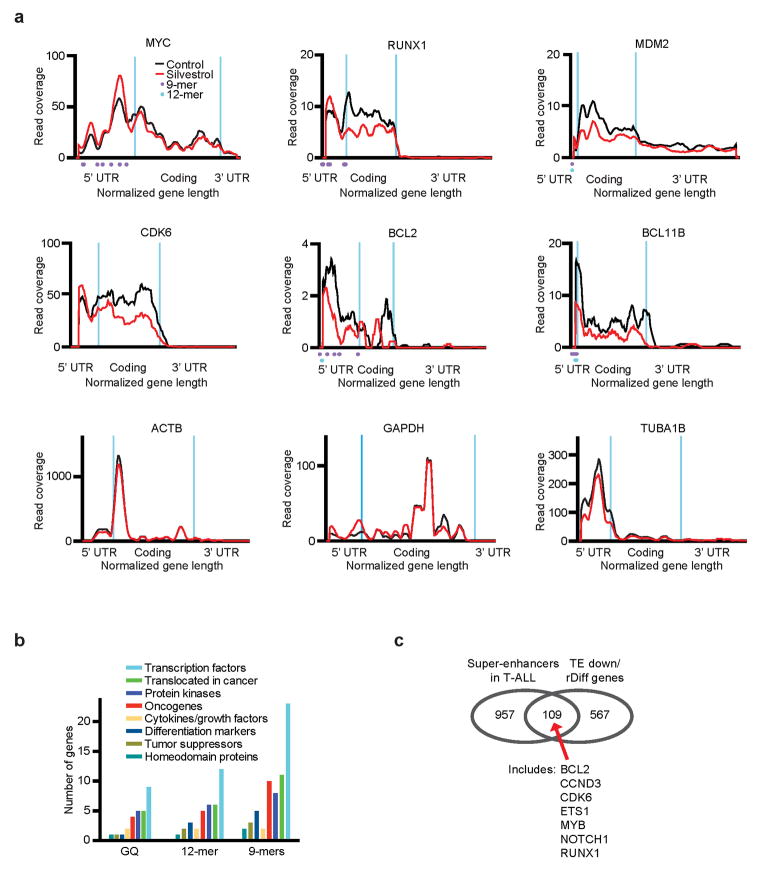
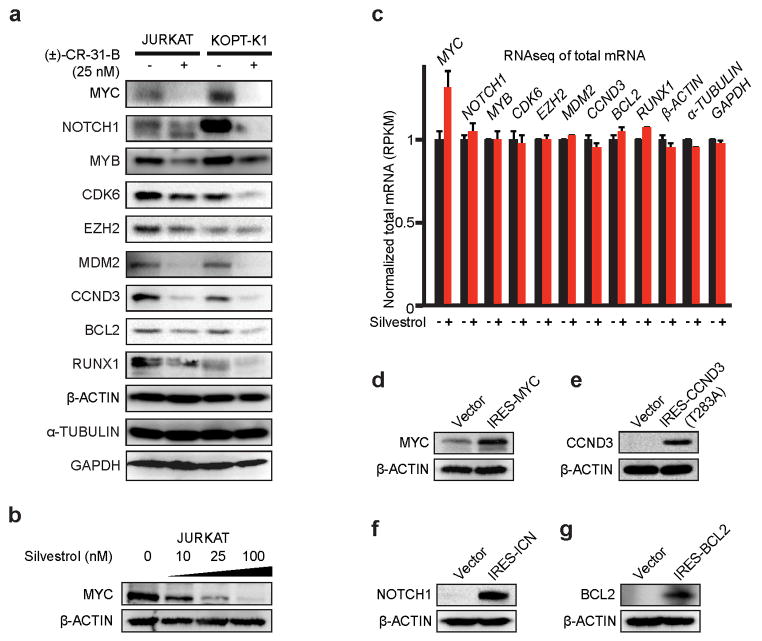
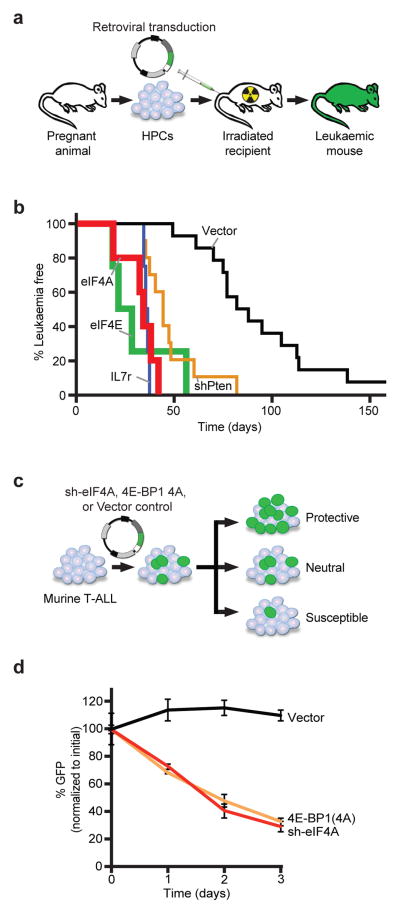
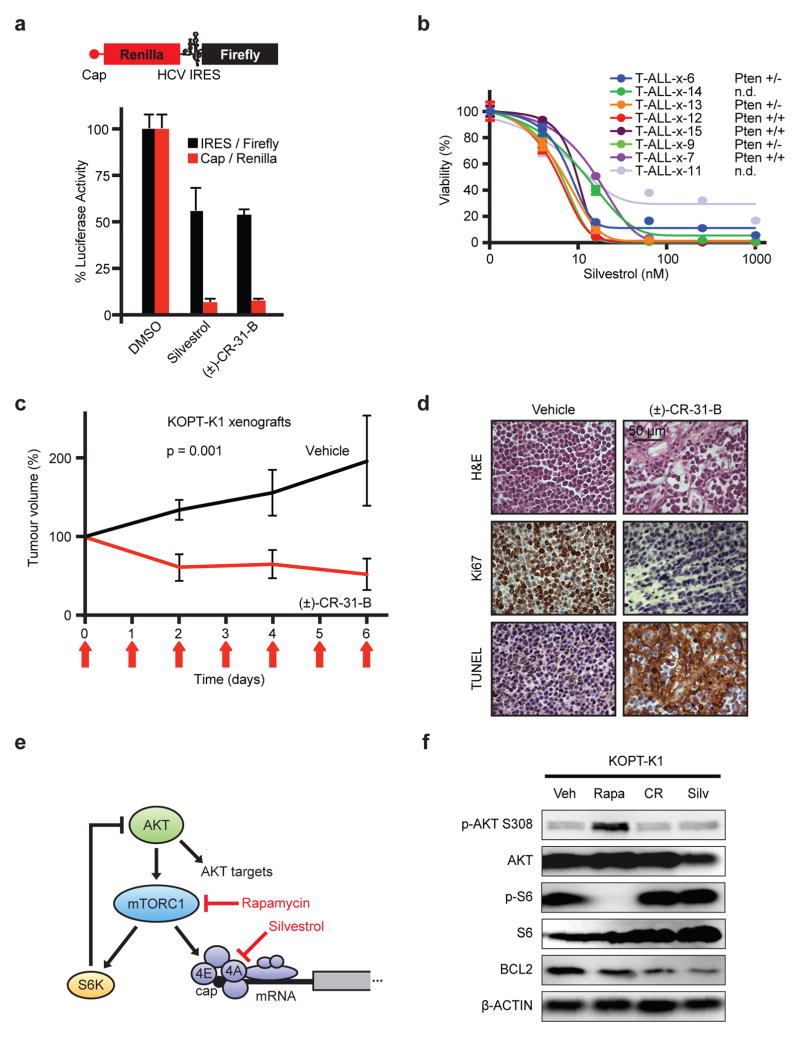
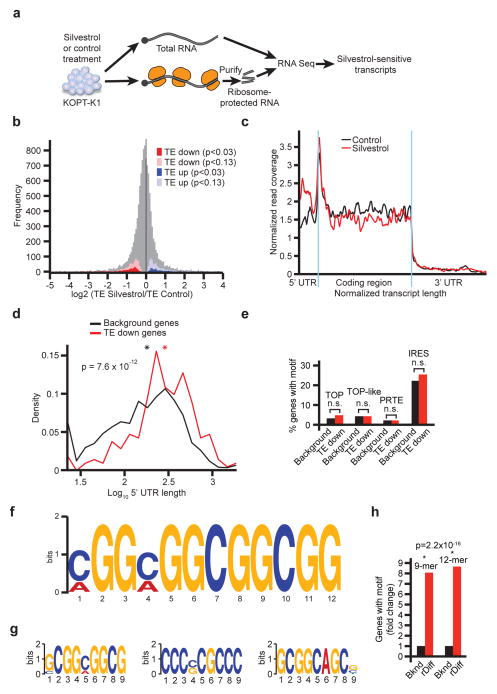
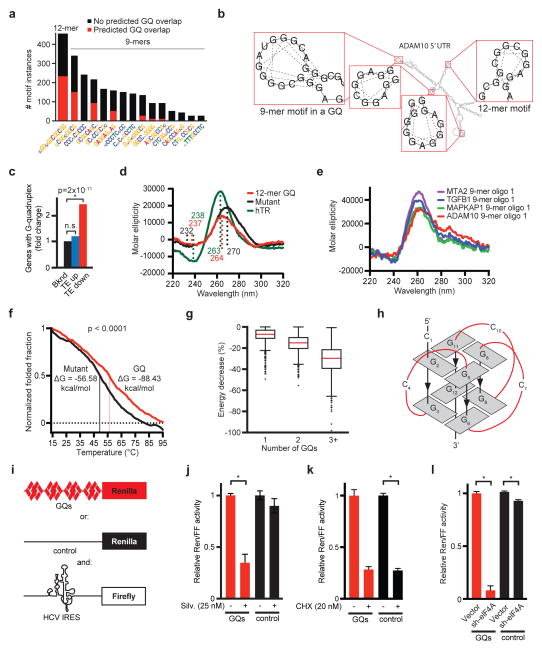
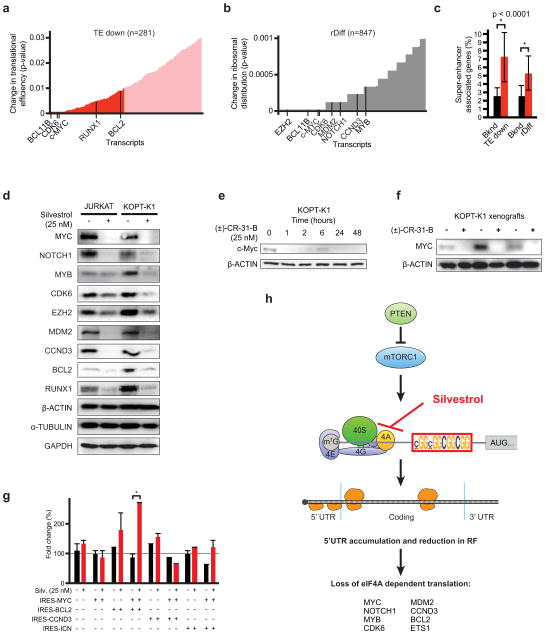
The translational control of oncoprotein expression is implicated in many cancers. Here we report an eIF4A RNA helicase-dependent mechanism of translational control that contributes to oncogenesis and underlies the anticancer effects of silvestrol and related compounds. For example, eIF4A promotes T-cell acute lymphoblastic leukaemia development in vivo and is required for leukaemia maintenance. Accordingly, inhibition of eIF4A with silvestrol has powerful therapeutic effects against murine and human leukaemic cells in vitro and in vivo. We use transcriptome-scale ribosome footprinting to identify the hallmarks of eIF4A-dependent transcripts. These include 5' untranslated region (UTR) sequences such as the 12-nucleotide guanine quartet (CGG)4 motif that can form RNA G-quadruplex structures. Notably, among the most eIF4A-dependent and silvestrol-sensitive transcripts are a number of oncogenes, superenhancer-associated transcription factors, and epigenetic regulators. Hence, the 5' UTRs of select cancer genes harbour a targetable requirement for the eIF4A RNA helicase.


Conflict of interest statement

The authors declare no competing financial interests.

Figures

Extended Data Figure 1
Extended Data Figure 1. Translational activation in T-ALL
a–c) Diagram of mutations in human T-ALL affecting PTEN (a), IL7R (b), and NOTCH1 (c); d) Immunoblots of lysates from ICN-driven murine leukaemia with the additional indicated construct, probed as indicated; e) Immunoblots of lysates from 3T3 cells with empty vector or sh-eIF4A and probed as indicated; f) Representative FACS profiles measuring levels of the indicated markers in murine leukaemia; g) Surface marker expression on murine leukemic cells of indicated genotype (+ and − indicate < or ≥ 50% positive cells); h) Lysates of murine leukaemia expressing ICN and either empty vector or eIF4A1 and probed as indicated; i) Representative histology detailing the pathological appearance of murine T-ALLs harbouring the indicated genes and stained as indicated.
Extended Data Figure 2
Extended Data Figure 2. Silvestrol and the synthetic analogue (±)-CR-31-B are effective against T-ALL
a) Dual luciferase reporter assay, shown are relative levels of each firefly (cap-dependent) and renilla (IRES-dependent) luciferase upon treatment with Silvestrol or (±)-CR-31-B. Mean and standard deviation are shown, n = 3 biological replicates; b) IC50 values for Silvestrol and CR in a panel of human T-ALL primary patient samples and cell lines. Mean and standard deviation are shown, n = 4 biological replicates; c) Silvestrol’s effect on murine T-ALLs with the indicated genetic lesions; curves are mean of triplicates and differences between the genotypes did not reach significance; d) Kaplan-Meier analysis showing time to leukaemia development after systemic transplantation of MOHITO cells in Balb/c mice followed by treatment on 7 consecutive days (treatments are indicated by red arrows) with either Silvestrol (0.5 mg/kg, red line, n = 5) or vehicle (black line, n = 5); e) KOPT-K1 xenograft studies. Shown is the tumour volume during and after systemic treatment with CR or vehicle (intraperitoneal injection, 0.2 mg/kg on days indicated by red arrows). Mean and standard deviation are shown, n = 6 biological replicates; f) Tumour volume upon intraperitoneal treatment with vehicle or Silvestrol (0.5 mg/kg on days indicated by red arrows). Mean and standard deviation are shown, n = 3 biological replicates.
Extended Data Figure 3
Extended Data Figure 3. a–j) Toxicity studies with (±)-CR-31-B
Mean and standard deviation are shown, n = 2 biological replicates. a) Animal weights during and after CR treatment (intraperitoneal injection, 0.2 mg/kg on days indicated by red arrows), red = CR, black = vehicle; b–d) Counts of white blood cells (b), red cells (c), and platelets (d) 14 days after cessation of CR treatment, blue lines indicate the species and strain specific reference range, n.s. indicates not significant, n = 2 biological replicates; e) Representative histology of gastrointestinal tract (small intestine) on the indicated days during (n = 4) and after (n = 2) (±)-CR-31-B treatment; f–j) Serum levels of alanine aminotransferase (ALT) (f), aspartate transaminase (AST) (g), albumin (h), total bilirubin (i), and creatinine (j) two weeks after cessation of treatment with CR or vehicle, blue lines indicate the species and strain specific reference range, n.s. indicates not significant.
Extended Data Figure 4
Extended Data Figure 4. Ribosome profiling quality control data and effects on translation
a and b) Read counts by length of mapped sequence before and after filtering rRNA, linker reads, non-coding RNAs, short mapped sequences (“noisy” reads; see text and method for details), n = 2 biological replicates; c and d) Read length frequency histograms and mapping analysis of ribosome footprint data after quality control filtering for vehicle treated cells (c) or Silvestrol treated cells (d), n = 2 biological replicates; e) Silvestrol induced changes in total RNA (log2 Fold change RPKM) and ribosome protected RNA (RF), n = 2 biological replicates; f) Histogram of all genes’ ribosome footprint intensity (measured as unique read number per million per gene, RPM) for Silvestrol and vehicle treated cells indicating Silvestrol affected mRNAs were broadly distributed (see text for details), n = 2 biological replicates; g) Mean fluorescence intensity of incorporated L-azidohomoalanine (AHA) in newly synthesized proteins in KOPT-K1 cells treated with vehicle (DMSO), Silvestrol (Silv. 25 nM), or Cycloheximide (CHX 100 nM) for the indicated time period, n = 3 biological replicates; h) Polyribosome profiles of Silvestrol (25 nM) or vehicle (DMSO) treated KOPT-K1 cells showing OD254 absorption across the ribosome containing fractions, n = 3 biological replicates; i) Ribosome density for transcripts across control and Silvestrol samples (ribosomal footprint (RF) reads per kilobases per million reads (RPKM)), n = 2 biological replicates. The correlation (R2 = 0.94) indicates a broad effect on translation and transcripts with significantly differential changes in ribosome density are indicated as red and blue dots; j) Length comparison of 5′UTRs of TE up genes and a background gene set; *: mean, n = 2 biological replicates; k) Percentage of TE up genes and background genes containing the indicated sequence motifs; *: p < 0.001, n = 2 biological replicates.
Extended Data Figure 5
Extended Data Figure 5. Analysis of genes with differential ribosomal distribution (rDiff positive set)
a) Representation of ribosome coverage for 826 transcripts with significant changes in distribution between Silvestrol (red) and vehicle (black); corresponding to the rDiff positive gene list after filtering out genes with 5′ UTR length < 20nt. Both RF coverage and transcript length are normalized for comparison; translation start and stop sites are indicated by blue lines, n = 826; b–c) Ribosomal distribution plots, as in a, showing how Silvestrol affects ribosome distribution in all TE up genes (b), n = 182 after filtering out genes with 5′ UTR length < 20nt and all TE down genes (c), n = 276 after filtering out genes with 5′ UTR length < 20nt; d) Length comparison of 5′UTRs of genes with significantly altered ribosomal distribution (rDiff positive: red) and background genes (black); *: mean value, n = 826; e) Percentage of rDiff positive genes and background genes containing the indicated sequence motifs, * indicates p < 0.05, n = 2 biological replicates; f–g) The rDiff positive genes are enriched for the indicated 12-mer (f) and 9-mer (g) consensus motifs.
Extended Data Figure 6
Extended Data Figure 6. Circular dichroism (CD) and characterization of eIF4A
a) Bar graph indicating the prevalence of each sequence motif from the rDiff data set and its predicted likelihood to form GQ structures (red); b) CD spectra scan of 9-mer motif with a 5 nt flank taken from the actual 5′UTR of the indicated genes folded with KCl; c) CD spectra scan of 12-mer motif and mutant folded in sodium phosphate buffer without KCl, note the y-axis scale; d) Relative amounts of Renilla luciferase (normalized to Firefly) expressed from the GQs (red bars) or control construct (black bars), treated with 8 nM Pateamine A (Pat. A) or 50 nM Hippuristanol (Hipp.) for 24 hours (* indicates p < 0.05, n = 3 biological replicates and n = 2 technical replicates); e) Analysis of mRNA expression of the indicated RNA helicases in normal T-cells and T-ALL cells (* indicates p < 0.05, n = 57 biological replicates); f) Relative amounts of Renilla luciferase expressed from the GQ construct in 3T3 cells and normalized to IRES/Firefly with either empty vector or the indicated genes, treated with Silvestrol (25 nM) for 24 hours, mean and standard deviation are shown, n = 3 biological replicates, n = 2 technical replicates.
Extended Data Figure 7
Extended Data Figure 7. Silvestrol-sensitive transcripts
a) Distribution of ribosomal footprints for the indicated genes, n = 2 biological replicates. Silvestrol: Red; Vehicle: black; purple dots: 9-mer motifs; blue dots 12-mer motif; b) Gene ontology classification for genes in TE down group with G-quadruplex, 12-mer and 9-mer motif; c) Venn diagram illustrating the overlap between TE and/or rDiff genes and reported super-enhancers in T-ALL cell lines.
Extended Data Figure 8
Extended Data Figure 8. Immunoblots and mRNA expression
a) Lysates from human T-ALL lines treated with CR (25 nM, 24H) and probed as indicated; b) Lysates from JURKAT cells treated with escalating doses of Silvestrol and probed as indicated; c) mRNA levels for the indicated genes treated with vehicle (DMSO, black) or Silvestrol (red, 25 nM) for 45 minutes. Mean and standard deviation are shown, n = 2 biological replicates; d–g) Immunoblots of lysates from murine T-ALL cells expressing either vector control or IRES-MYC (d), IRES-CCND3 T283A (e), IRES-ICN (f), or IRES-BCL2 (g) and probed as indicated.
Figure 1
Figure 1. eIF4A promotes T-ALL development in vivo
a) Diagram of the NOTCH-ICN-driven murine T-ALL model; b) Kaplan-Meier analysis showing time to leukaemia development after transplantation of HPC transduced with NOTCH1-ICN and empty vector (black, n = 14), eIF4E (green, n = 4), eIF4A1 (red, n = 5), IL7r p.L242-L243insNPC (P1) (blue, n = 4), shPten (orange, n = 10); c) Experimental design of competition experiments; d) Results as percentage of each starting GFP positive population of murine T-ALL cells partially transduced with vector/GFP, sh-eIF4A, or the constitutive inhibitory 4E-binding protein (4E-BP1 (4A)), mean and standard deviations are shown, n = 3 biological replicates.
Figure 2
Figure 2. Silvestrol has single-agent activity against T-ALL
a) Reporter system with capped renilla luciferase (red) and firefly luciferase under the HCV IRES (black); (below) Relative levels of renilla luciferase (red) and firefly (black) luciferase upon vehicle (DMSO), Silvestrol, or (±)-CR-31-B. Mean/SD, n = 3 biological replicates; b) Viability of primary patient T-ALL samples treated with Silvestrol (48 h; mean/SD of 4 replicates; c) Tumour size of KOPT-K1 xenografts treated with (±)-CR-31-B (0.2 mg/kg) or vehicle, mean/SD of 5 tumors; d) Immunohistochemical analysis of (±)-CR-31-B treated KOPT-K1 tumours; e) Diagram of drug targets; f) Lysates of KOPT-K1 cells treated with vehicle (Veh), Rapamycin (Rapa: 25 nM), (±)-CR-31-B (CR: 25 nM), or Silvestrol (Silv: 25 nM) for 48 hours and probed as indicated.
Figure 3
Figure 3. Ribosome footprinting defines Silvestrol’s effects on translation
a) Schematic of the ribosome footprinting study; b) Frequency distribution of the ratio of translational efficiency (TE) in control and Silvestrol treated samples (TESilvestrol/TEcontrol). More or less affected mRNAs identified as TE down (red) and TE up (blue); n = 2 replicates; c) Ribosome distribution for 62 TE down and rDiff positive transcripts upon Silvestrol (red) or vehicle (black). RF coverage and transcript length are normalized, blue indicates translation start and stop sites; d) Comparison of 5′UTR lengths for TE down versus background genes. Mathematical density is scaled such that all values on the x-axis sum to 1; red: TE down, black: background genes, *: mean value, n = 2 replicates; e) Prevalence of the indicated 5′UTR motifs among the TE down and background genes (n.s.: not significant p > 0.05); f) 12-mer motif enriched in TE down genes (p = 2 × 10⁻¹⁶); g) Three most common 9-mer motifs in TE down genes; h) Enrichment of 12-mer and 9-mer motifs in the rDiff gene set.
Figure 4
Figure 4. GQ structures confer eIF4A-dependent translation
a) Bar graph indicating the motif prevalence and likelihood to form GQs (red); b) The ADAM10 5′UTR illustrates 12-mer and 9-mer motifs and GQs; c) Enrichment of predicted 5′UTR GQ structures in the TE down gene set; d) CD spectra scan of 12-mer motif (CGG)4, mutant oligomer (equal length and GC content), and human telomeric RNA (hTR) with known GQ structure folded in KCl, n = 5 replicates; e) CD spectra scan of 9-mer motifs with 2nt flank from the 5′UTR of indicated genes folded with KCl, n = 5 replicates; f) Melting curve for CD spectra scan at λ264nm for the 12-mer (CGG)4 and mutant oligomer, Tm = melting temperature, ΔG = free energy of unfolding; g) Calculated decrease in free energy for cellular UTRs with 1, 2, or 3+ motifs when allowed to fold into GQ structures; h) Diagram of parallel GQ conformation; i) Schematic of reporter constructs with four 12-mer motifs (GQs, red), random sequence matched for length and GC content (control, black), HCV IRES (white); j–k) Relative Renilla luciferase (normalized to IRES-Firefly) expressed from the GQ (red) or control construct (black), treated with Silvestrol (j) or Cycloheximide (k) for 24 hours (* indicates p < 0.05, n = 3 biological replicates and n = 2 technical replicates); l) Assay as above comparing empty vector and sh-eIF4A (* indicates p < 0.05, n = 3 biological replicates and n = 2 technical replicates).
Figure 5
Figure 5. Many oncogenes and transcription factors require eIF4A for translation
a) TE down genes ranked by translational efficiency (red, up to p = 0.01, see Fig. 3b); b) rDiff genes ranked by significance (up to p = 0.001, see Fig. 3c); c) Genes associated with “super-enhancers” in T-ALL cells are enriched among TE down and rDiff gene sets; d) Immunoblots of lysates from human T-ALL lines treated with Silvestrol (25 nM, 24h) and probed as indicated; e) Time course analysis of protein expression in KOPT-K1 cells treated with CR (25 nM) for the indicated number of hours; f) Immunoblot on CR or vehicle treated KOPT-K1 xenografts, probed as indicated; g) Competition experiment (as in Figure 1c/d) showing the percentage of each starting GFP positive population of murine T-ALL cells partially transduced with the indicated constructs and treated with Silvestrol (*indicates p <0.05); h) Diagram: An eIF4A-dependent mechanism of translational control.

Similar articles

Cited by

References

    1. Wendel HG, et al. Survival signalling by Akt and eIF4E in oncogenesis and cancer therapy. Nature. 2004;428:332–337. - PubMed
    1. Mamane Y, Petroulakis E, LeBacquer O, Sonenberg N. mTOR, translation initiation and cancer. Oncogene. 2006;25:6416–6422. - PubMed
    1. Rajasekhar VK, et al. Oncogenic Ras and Akt signaling contribute to glioblastoma formation by differential recruitment of existing mRNAs to polysomes. Molecular cell. 2003;12:889–901. - PubMed
    1. Jackson RJ, Hellen CU, Pestova TV. The mechanism of eukaryotic translation initiation and principles of its regulation. Nature Rev Mol Cell Biol. 2010;11:113–127. - PMC - PubMed
    1. Lazaris-Karatzas A, Montine KS, Sonenberg N. Malignant transformation by a eukaryotic initiation factor subunit that binds to mRNA 5′ cap. Nature. 1990;345:544–547. - PubMed

Publication types

MeSH terms

Associated data