. 2014 Aug 15;5(15):5893-907.
doi: 10.18632/oncotarget.1839.

Eradication of metastatic melanoma through cooperative expression of RNA-based HDAC1 inhibitor and p73 by oncolytic adenovirus

Affiliations

Eradication of metastatic melanoma through cooperative expression of RNA-based HDAC1 inhibitor and p73 by oncolytic adenovirus

Holger Schipper et al. Oncotarget. .

Abstract

Malignant melanoma is a highly aggressive cancer that retains functional p53 and p73, and drug unresponsiveness largely depends on defects in death pathways after epigenetic gene silencing in conjunction with an imbalanced p73/DNp73 ratio. We constructed oncolytic viruses armed with an inhibitor of deacetylation and/or p73 to specifically target metastatic cancer. Arming of the viruses is aimed at lifting epigenetic blockage and re-opening apoptotic programs in a staggered manner enabling both, efficient virus replication and balanced destruction of target cells through apoptosis. Our results showed that cooperative expression of shHDAC1 and p73 efficiently enhances apoptosis induction and autophagy of infected cells which reinforces progeny production. In vitro analyses revealed 100% cytotoxicity after infecting cells with OV.shHDAC1.p73 at a lower virus dose compared to control viruses. Intriguingly, OV.shHDAC1.p73 acts as a potent inhibitor of highly metastatic xenograft tumors in vivo. Tumor expansion was significantly reduced after intratumoral injection of 3 x 10⁸ PFU of either OV.shHDAC1 or OV.p73 and, most important, complete regression could be achieved in 100 % of tumors treated with OV.shHDAC1.p73. Our results point out that the combination of high replication capacity and simultaneous restoration of cell death routes significantly enhance antitumor activity.


Figures

Figure 1
Figure 1. In vitro expression characteristics and replication efficiencies of OVs
(A) Schematic representation of the OVs compared to wild-type adenovirus. A 24 bp deletion in the E1A gene (E1Adelta24) restricts OV replication to cells with inactive pRb. Furthermore, OVs harbor a deletion in the E3-region known from AdEasyI to enable efficient virus packaging after recombining the viral genomes. In OV.Luc, the luciferase gene is expressed bicistronically together with the fiber gene. OV.shHDAC1.Luc in addition, contains the gene for an shRNA directed against HDAC1 under control of the H1-promoter. In OV.p73 the luciferase gene is replaced by the p73 gene and OV.shHDAC1.p73 combines the expression of both, the p73 and the shRNA gene directed against HDAC1. (B) p73 and HDAC1 levels after infection of SK-Mel-147 cells with OVs, or replication-deficient Ad control viruses. Cells were treated with MOIs of 10. After 72 hours, protein expression was determined by Western blot. Mock: untreated cells. Actin served as loading control. (C) Burst assays were performed to measure the titers of the progeny virus at 24, 36, and 48 hours after infection of SK-Mel-147 cells with MOIs of 1. Ad.p73 served as control. (D) To compare the virus DNA content in cells after infection with OV.Luc or OV.shHDAC1.p73, SK-Mel-147 cells were infected and whole DNA was extracted 0, 24, and 48 hours post-infection. 50 ng DNA served as template for quantitative real-time PCR of the viral E2B gene. Cellular GAPDH was used for normalization. Shown are the expressional differences relative to OV.Luc 48 hours post-infection. (E) Burst assays of OV.Luc or OV.shHDAC1.p73 infected SK-Mel-147, H1299, and A549 cells 72 hours after infection at MOI 1. Ad.Empty served as control (data not shown). Data are shown as the mean ± SD of three independent experiments. P values of < 0.01 (C and E) and < 0.05 (D) were deemed statistically significant
Figure 2
Figure 2. Cytotoxicity of OVs
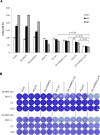
(A) Determination of living cells in percent by trypan blue exclusion at 24, 36, and 48 hours in cultures of SK-Mel-147 cells after infection with OVs at MOI 10. Cells transduced with Ad-derived vectors served as controls. The number of living cells in mock-treated cultures 24 hours after treatment was set as 100 percent. Data represent the mean ± S.D. of three independent experiments. (B) Crystal violet staining of formaldehyde-fixed SK-Mel-147 and SK-Mel-103 cells after infection of 1 × 10⁴ at MOIs of 1, 0.1, and 0.01 to demonstrate dose-dependent cytotoxicity. P < 0.01 is statistically significant.
Figure 3
Figure 3. Apoptosis induction in OV-infected SK-Mel-147 cells
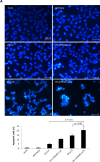
(A) Representative photomicrographs of Hoechst 33342 stained cells exhibiting characteristic chromatin condensation after infection with OVs at MOIs of 2, 24 hours (upper panel). Size bar = 100 μm. The bar graph represents the percentages of apoptotic cells counted from each group. Data are presented as the mean of 5 different fields (lower panel). P values of less than 0.01 were deemed statistically significant. (B) qRT-PCR data show the expression levels of Apaf-1, Bax, Bim, and PUMA at 48 hours after infection. Data are the mean ± SD of three independent experiments. Student's t-test indicates statistically significant differences in the expression of all four genes between OV.shHDAC1.p73 and OV.Luc; of Apaf-1, Bim, and PUMA for OV.shHDAC1.p73 vs. OV.shHDAC1.Luc; and Apaf-1 plus Bim for OV.shHDAC1.p73 vs. OV.p73 (p < 0.05). (C) Western blot shows the increase in protein levels of active cleaved caspase 3 (Act.) 72 hours after infection of cells with OVs at MOI 10. Non-replication Ad viruses were used as controls and actin served as loading control. Based on densitometric analysis of Western blot, the bar graph shows the relative expression of activated caspase 3. (D) Increase in protein levels of active cleaved forms of PARP (Cl.) in cells infected and quantitated as in C. Bar graphs indicate the ratios of cleaved to uncleaved PARP. The experiment shown in C and D was repeated three times.
Figure 4
Figure 4. Induction of authophagy after infection with OVs
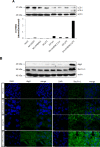
(A) Western blot of LC3 as a marker of autophagy shows enhanced conversion of its LC3-I form into LC3-II (lower band) after infection with OVs. Actin was used for equal loading. Based on densitometric analysis of immunoblots the lower panel shows the ratio of LC3-II to LC3-I. This experiment was repeated three times. (B) Representative immunoblot (top) and immunofluorescence staining (bottom) of endogenous Beclin-1 and Atg3 protein expression in SK-Mel-147 cells at 48 h after infection with OVs. Beclin-1 and Atg3, green. The nuclei are evidenced by DAPI staining (blue). Size bar = 10 μm.
Figure 5
Figure 5. OV.shHDAC1.p73 shows improved anti-tumoral activity compared to control virus
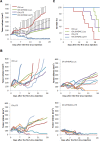
Tumors were established in NMRI nude mice by subcutaneous injection of 5 × 10⁶ SK-Mel-147 cells in the rear flanks. After reaching a volume of 100 mm3, tumors were treated three times (days 0, 2, and 4) with 1 × 10⁸ PFU of oncolytic virus and monitored for tumor growth. (A) Average tumor volumes in groups of mice (n=8) treated with indicated OVs. Data are mean ± SD. (B) Plots showing the changes in tumor volumes in individual mice within the groups treated with OVs as indicated. (C) Survival curves of groups of mice treated with OVs.

Similar articles

Cited by

References

    1. Garbe C, Peris K, Hauschild A, Saiag P, Middleton M, Spatz A, Grob JJ, Malvehy J, Newton-Bishop J, Stratigos A, Pehamberger H, Eggermont AM. Diagnosis and treatment of melanoma. European consensus-based interdisciplinary guideline – Update 2012. Eur J Cancer. 2012;48:2375–90. - PubMed
    1. Pützer BM, Steder M, Alla V. Predicting and preventing melanoma invasiveness: advances in clarifying E2F1 function. Expert Rev Anticancer Ther. 2010;10:1707–20. - PubMed
    1. Dahl C, Guldberg P. The genome and epigenome of malignant melanoma. APMIS. 2007;115:1161–76. - PubMed
    1. Vazquez A, Bond EE, Levine AJ, Bond GL. The genetics of the p53 pathway, apoptosis and cancer therapy. Nat Rev Drug Discov. 2008;7:979–87. - PubMed
    1. Terzian T, Torchia EC, Dai D, Robinson SE, Murao K, Stiegmann RA, Gonzalez V, Boyle GM, Powell MB, Pollock PM, Lozano G, Robinson WA, Roop DR, et al. p53 prevents progression of nevi to melanoma predominantly through cell cycle regulation. Pigment Cell Melanoma Res. 2010;23:781–94. - PMC - PubMed

Publication types

MeSH terms