Selective clearance of aberrant tau proteins and rescue of neurotoxicity by transcription factor EB
- PMID: 25069841
- PMCID: PMC4197862
- DOI: 10.15252/emmm.201303671
Selective clearance of aberrant tau proteins and rescue of neurotoxicity by transcription factor EB
Abstract
Accumulating evidence implicates impairment of the autophagy-lysosome pathway in Alzheimer's disease (AD). Recently discovered, transcription factor EB (TFEB) is a molecule shown to play central roles in cellular degradative processes. Here we investigate the role of TFEB in AD mouse models. In this study, we demonstrate that TFEB effectively reduces neurofibrillary tangle pathology and rescues behavioral and synaptic deficits and neurodegeneration in the rTg4510 mouse model of tauopathy with no detectable adverse effects when expressed in wild-type mice. TFEB specifically targets hyperphosphorylated and misfolded Tau species present in both soluble and aggregated fractions while leaving normal Tau intact. We provide in vitro evidence that this effect requires lysosomal activity and we identify phosphatase and tensin homolog (PTEN) as a direct target of TFEB that is required for TFEB-dependent aberrant Tau clearance. The specificity and efficacy of TFEB in mediating the clearance of toxic Tau species makes it an attractive therapeutic target for treating diseases of tauopathy including AD.
Keywords: Alzheimer's disease; PTEN; TFEB; autophagy‐lysosomal pathway; tauopathy.
© 2014 The Authors. Published under the terms of the CC BY 4.0 license.
Figures

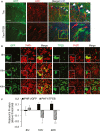
A Immunofluorescence staining of cortex of 4-month-old rTg4510 mice either untreated (Tau) or injected with TFEB (Tau + TFEB) at P0 using phospho-Tau antibodies AT8 (S202/T205) and PHF1 (S396/S404) or conformation-specific antibody MC1 and counter-stained with DAPI. AAV-TFEB was injected at P0 and mice were analyzed at 4 months. Scale bar: 200 μm.
B Quantification of staining intensities. Student's t-test was performed to analyze the significance. n = 5 mice/genotype/treatment group. **P = 0.0011, ***P = 6.85 × 10⁻⁵, and ***P = 9.33 × 10⁻⁵ for AT8, PHF1 and MC1, respectively. Each bar represents average ± s.e.m.
C Western blot analysis of detergent-extracted brain lysates using anti-total Tau, Tau1, AT8 or MC1 antibodies. WT: wild-type; WT + TFEB: wide-type mice injected with TFEB; Tau: rTg4510 transgenic mice; Tau + TFEB: rTg4510 transgenic mice injected with TFEB. Two exposures were displayed for total Tau: the short exposure was used for quantification of Tau transgenic samples; the long exposure was used for side-by-side comparisons of the total Tau levels in WT and Tau mice and for quantification of WT total Tau. γ-tubulin was used as a loading control.
D Western blot analysis of TFEB expression in 4-month-old WT or Tau mice with (+TFEB) or without AAV-TFEB P0 injection (the same as in A and C but from another independent batch of experiments). PHF1 and total Tau antibodies were used to blot the Tau transgenic lysates for correlation with TFEB levels.
E, F Quantification of relative band intensities in WT (E) or Tau (F) mice. Student's t-test shows that TFEB protein levels are significantly increased in WT + TFEB vs WT (**P = 0.0026) and in Tau + TFEB vs Tau (*P = 0.047). AT8, PHF1 and MC1 levels are significantly reduced in Tau + TFEB vs Tau (*P = 0.032, 0.041, 0.040, respectively). &, significant correlation between TFEB protein levels and PHF-1 was determined using Pearson Product Moment Correlation test (P = 0.0044). n = 3/group/experiment. Each bar represents average ± s.e.m.

A Western blot analysis of detergent-free (Soluble) and sarkosyl-insoluble (Insoluble) preparations of total (total Tau), unphosphorylated (Tau1) or CP13- (S202/T205) and PHF1-positive pTau species in 4-month-old Tau or Tau + TFEB mice with P0 injection. γ-tubulin was used as a loading control.
B, C Quantification of relative band intensities in soluble (B) and insoluble (C) fractions. n = 3 mice/genotype/treatment group. CP13 and PHF1 are significantly reduced in both soluble and insoluble fractions (Student's t-test, ***P = 0.00072 and **P = 0.004, for B; and **P = 0.007 and **P = 0.009 for C).
D Western blot analysis of total Tau, unphosphorylated Tau (Tau1) and CP13- or PHF1-positive pTau levels in response to doxycycline induction (Tau) and/or TFEB-FLAG transfection (TFEB) in T40PL cell line. Ctrl: untreated; Tau: 0.5 μg/ml doxycycline treated for 48 h; TFEB: TFEB transfected for 48 h; Tau + TFEB: combined TFEB transfection and DOX treatment. FLAG: anti-FLAG antibody blotting for TFEB expression. γ-tubulin was used as a loading control.
E Quantification of relative band intensities. CP13, PHF1 and total Tau are significantly reduced by TFEB transfection (Student's t-test, n = 3, **P = 0.0012, 0.0040, and 0.0019, respectively). Each bar represents average ± s.e.m.

Immunohistochemical staining of hippocampus of rTg4510 (Tau) mice injected with AAV-GFP (Tau) or AAV-TFEB/AAV-GFP (Tau + TFEB) at P0 and analyzed at 4 months. Images are displayed as GFP only (GFP), AT8 only (AT8) or overlay of GFP/AT8/DAPI (Merge/DAPI). Right panels are enlarged images of the bracketed areas. Arrowheads indicate GFP/AT8-double-positive cells only in GFP-injected mice. Scale bar: 50 μm. n = 2 for AAV-GFP and n = 5 for AAV-TFEB/AAV-GFP; 4–5 sections/mouse were examined.
Fluorescence images of GFP and immunofluorescence images of anti-FLAG compared with immunofluorescence images of anti-PHF1 in GFP or TFEB transfected and doxycycline induced T40PL cell line at 8, 16 or 40 h post-transfection. Merge: Overlay of GFP or TFEB-FLAG with PHF1. Insets are higher resolution images documenting that whereas overlapping GFP and PHF1 immunoreactivity can be observed at all the time points, TFEB- and PHF1-double-positive cells can only be detected at 8 h but not later times. Scale bar: 200 μm; in inset: 50 μM.
Pearson correlation coefficients (Pearson R-values) showing no correlation between GFP and PHF1 (PHF1/GFP) at any time points, but negative correlation between TFEB and PHF1 (PHF1/TFEB) starting at 16 h and persisting to 40 h (Student's t-test, n = 4, *P = 0.026 and **P = 0.008 for 16 and 40 h, respectively, comparing R-values for GFP/PHF1 with TFEB/PHF1). The whole view field of eight confocal projection slices per view field, four view fields per time point per transfection was used for analysis. Bar graph represents average ± s.e.m.

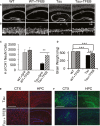
A Immunofluorescence staining of untreated or TFEB-treated (+TFEB) hippocampus of wild-type (WT) and rTg4510 (Tau) mice using the anti-NeuN antibody. Scale bar: 1000 μm.
B Enlarged view of the bracketed areas in A. Scale bar: 50 μm.
C Unbiased stereological quantification of NeuN-positive neurons in area CA1 of wild-type (WT) or Tau transgenic mice injected with GFP or TFEB. n = 4 sections/mice, 5 mice/group. Student's t-test, **P = 0.0063.
D Wet brain weight measurement of WT or Tau mice with (+TFEB) or without TFEB injection. n = 14 mice/group. ***P < 0.001 (2 way ANOVA with Bonferroni post hoc). Each bar represents average ± s.e.m.
E, F Representative immunofluorescence images of cortex (CTX) or hippocampus (HPC) of untreated or TFEB-treated (+TFEB) rTg4510 (Tau) mice stained with anti-Iba1 (E) or anti-GFAP (F) antibodies antibody. Scale bar in E: 200 μm; in F. 400 μm.

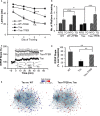
Morris water maze test of groups of 4-month-old WT or Tau mice without or with TFEB (+TFEB) treatment, showing longer latency (time to find hidden platform) in Tau mice compared to WT controls at any given day of training. TFEB has no effect on WT mice, but significantly reduced the latency in Tau mice. n = 14/group. ***P < 0.001 (2 way ANOVA).
Number of platform crossings in non-target quadrants (NTQ) vs. the target quadrant (TQ). Values of the three NTQs were combined and averaged. n.s.: non-significant. *P = 0.047 and ***P = 0.0005 for TQ of WT vs Tau and Tau vs Tau + TFEB, respectively (Student's t-test). Each bar represents average ± s.e.m.
Slope of field excitatory postsynaptic potential (fEPSP) in response to theta-burst stimulation delivered to the Schaffer collateral pathway from WT mice (n = 10 recordings from 6 mice), Tau mice (n = 19 recordings from 6 mice) or Tau mice with TFEB injection (Tau + TFEB; n = 8 recordings from 6 mice). Insets: example fEPSP traces taken before (upper) or after (lower) stimulation from WT, Tau or Tau + TFEB mice. Calibration: 1 mV, 5 msec.
Quantification of average fEPSP slope in the last 10 minutes demonstrating severely impaired LTP in Tau mice (WT vs. Tau) and significant improvement by TFEB treatment (Tau vs. Tau + TFEB). Each bar represents average ± s.e.m. **P < 0.01 (2 way ANOVA with Bonferroni post hoc).
Cytoscape-generated networks representing genes involved in synaptic function. A majority of downregulated genes (blue dots) are found in the synaptic network when comparing transcription profiles of Tau mice with wild-type controls (Tau vs. WT), while a majority of upregulated genes (red dots) are found when comparing TFEB-injected with uninjected Tau mice (Tau + TFEB vs. Tau). n = 4 mice/genotype/treatment group.

Gene set enrichment analysis (GSEA) of transcriptome changes in TFEB-injected vs. uninjected wild-type (WT + TFEB vs. WT) mice. GSEA of genes annotated as participating in the lysosomal function are reported. The upper panel shows the enrichment generated by GSEA of ranked gene expression data (left in upper panel and red in middle panel: upregulated; right in upper panel and blue in middle panel: downregulated). Peak value corresponds to the point (along the ranked microarray) where the enrichment score (ES) meets its highest value, while the zero value indicates the boundary (along the ranked microarray) between positive fold change and negative fold change. In the middle panel, vertical blue bars indicate the position of lysosomal genes within the ranked list. Lower panel shows the cumulative distribution of lysosomal genes within the ranked lists. The ranking positions that include 50% of lysosomal genes are indicated. The analysis shows that lysosomal genes have a significant global shift toward upregulated genes in TFEB-injected mice compared with uninjected littermates (ES = 0.56, P = 0.0029). n = 4 mice/group.
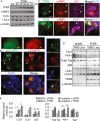
Representative image of Tau mice coinjected with TFEB-FLAG/GFP and immunostained with anti-FLAG and LAMP1 antibodies. Merge image highlights that nuclear TFEB-FLAG is correlated with higher LAMP1. Scale bar: 10 μm.
Western blot analysis of TFEB, LAMP1 and CTSD expression in Tau mice with (+TFEB) or without AAV-TFEB adult injection.
Quantification of relative band intensities of (C). n = 3 and 4 per group. TFEB protein levels are significantly increased in Tg + TFEB vs Tg (***P = 0.00013) along with LAMP1 protein levels (*P = 0.013) and CTSD protein levels (*P = 0.028), Student's t-test. Each bar represents average ± s.e.m.

Western blot analysis of Lamp1 and LC3-I and LC3-II levels in T40PL cells transfected with TFEB-FLAG and harvested at times indicated. γ-tubulin was used as a loading control. Ctrl: untransfected.
Fluorescent images of T40PL cells transfected with TFEB and RFP-GFP-LC3. Thick white arrows indicate cells with significant LC3 puncta and lower PHF1 compared with nearby cells. Images on the upper and right are higher magnification views of the bracketed area of the LC3-GFP and LC3-RFP or Merge panels, respectively. RFP-only autolysosomes are marked by red arrows; GFP/RFP double-positive puncta representing an autophagosome is shown in yellow (upper inset). Right insets highlight a cell with colocalization of GFP/RFP-positive autophagosome with PHF1. Scale bar: 10 μm; in inset: 2.5 μm.
Immunofluorescence images of T40PL cells transfected with TFEB and stained with anti-LAMP1/MC1 (top) or PHF1 (bottom). Arrow marks cells with nuclear TFEB and its correlation with higher LAMP1 and lower MC1 (top) or PHF1 (bottom) stainings. Arrowhead indicates nearby cells with cytoplasmic TFEB and opposite LAMP1 and MC1/PHF1 patterns. Scale bar: 10 μm.
Western blot analysis of T40PL cells transfected with either pCMV or TFEB, allowed to recover for 24 h, and then treated with 0.5 μg/ml doxycycline and either DMSO or 50-μM Leupeptin for 48 h prior to lysis. Black line denotes cropped lanes from a single immunoblot.
Quantization of the autophagy markers LC3-I, LC3-II (pCMV vs pCMV+Leupeptin P = 0.032, TFEB vs TFEB+Leupeptin P = 0.014), and p62 (pCMV vs pCMV+Leupeptin P = 0.019, TFEB vs TFEB+Leupeptin P = 0.024), and Tau species markers Tau1, PHF1 (pCMV vs pCMV+Leupeptin P = 0.00082, TFEB vs TFEB+Leupeptin P = 0.022), and total Tau normalized for loading to γ-tubulin from (D). P-values determined by t-test, n = 4. (*P < 0.05) Each bar represents average ± s.e.m.

qRT-PCR analysis of PTEN levels as a function of TFEB treatment in WT or Tau mice. n = 3 mice/genotype/treatment group in triplicates. *P = 0.027 and **P = 0.01 for WT vs WT + TFEB and Tau vs Tau + TFEB, respectively (Student's t-test).
Putative CLEAR sequences in the PTEN promoter and their positions. TSS: translation start site. −203 to +1, −453 to +1 and −1334 to +1: PTEN promoter fragments linked to the luciferase reporter.
ChIP analysis of TFEB binding. HPRT and APRT: negative controls; MCOLN1: positive control. Open bar: IgG control; filled bar: TFEB-FLAG IP. The experiment was done two times each in triplicates.
Normalized luciferase activity by transfecting 300 ng of each PTEN-luciferase reporter. Open bar: vector transfection control; filled bar: TFEB transfected. Student's t-test, n = 4; *P = 0.01; **P = 0.005
Dose-dependent luciferase activities in response to increasing concentrations of TFEB using the (−1344 to +1) PTEN-luciferase reporter. The experiment was done three times each in triplicates.
Western blot analysis of PTEN and LC3 expression in T40PL cells transfected with either pCMV or TFEB.
Quantization of blots in F and normalized for loading to γ-tubulin. PTEN and LC3-II are significantly increased in cells transfected with TFEB with *P = 0.032 and 0.036, respectively (Student's t-test, n = 3).
Representative immunofluorescent images of T40PL cells transfected with TFEB and triple staining for TFEB (FLAG), PTEN and PHF1. Arrow marks cell with higher TFEB and PTEN is correlated with lower PHF1. Arrowhead indicates nearby cell with opposite TFEB/PTEN/PHF1 patterns. Scale bar: 10 μm. Each bar represents average ± s.e.m.

Western blot analysis of total Tau and PHF1-positive pTau levels as a function of wild-type or the C124S or G129E mutant PTEN expression. Empty vector (Ctrl)- or TFEB-transfected cells were used as negative and positive controls, respectively. γ-tubulin was used as a loading control.
Quantization of blots in A and normalized for loading to γ-tubulin. TFEB and PTEN transfection significantly reduced pTau as probed by PHF1 (P = 0.0095 and 0.0092, respectively), as well as total Tau (P = 0.0052 and 0.034, respectively), n = 3, Student's t-test.
Representative immunofluorescence imaging showing that cells with wild-type PTEN (WT), but not the C124S or G129E mutants, were correlated with reduced PHF1-positive Tau. Scale bar: 10 μm.
Western blot analysis of total Tau, PHF1-positive pTau and LC3 levels in response to TFEB or TFEB and PTEN shRNA expression. Transfection of a scramble PTEN shRNA was used as negative controls. γ-tubulin was used as a loading control.
Quantization of blots in D and normalized for loading to γ-tubulin. Comparing with cells transfected with scramble+pEGFP, scramble+TFEB transfection reduces PHF1 and total Tau intensity (P = 0.038 and 0.035, respectively) and increases PTEN and LC3II (P = 0.04 and 0.0076, respectively) (white slashed bars). shRNA significantly reduce PTEN when transfected with either pEGFP or TFEB (P = 0.0089 and 0.043, respectively), but TFEB's effect in reducing pTau drops from 60% reduction in the presence of scramble sequence to 30% reduction when combined with shRNA of PTEN. All statistics here are Student's t-test, n = 3. Each bar represents average ± s.e.m.
Similar articles
-
Stimulation of synaptic activity promotes TFEB-mediated clearance of pathological MAPT/Tau in cellular and mouse models of tauopathies.Autophagy. 2023 Feb;19(2):660-677. doi: 10.1080/15548627.2022.2095791. Epub 2022 Jul 22. Autophagy. 2023. PMID: 35867714 Free PMC article.
-
A small molecule transcription factor EB activator ameliorates beta-amyloid precursor protein and Tau pathology in Alzheimer's disease models.Aging Cell. 2020 Feb;19(2):e13069. doi: 10.1111/acel.13069. Epub 2019 Dec 19. Aging Cell. 2020. PMID: 31858697 Free PMC article.
-
TFEB Overexpression in the P301S Model of Tauopathy Mitigates Increased PHF1 Levels and Lipofuscin Puncta and Rescues Memory Deficits.eNeuro. 2016 May 23;3(2):ENEURO.0042-16.2016. doi: 10.1523/ENEURO.0042-16.2016. eCollection 2016 Mar-Apr. eNeuro. 2016. PMID: 27257626 Free PMC article.
-
TFEB in Alzheimer's disease: From molecular mechanisms to therapeutic implications.Neurobiol Dis. 2022 Oct 15;173:105855. doi: 10.1016/j.nbd.2022.105855. Epub 2022 Aug 27. Neurobiol Dis. 2022. PMID: 36031168 Review.
-
The Autophagy-Lysosomal Pathway in Neurodegeneration: A TFEB Perspective.Trends Neurosci. 2016 Apr;39(4):221-234. doi: 10.1016/j.tins.2016.02.002. Epub 2016 Mar 9. Trends Neurosci. 2016. PMID: 26968346 Free PMC article. Review.
Cited by
-
Potentiation of rifampin activity in a mouse model of tuberculosis by activation of host transcription factor EB.PLoS Pathog. 2020 Jun 23;16(6):e1008567. doi: 10.1371/journal.ppat.1008567. eCollection 2020 Jun. PLoS Pathog. 2020. PMID: 32574211 Free PMC article.
-
Mechanisms by which autophagy regulates memory capacity in ageing.Aging Cell. 2020 Sep;19(9):e13189. doi: 10.1111/acel.13189. Epub 2020 Jul 30. Aging Cell. 2020. PMID: 32729663 Free PMC article.
-
The regulatory mechanism and therapeutic potential of transcription factor EB in neurodegenerative diseases.CNS Neurosci Ther. 2023 Jan;29(1):37-59. doi: 10.1111/cns.13985. Epub 2022 Oct 2. CNS Neurosci Ther. 2023. PMID: 36184826 Free PMC article. Review.
-
Transcription factor EB: from master coordinator of lysosomal pathways to candidate therapeutic target in degenerative storage diseases.Ann N Y Acad Sci. 2016 May;1371(1):3-14. doi: 10.1111/nyas.13131. Ann N Y Acad Sci. 2016. PMID: 27299292 Free PMC article. Review.
-
Protein kinase C controls lysosome biogenesis independently of mTORC1.Nat Cell Biol. 2016 Oct;18(10):1065-77. doi: 10.1038/ncb3407. Epub 2016 Sep 12. Nat Cell Biol. 2016. PMID: 27617930
References
Publication types
MeSH terms
Substances
Grants and funding
LinkOut - more resources
Full Text Sources
Other Literature Sources
Medical
Molecular Biology Databases
Research Materials
Miscellaneous

