. 2014 Aug 21;41(2):296-310.
doi: 10.1016/j.immuni.2014.06.014. Epub 2014 Jul 24.

Symbiotic bacterial metabolites regulate gastrointestinal barrier function via the xenobiotic sensor PXR and Toll-like receptor 4

Affiliations

Symbiotic bacterial metabolites regulate gastrointestinal barrier function via the xenobiotic sensor PXR and Toll-like receptor 4

Madhukumar Venkatesh et al. Immunity. .

Abstract

Intestinal microbial metabolites are conjectured to affect mucosal integrity through an incompletely characterized mechanism. Here we showed that microbial-specific indoles regulated intestinal barrier function through the xenobiotic sensor, pregnane X receptor (PXR). Indole 3-propionic acid (IPA), in the context of indole, is a ligand for PXR in vivo, and IPA downregulated enterocyte TNF-α while it upregulated junctional protein-coding mRNAs. PXR-deficient (Nr1i2(-/-)) mice showed a distinctly "leaky" gut physiology coupled with upregulation of the Toll-like receptor (TLR) signaling pathway. These defects in the epithelial barrier were corrected in Nr1i2(-/-)Tlr4(-/-) mice. Our results demonstrate that a direct chemical communication between the intestinal symbionts and PXR regulates mucosal integrity through a pathway that involves luminal sensing and signaling by TLR4.


Figures

Figure 1
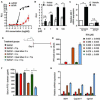
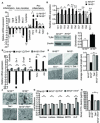
Figure 1. Commensal derived indole metabolite, IPA, regulates PXR activation
(A) Transcriptional activity of a PXR reporter gene (multi-drug resistance-associated protein 2 or MRP2 luciferase) co-transfected with mPXR (black) and hPXR (red) expression plasmids in 293T cells following treatment with IPA (n=3). RLU, relative light unit. (B) Transcriptional activity of a PXR reporter gene (MRP2 luciferase) co-transfected with hPXR expression plasmid in 293T cells following treatment with fixed concentration of indole (1 mM) and increasing concentrations of IPA (n=3). RLU, relative light unit. Data expressed as fold change in RLU compared to vehicle (DMSO) controls. (C) Real-time qPCR analysis of Mdr-1 expression in Nr1i2+/+ and Nr1i2−/− mice jejunum villi enterocytes following oral treatment with IPA (20 mg/kg/day) (n=5 per group). *P ≤ 0.0001; **P ≤ 0.001;n.s. not significant (Two-way ANOVA with Tukey’s multiple comparison test). (D) Schematic of germ free mouse treatment schedule. Six treatment groups are shown by color code: Swiss Webster Germ Free mice (SWGF) group, administered 100 μl LB and 100 μl sterilized water by oral gavage; SWGF + tryptophan (Trp) group, administered 100 μl LB + L-tryptophan; SWGF + Heat-killed C. sporogenes (C.s) group, administered C.s by oral gavage; SWGF + (C.s) group, administered C.s by oral gavage; SWGF + Heat-killed (C.s) + Trp group; and SWGF + C.s + Trp group, administered C.s and Trp by oral gavage (see Experimental Procedures). All the treatments were scheduled for six sequential days. (E) Plasma IPA peak area intensity values plotted by treatment group as illustrated in the schema (D) Color coded histograms show mean ± s.e.m. values pertaining to each treatment group. IPA concentrations in micromoles (μM) are listed by color code. (F) erum FITC-dextran recovery in treatment groups illustrated in schema (D). *P ≤ 0.0001; (Two-way ANOVA with Tukey’s multiple comparison test ); (n=6 per group). (G) Real-time qPCR analysis of Mdr1, Cyp3a11 and Ugt1a1 mRNA expression in small intestinal mucosa from schema (D). All graphs show mean values ± s.e.m. Also see Figure S1,Table S1 and supplemental movies S1 and S2.
Figure 2
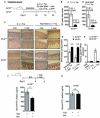
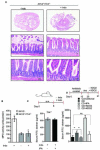
Figure 2. Commensal C. sporogenes reconstitution decreases intestinal permeability and inflammation in a PXR-dependent manner in mice
(A) Schematic of commensal depletion and C. sporogenes reconstitution experiment in Nr1i2+/+ and Nr1i2−/− mice (see Experimental Procedures). (B) Plasma IPA peak area intensity values plotted by treatment groups as illustrated in the schema (A). The IPA concentrations in micromoles (μM) pertaining to each group is illustrated above each histogram. (C) Hematoxylin and eosin staining of C. sporogenes + L-tryptophan and Heat killed C. sporogenes + L-tryptophan exposed Nr1i2+/+ and Nr1i2−/− mice jejunum cross-sections in accordance with schema (A). Scale bars, 50 μm. (D) Jejunal MPO activity (unit/g of total protein) in treatment groups from schema (A) as illustrated. (E) Real-time qPCR analysis of Ugt1a1 mRNA expression in small intestinal mucosa from schema (A). (F and G) Serum FITC-dextran recovery following oral gavage of IPA (20 mg/kg/day) and indomethacin (see schematic) in (F) Nr1i2+/+ (n = 9) and (G) Nr1i2−/− (n = 9) mice. All graphs show mean values ± s.e.m. *P ≤ 0.01 (Two-way ANOVA with Sidak’s multiple comparison test); (n=6 per group). **P ≤ 0.01 (Student’s t-test); n.s. not significant. Also see Figure S2 and Table S2
Figure 3
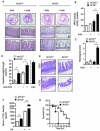
Figure 3
Nr1i2−/− mice are more susceptible to toxic injuries to the small intestine (A) Hematoxylin and eosin staining of indomethacin (Indo) treated Nr1i2+/+ and Nr1i2−/− mice jejunum cross-sections. (B) Jejunal MPO activity (unit/g of total protein) in Nr1i2+/+ and Nr1i2−/− mice treated with indomethacin (n=6 per group). (C) Histological score measuring severity of tissue damage in jejunum from Nr1i2+/+ and Nr1i2−/− mice in indomethacin treated and untreated groups (n=6 per group). (D) Weight to length ratio of the jejunum (enteropooling) in Nr1i2+/+ and Nr1i2−/− mice treated with anti-CD3 antibody. The change in weight-to-length ratio in Nr1i2+/+ and Nr1i2−/− mice exposed to anti-CD3 was 27.6% and 22.9%, respectively. Values represent mean ± s.e.m. (n=5 per group). (E) Hematoxylin and eosin staining of anti-CD3 antibody treated Nr1i2+/+ and Nr1i2−/− mice jejunum cross-sections. (F) Serum FITC-dextran recovery following gastrointestinal ischemia-reperfusion (I/R) injury in Nr1i2+/+ and Nr1i2−/− mice (n=5 per group). The change in permeability as assessed by a change in recovery of mean levels of FITC - dextran in the serum of Nr1i2+/+ and Nr1i2−/− mice was 193% and 488.9%, respectively. (G) Kaplan-Meier survival curves of Nr1i2+/+ and Nr1i2−/− mice treated with LPS (n=6 per group). All graphs show mean values ± s.e.m. *P ≤ 0.02; **P ≤ 0.0001 (Two-way ANOVA with Tukey’s multiple comparison test ). Scale bars, 50 μm. Also see Figure S3.
Figure 4
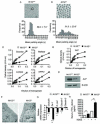
Figure 4. Ultra-structural and functional defects in Nr1i2−/− mice small intestine
(A and B) Representative TEM images of Nr1i2+/+ (A) and Nr1i2−/− (B) mice jejunum shows loose packing of microvilli in Nr1i2−/− mice. γ represents packing angle between adjacent microvilli. Packing of microvilli in Nr1i2+/+ and Nr1i2−/− mice jejunum was quantified by assessing the packing angle (γ) between adjacent microvilli. γ in Nr1i2−/− mice cross-sections (81.0 ± 23.6°, n=273) is significantly higher and more variable compared to Nr1i2+/+ mice (59.6 ± 7.0°, n=275) (n=5 per group). (C) Sucrase, maltase, lactase and dipeptidyl peptidase (DPPIV) enzyme activities in Nr1i2+/+ and Nr1i2−/− mice jejunum villi enterocytes. Proportionality between amount of enzyme present (jejunal villi enterocyte homogenate containing 20 mg/ml of protein as enzyme, x-axis) and amount of substrate liberated (optical density, y-axis) in 60 minutes was plotted in the graph (n=8-10 per group). (D) Alkaline phosphatase enzyme activity in Nr1i2+/+ and Nr1i2−/− mice jejunum villi enterocyte homogenate (n=8-10 per group). (E) Immunoblot analysis of alkaline phosphatase and β-actin (loading control) in Nr1i2+/+ and Nr1i2−/− mice jejunum villi enterocytes (n=5 per group). (F) Representative TEM images of Nr1i2+/+ and Nr1i2−/− mice jejunum enterocytes demonstrating cell-cell junctional complexes and perijunctional cytoskeletal condensation. Inset shows magnified views of cell-cell junctional complex. (G) Real-time qPCR analysis of key Tj and Aj regulatory genes in Nr1i2+/+ and Nr1i2−/− mice jejunum villi enterocytes (n=8-10 per group). Data plotted as fold change in Nr1i2−/− mice relative to mRNA levels in Nr1i2+/+ mice. (H) Serum FITC-dextran recovery in Nr1i2+/+ and Nr1i2−/− mice following treatment with KDO2. (n=8-10 per group). All graphs show mean values ± s.e.m.* , **P ≤ 0.0001; n.s. not significant (Two-way ANOVA with Tukey’s multiple comparison test). Scale bars: A, B and F, 0.5 μm. Also see Figure S4.
Figure 5
Figure 5. Small intestine epithelial barrier dysfunction in Nr1i2−/− mice requires TLR4 expression and signaling
(A and B) Real-time qPCR analysis of (A) anti-inflammatory, anti-microbial, pro-inflammatory and (B) Tlr gene expression in Nr1i2+/+ and Nr1i2−/− mice jejunum villi enterocytes (n=8-10 per group). Data plotted as fold change in Nr1i2−/− mice relative to mRNA levels in Nr1i2+/+ mice. (C) Immunoblot shows increased expression of TLR4 in Nr1i2−/− mice (n=6 per group) (left). Immunoblots are representative of three independent experiments. Quantitation of band density was performed with two blots each with three different exposure times (right). (D) Real - time qPCR analysis of key regulatory genes of epithelial barrier function in Nr1i2+/+, Nr1i2−/−, Tlr4−/− and Nr1i2−/− /Tlr4−/− mice jejunum villi enterocytes (n=8-10 per group). (E) Representative TEM images of Nr1i2+/+, Nr1i2−/−, Tlr4−/− and Nr1i2−/− / Tlr4−/− mice jejunum showing microvilli (left) and quantitation of average microvillus length (right). (F) Representative TEM images of Nr1i2+/+, Nr1i2−/−, Tlr4−/− and Nr1i2−/− / Tlr4−/− mice jejunum showing cell-cell junctional complex. (G) Enzyme (as denoted) activity assays performed with jejunal villi enterocyte homogenate from Nr1i2+/+, Nr1i2−/−, Tlr4−/− and Nr1i2−/− /Tlr4−/− mice. Data are expressed as fold change relative to Nr1i2+/+ mice. (H) Serum FITC-dextran levels in Nr1i2+/+, Nr1i2−/−, Tlr4−/− and Nr1i2−/− /Tlr4−/− mice (n=8-10 per group). All graphs show mean values ± s.e.m. *P ≤ 0.05; **P ≤ 0.01; n.s. not significant (A,B,D,E,G,H) (Two-way ANOVA with Tukey’s multiple comparison test); (C) Student t-test. Scale bars: E and F, 0.5 μm. Also see Figure S5.
Figure 6
Figure 6. TLR4 is critical for indomethacin-induced intestinal injury as well as IPA effects on permeability in vivo
(A) Representative Hematoxylin and eosin staining of vehicle (-Indo) and indomethacin (Indo) treated Nr1i2−/− /Tlr4−/− mice jejunum cross-sections (n=6 per group). (B) Jejunal MPO activity (unit/g of total protein) in Nr1i2−/− and Nr1i2−/− /Tlr4−/− mice treated with indomethacin (n=6 per group). *P ≤ 0.005 (One-way ANOVA with Sidak’s multiple comparison test). (C) Serum FITC-dextran recovery following oral gavage of IPA (20 mg/kg/day) and indomethacin (see schematic ) in Tlr−/− (n = 9) mice. (D) Serum FITC-dextran recovery following oral gavage of IPA (20 mg/kg/day) and KDO2 200μg/day (see schematic) in conventional mice (Nr1i2+/+ ) and commensal depleted (CD) mice (Nr1i2+/+ ) (n = 8 per group). All graphs show mean values ± s.e.m. *P ≤ 0.004 ,**P ≤ 0.05; n.s. not significant (Two-way ANOVA with Tukey’s multiple comparison test).
Figure 7
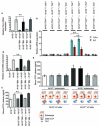
Figure 7. Epithelial barrier defects in Nr1i2−/− mice small intestine is dependent on non-hematopoietic (epithelium) compartment
(A and B) Real-time qPCR analysis of pro-inflammatory markers (A) Tnf-α and (B) Il-6 was assessed in Nr1i2+/+ (n=10), Nr1i2−/− (n=10), Nr1i2+/+ BM→ Nr1i2+/+ (n=9), Nr1i2+/+ BM→ Nr1i2−/− (n=9), Nr1i2−/− BM→ Nr1i2+/+ (n=6) and Nr1i2−/− BM→ Nr1i2−/− (n=5) mice jejunal villi enterocytes. Data are expressed as fold change in all mice groups compared to Nr1i2+/+ mice. (C) In vivo FITC-dextran permeability assay was performed in Nr1i2+/+ (n=10 mice), Nr1i2−/− (n=10), Nr1i2+/+ BM→ Nr1i2+/+ (n=9), Nr1i2+/+ BM→ Nr1i2−/− (n=9), Nr1i2−/− BM→ Nr1i2+/+ (n=6) and Nr1i2−/− BM→ Nr1i2−/− (n=5) mice. (D) Real-time PCR analysis of proinflammatory markers (blue) Tnf-α and (red) Il-6 was assessed in genotypes illustrated (n=5) mice jejunal mucosa. Data are expressed as fold change in all mice groups compared to Nr1i2−/− /Tlr4+/+Nr1i2+/+ /Tlr4+/+ mice. (E) In vivo FITC-dextran permeability assay was performed in (n=5) mice jejunal mucosa. All graphs show mean values ± s.e.m.; n.s. not significant (Two-way ANOVA with Tukey’s multiple comparison test).

Similar articles

Cited by

References

    1. Abreu MT. Toll-like receptor signalling in the intestinal epithelium: how bacterial recognition shapes intestinal function. Nat Rev Immunol. 2010;10:131–144. - PubMed
    1. Abreu MT, Vora P, Faure E, Thomas LS, Arnold ET, Arditi M. Decreased expression of Toll-like receptor-4 and MD-2 correlates with intestinal epithelial cell protection against dysregulated proinflammatory gene expression in response to bacterial lipopolysaccharide. Journal of immunology. 2001;167:1609–1616. - PubMed
    1. Asano T, Tanaka K, Yamakawa N, Adachi H, Sobue G, Goto H, Takeuchi K, Mizushima T. HSP70 confers protection against indomethacin-induced lesions of the small intestine. The Journal of pharmacology and experimental therapeutics. 2009;330:458–467. - PubMed
    1. Ashida H, Ogawa M, Kim M, Mimuro H, Sasakawa C. Bacteria and host interactions in the gut epithelial barrier. Nat Chem Biol. 2011;8:36–45. - PubMed
    1. Asquith M, Powrie F. An innately dangerous balancing act: intestinal homeostasis, inflammation, and colitis-associated cancer. The Journal of experimental medicine. 2010;207:1573–1577. - PMC - PubMed

Publication types

MeSH terms