Land, irrigation water, greenhouse gas, and reactive nitrogen burdens of meat, eggs, and dairy production in the United States
- PMID: 25049416
- PMCID: PMC4143028
- DOI: 10.1073/pnas.1402183111
Land, irrigation water, greenhouse gas, and reactive nitrogen burdens of meat, eggs, and dairy production in the United States
Abstract
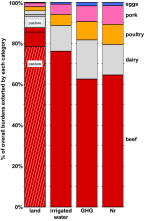
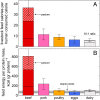
Livestock production impacts air and water quality, ocean health, and greenhouse gas (GHG) emissions on regional to global scales and it is the largest use of land globally. Quantifying the environmental impacts of the various livestock categories, mostly arising from feed production, is thus a grand challenge of sustainability science. Here, we quantify land, irrigation water, and reactive nitrogen (Nr) impacts due to feed production, and recast published full life cycle GHG emission estimates, for each of the major animal-based categories in the US diet. Our calculations reveal that the environmental costs per consumed calorie of dairy, poultry, pork, and eggs are mutually comparable (to within a factor of 2), but strikingly lower than the impacts of beef. Beef production requires 28, 11, 5, and 6 times more land, irrigation water, GHG, and Nr, respectively, than the average of the other livestock categories. Preliminary analysis of three staple plant foods shows two- to sixfold lower land, GHG, and Nr requirements than those of the nonbeef animal-derived calories, whereas irrigation requirements are comparable. Our analysis is based on the best data currently available, but follow-up studies are necessary to improve parameter estimates and fill remaining knowledge gaps. Data imperfections notwithstanding, the key conclusion--that beef production demands about 1 order of magnitude more resources than alternative livestock categories--is robust under existing uncertainties. The study thus elucidates the multiple environmental benefits of potential, easy-to-implement dietary changes, and highlights the uniquely high resource demands of beef.
Keywords: food impact; foodprint; geophysics of agriculture; multimetric analysis.
Conflict of interest statement
The authors declare no conflict of interest.
Figures


Comment in
-
Reply to Metson et al.: The importance of phosphorus perturbations.Proc Natl Acad Sci U S A. 2014 Nov 18;111(46):E4908. doi: 10.1073/pnas.1418658111. Epub 2014 Nov 10. Proc Natl Acad Sci U S A. 2014. PMID: 25385649 Free PMC article. No abstract available.
-
Phosphorus is a key component of the resource demands for meat, eggs, and dairy production in the United States.Proc Natl Acad Sci U S A. 2014 Nov 18;111(46):E4906-7. doi: 10.1073/pnas.1417759111. Epub 2014 Nov 10. Proc Natl Acad Sci U S A. 2014. PMID: 25385650 Free PMC article. No abstract available.
-
Reply to Tichenor: Proposed update to beef greenhouse gas footprint is numerically questionable and well within current uncertainty bounds.Proc Natl Acad Sci U S A. 2015 Feb 24;112(8):E822-3. doi: 10.1073/pnas.1422670112. Epub 2015 Feb 4. Proc Natl Acad Sci U S A. 2015. PMID: 25653340 Free PMC article. No abstract available.
-
Role of dairy in the carbon footprint of US beef.Proc Natl Acad Sci U S A. 2015 Feb 24;112(8):E820-1. doi: 10.1073/pnas.1421941112. Epub 2015 Feb 4. Proc Natl Acad Sci U S A. 2015. PMID: 25653341 Free PMC article. No abstract available.
Similar articles
-
Phosphorus is a key component of the resource demands for meat, eggs, and dairy production in the United States.Proc Natl Acad Sci U S A. 2014 Nov 18;111(46):E4906-7. doi: 10.1073/pnas.1417759111. Epub 2014 Nov 10. Proc Natl Acad Sci U S A. 2014. PMID: 25385650 Free PMC article. No abstract available.
-
Trends in greenhouse gas emissions from consumption and production of animal food products - implications for long-term climate targets.Animal. 2013 Feb;7(2):330-40. doi: 10.1017/S1751731112001498. Epub 2012 Jul 13. Animal. 2013. PMID: 23031741
-
Role of dairy in the carbon footprint of US beef.Proc Natl Acad Sci U S A. 2015 Feb 24;112(8):E820-1. doi: 10.1073/pnas.1421941112. Epub 2015 Feb 4. Proc Natl Acad Sci U S A. 2015. PMID: 25653341 Free PMC article. No abstract available.
-
The Minderoo-Monaco Commission on Plastics and Human Health.Ann Glob Health. 2023 Mar 21;89(1):23. doi: 10.5334/aogh.4056. eCollection 2023. Ann Glob Health. 2023. PMID: 36969097 Free PMC article. Review.
-
Reducing climate impacts of beef production: A synthesis of life cycle assessments across management systems and global regions.Glob Chang Biol. 2021 May;27(9):1721-1736. doi: 10.1111/gcb.15509. Epub 2021 Mar 3. Glob Chang Biol. 2021. PMID: 33657680 Free PMC article. Review.
Cited by
-
CRISPR-edited, cell-based future-proof meat and seafood to enhance global food security and nutrition.Cytotechnology. 2024 Dec;76(6):619-652. doi: 10.1007/s10616-024-00645-y. Epub 2024 Jul 26. Cytotechnology. 2024. PMID: 39435422 Review.
-
Greenhouse gas emissions in US beef production can be reduced by up to 30% with the adoption of selected mitigation measures.Nat Food. 2024 Sep;5(9):787-797. doi: 10.1038/s43016-024-01031-9. Epub 2024 Aug 30. Nat Food. 2024. PMID: 39215094 Free PMC article.
-
Sustainability initiatives in inpatient psychiatry: tackling food waste.Front Psychiatry. 2024 Jul 4;15:1374788. doi: 10.3389/fpsyt.2024.1374788. eCollection 2024. Front Psychiatry. 2024. PMID: 39026524 Free PMC article.
-
Mitigation potential of methane emissions in China's livestock sector can reach one-third by 2030 at low cost.Nat Food. 2024 Jul;5(7):603-614. doi: 10.1038/s43016-024-01010-0. Epub 2024 Jul 9. Nat Food. 2024. PMID: 38982279
-
Dietary fat and carbohydrate-balancing the lactation performance and methane emissions in the dairy cow industry: A meta-analysis.Anim Nutr. 2024 Mar 22;17:347-357. doi: 10.1016/j.aninu.2024.02.004. eCollection 2024 Jun. Anim Nutr. 2024. PMID: 38800741 Free PMC article.
References
-
- McMichael AJ, Powles JW, Butler CD, Uauy R. Food, livestock production, energy, climate change, and health. Lancet. 2007;370(9594):1253–1263. - PubMed
-
- Galloway JN, et al. Transformation of the nitrogen cycle: Recent trends, questions and potential solutions. Science. 2008;320(5878):889–892. - PubMed
-
- Steinfeld H, et al. Livestock’s Long Shadow: Environmental Issues and Options. Rome: Food and Agriculture Organization of the United Nations; 2006.
-
- Eshel G, Martin PA. Diet, energy, and global warming. Earth Interact. 2006;10(9):1–17.
Publication types
MeSH terms
Substances
Grants and funding
LinkOut - more resources
Full Text Sources
Other Literature Sources

