

Modeling the specificity of protein-DNA interactions
- PMID: 25045190
- PMCID: PMC4101922
- DOI: 10.1007/s40484-013-0012-4
Modeling the specificity of protein-DNA interactions
Abstract
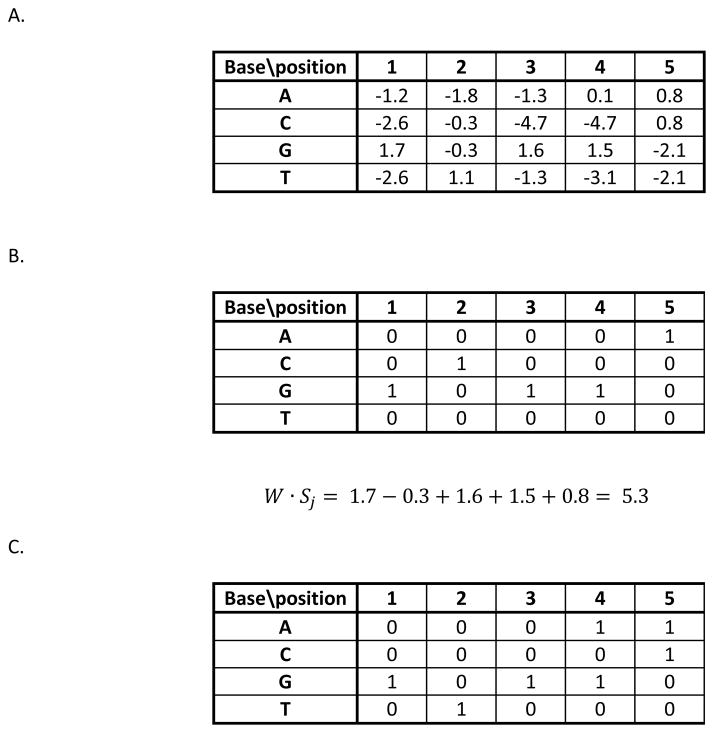
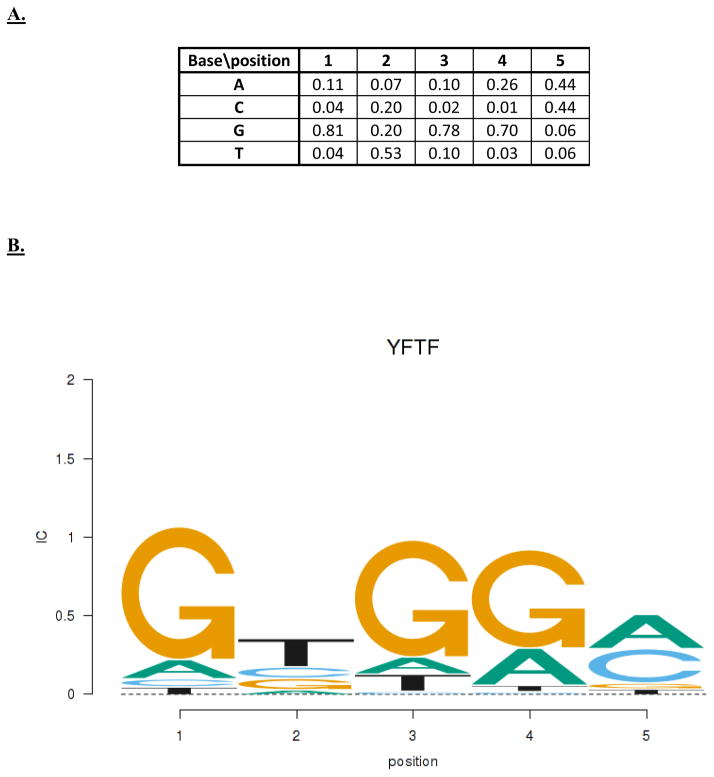
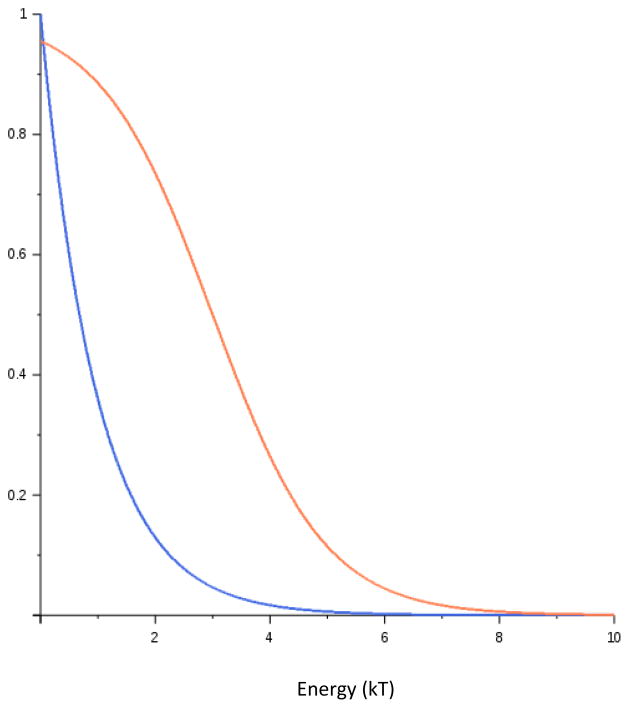
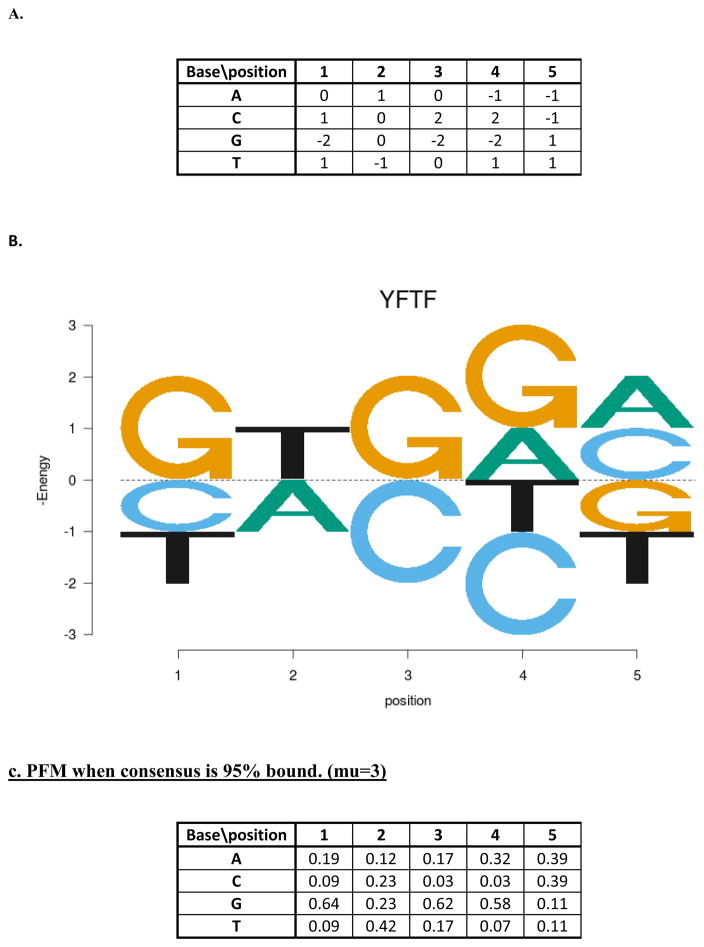
The specificity of protein-DNA interactions is most commonly modeled using position weight matrices (PWMs). First introduced in 1982, they have been adapted to many new types of data and many different approaches have been developed to determine the parameters of the PWM. New high-throughput technologies provide a large amount of data rapidly and offer an unprecedented opportunity to determine accurately the specificities of many transcription factors (TFs). But taking full advantage of the new data requires advanced algorithms that take into account the biophysical processes involved in generating the data. The new large datasets can also aid in determining when the PWM model is inadequate and must be extended to provide accurate predictions of binding sites. This article provides a general mathematical description of a PWM and how it is used to score potential binding sites, a brief history of the approaches that have been developed and the types of data that are used with an emphasis on algorithms that we have developed for analyzing high-throughput datasets from several new technologies. It also describes extensions that can be added when the simple PWM model is inadequate and further enhancements that may be necessary. It briefly describes some applications of PWMs in the discovery and modeling of in vivo regulatory networks.
Figures
Similar articles
-
Learning position weight matrices from sequence and expression data.Comput Syst Bioinformatics Conf. 2007;6:249-60. Comput Syst Bioinformatics Conf. 2007. PMID: 17951829
-
Optimized position weight matrices in prediction of novel putative binding sites for transcription factors in the Drosophila melanogaster genome.PLoS One. 2013 Aug 6;8(8):e68712. doi: 10.1371/journal.pone.0068712. Print 2013. PLoS One. 2013. PMID: 23936309 Free PMC article.
-
A DNA shape-based regulatory score improves position-weight matrix-based recognition of transcription factor binding sites.Bioinformatics. 2015 Nov 1;31(21):3445-50. doi: 10.1093/bioinformatics/btv391. Epub 2015 Jun 30. Bioinformatics. 2015. PMID: 26130577 Free PMC article.
-
DNA Motif Databases and Their Uses.Curr Protoc Bioinformatics. 2015 Sep 3;51:2.15.1-2.15.6. doi: 10.1002/0471250953.bi0215s51. Curr Protoc Bioinformatics. 2015. PMID: 26334922 Review.
-
Absence of a simple code: how transcription factors read the genome.Trends Biochem Sci. 2014 Sep;39(9):381-99. doi: 10.1016/j.tibs.2014.07.002. Epub 2014 Aug 14. Trends Biochem Sci. 2014. PMID: 25129887 Free PMC article. Review.
Cited by
-
TFBSshape: an expanded motif database for DNA shape features of transcription factor binding sites.Nucleic Acids Res. 2020 Jan 8;48(D1):D246-D255. doi: 10.1093/nar/gkz970. Nucleic Acids Res. 2020. PMID: 31665425 Free PMC article.
-
Episodes of Rapid Recovery of the Functional Activity of the ras85D Gene in the Evolutionary History of Phylogenetically Distant Drosophila Species.Front Genet. 2022 Jan 12;12:807234. doi: 10.3389/fgene.2021.807234. eCollection 2021. Front Genet. 2022. PMID: 35096018 Free PMC article.
-
Cell layer-specific expression of the homeotic MADS-box transcription factor PhDEF contributes to modular petal morphogenesis in petunia.Plant Cell. 2024 Jan 30;36(2):324-345. doi: 10.1093/plcell/koad258. Plant Cell. 2024. PMID: 37804091 Free PMC article.
-
Comparison of discriminative motif optimization using matrix and DNA shape-based models.BMC Bioinformatics. 2018 Mar 6;19(1):86. doi: 10.1186/s12859-018-2104-7. BMC Bioinformatics. 2018. PMID: 29510689 Free PMC article.
-
Computational identification and experimental characterization of preferred downstream positions in human core promoters.PLoS Comput Biol. 2021 Aug 12;17(8):e1009256. doi: 10.1371/journal.pcbi.1009256. eCollection 2021 Aug. PLoS Comput Biol. 2021. PMID: 34383743 Free PMC article.
References
-
- Benos PV, Lapedes AS, Stormo GD. Probabilistic code for DNA recognition by proteins of the EGR family. Journal of molecular biology. 2002;323:701–727. - PubMed
-
- Wolfe SA, Nekludova L, Pabo CO. DNA recognition by Cys2His2 zinc finger proteins. Annual review of biophysics and biomolecular structure. 2000;29:183–212. - PubMed
-
- Klug A. The discovery of zinc fingers and their development for practical applications in gene regulation and genome manipulation. Quarterly reviews of biophysics. 2010;43:1–21. - PubMed
Grants and funding
LinkOut - more resources
Full Text Sources
Other Literature Sources