. 2014 Sep 18;513(7518):382-7.
doi: 10.1038/nature13438. Epub 2014 Jul 20.

Proteogenomic characterization of human colon and rectal cancer

Collaborators, Affiliations

Proteogenomic characterization of human colon and rectal cancer

Bing Zhang et al. Nature. .

Abstract

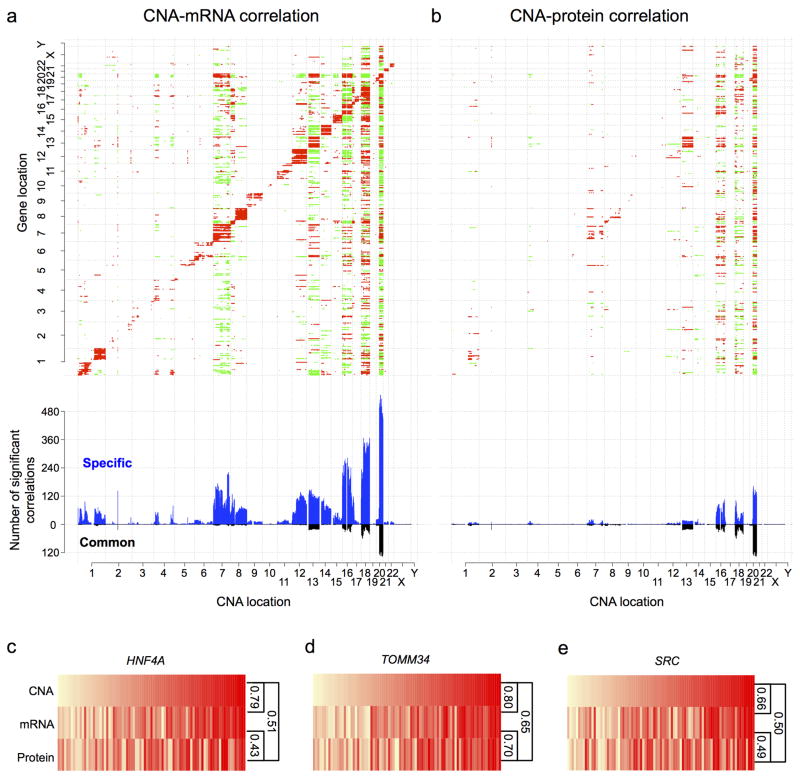
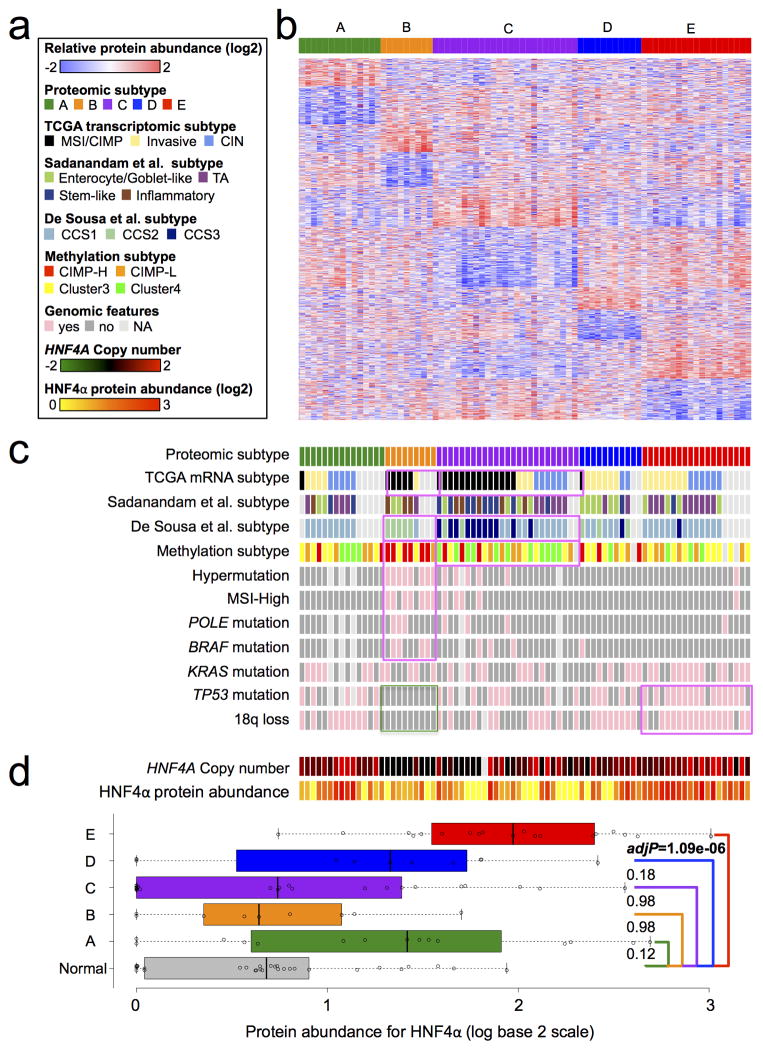
Extensive genomic characterization of human cancers presents the problem of inference from genomic abnormalities to cancer phenotypes. To address this problem, we analysed proteomes of colon and rectal tumours characterized previously by The Cancer Genome Atlas (TCGA) and perform integrated proteogenomic analyses. Somatic variants displayed reduced protein abundance compared to germline variants. Messenger RNA transcript abundance did not reliably predict protein abundance differences between tumours. Proteomics identified five proteomic subtypes in the TCGA cohort, two of which overlapped with the TCGA 'microsatellite instability/CpG island methylation phenotype' transcriptomic subtype, but had distinct mutation, methylation and protein expression patterns associated with different clinical outcomes. Although copy number alterations showed strong cis- and trans-effects on mRNA abundance, relatively few of these extend to the protein level. Thus, proteomics data enabled prioritization of candidate driver genes. The chromosome 20q amplicon was associated with the largest global changes at both mRNA and protein levels; proteomics data highlighted potential 20q candidates, including HNF4A (hepatocyte nuclear factor 4, alpha), TOMM34 (translocase of outer mitochondrial membrane 34) and SRC (SRC proto-oncogene, non-receptor tyrosine kinase). Integrated proteogenomic analysis provides functional context to interpret genomic abnormalities and affords a new paradigm for understanding cancer biology.


Conflict of interest statement

The authors declare no competing financial interests.

Figures

Extended Data Figure 1
Extended Data Figure 1. Mass spectrometry (MS)-based proteomics workflow
Protein was extracted from frozen tumor tissue and used to generate tryptic digests. The resulting tryptic peptides were fractionated using off-line basic-reverse phase high-pressure liquid chromatography (bRPLC). Collected fractions were pooled and used for reverse phase HPLC in-line with a Thermo Orbitrap-Velos MS instrument. Raw data was processed by MSConvert and then used for database and spectral library searching using three different search engines (Myrimatch, Pepitome and MS-GF+). Identified peptides were assembled using IDPicker 3 with selected filters as described in the methods. IDPicker 3 stores its protein assemblies for a specified set of filters in the idpDB format. These SQLite databases associate spectra with peptides, peptides with proteins, and LC-MS/MS experiments with a hierarchy of experiments.
Extended Data Figure 2
Extended Data Figure 2. Relaxing the false discovery rate (FDR) of peptide-spectrum match (PSM) for high-confident proteins increases spectral counts
To increase spectral counts and improve statistical comparisons, we first created a protein assembly that maximized the number of proteins identified (at 0.1% PSM FDR) and then relaxed the PSM FDR to 1% exclusively for the set of confidently identified proteins. This strategy led to increased spectral counts from 4,896,831 to 6,299,756, a 29% increase. a, Spectral count plot of all 7,526 confidently identified proteins demonstrates the increase in the absolute number of spectra identified for each protein, but no decrease for any of the proteins. Each dot in the figure represents one of the 7,526 proteins; x-axis and y-axis represent the spectral counts obtained in the data sets with 0.1% and 1% PSM FDR, respectively, both plotted on a log scale. b, Density plot showing the distribution of PSM FDR scores for all rescued PSMs. Rescued PSMs are of high quality with a median PSM FDR score of less than 0.2%, indicating the maintained integrity of the data set.
Extended Data Figure 3
Extended Data Figure 3. Reads mapping, exon coverage and missense somatic variants in RNA-Seq data
a, Summary of total RNA-Seq read counts and mapping results for individual samples. b, Distribution of percentage sequence coverage in exons for individual samples. Among all 228,157 exons, 76% were expressed, but only 64% had an average coverage greater than 1. Exons with no coverage were not included in the box plots. c, Number of missense somatic variants detected by RNA-Seq in individual samples. Approximately 54% of the mutation positions were covered by RNA-Seq reads and only 43% were covered by three or more reads.
Extended Data Figure 4
Extended Data Figure 4. PRM (Parallel reaction monitoring) validation results
a, PRM data for the variant sequence LVVVGADGVGK (KRAS G12D in TCGA-AA-3818). b, PRM data for the variant sequence LVVVGADGVGK (KRAS G12D in TCGA-AG-A00Y). c, PRM data for the variant sequence TPVLFDVYEIK (ANXA11 I278V in TCGA-AF-3400). d, PRM data for the variant sequence DLEDLFFK (SRSF9 Y35F in TCGA-AA-A01P). Single amino acid variants (SAAVs) identified in the TCGA shotgun data set were validated using PRM analyses. Three distinct SAAVs in four TCGA samples were selected for validation. The TCGA samples were freshly prepared in the same manner as the original samples analyzed by shotgun proteomics. Each sample was spiked with 12.5 fmol/μL of a mixture of all isotopically labeled peptides. Using an inclusion list containing the precursor m/z values representing both unlabeled (endogenous) and labeled peptides, each fraction was analyzed by PRM for the variant peptides. For each variant shown in a–d, the top MS/MS spectra display represents the spectrum identified in the initial shotgun analyses of the TCGA samples. The two annotated spectra shown below the original spectra represent the MS/MS of the unlabeled endogenous variant peptide and the spiked respective labeled peptide in the PRM analysis of the TCGA sample, respectively. The chromatographic traces show the overlapping transitions and retention time of both the endogenous and labeled variant peptide, respectively.
Extended Data Figure 5
Extended Data Figure 5. Platform evaluation and analysis method selection using quality control (QC) samples
a, The lower-left half (uncolored) depicts pair-wise scatter plots of the samples, with x- and y-axes representing quantile-normalized spectral counts for samples in corresponding columns and rows, respectively. The upper-right half (red colored) depicts pair-wise Spearman’s correlation coefficients for the same comparisons. b, For each normalization method (none, global, quantile, and NSAF), we calculated the intraclass correlation coefficients (ICCs) for individual proteins in the QC data set. The analysis was done for the top 1000, 500, or 100 proteins with the largest variance and the cumulative fraction curves were plotted. In most scenarios, quantile normalization generated slightly higher ICC scores than global normalization, and both methods clearly outperformed the NSAF normalization. c, We sorted all proteins in the QC data set based on their total spectral counts and then divided the proteins into 10 bins with equal number of proteins. Average spectral count ranges for each bin are shown in the brackets in the legend box. For each bin, we calculated the ICCs for individual proteins in the bin. The analysis was done for the top 300, 200, or 100 proteins with the largest variance in each bin. The cumulative fraction curves were plotted. Protein bins with spectral counts less than 1.4 showed clearly lower ICC scores, whereas the ICC score curves started to converge when the average spectral count was greater than 1.4.
Extended Data Figure 6
Extended Data Figure 6. Extended data for mRNA-protein correlation analysis
a, Evaluation of the length-bias in different RNA-Seq-based gene abundance estimation methods. The plot shows the distribution of correlation between gene length and estimated transcript abundance based on FPKM (Fragments Per Kilobase of exon per Million fragments mapped, blue curve) and RSEM (RNA-Seq Expectation Maximization, red curve), respectively. FPKM measure is independent of gene length, whereas the RSEM measure strongly correlates with gene length. b, Relationship between mRNA-protein correlation and the stability of the molecules. Human genes were separated into four categories based on the mRNA and protein half-lives of their mouse orthologs: stable mRNA/stable protein; stable mRNA/unstable protein, unstable mRNA/stable protein, and unstable mRNA/unstable protein. Distribution of mRNA-protein correlations for genes in each category was plotted in the box plots. Genes with stable mRNA and stable protein showed relatively higher mRNA-protein correlation whereas those with unstable mRNA and unstable protein showed relatively lower mRNA-protein correlation. Only common genes in both our study and the mouse study were included in the analysis. The total number of genes in each category (N) is labeled in the figure. The p value indicating correlation difference among the four categories was calculated based on the Kruskal-Wallis non-parametric ANOVA test. The p value indicating correlation difference between the stable mRNA/stable protein group and the unstable mRNA/unstable protein group was calculated based on the two-sided Wilcoxon rank-sum test.
Extended Data Figure 7
Extended Data Figure 7. mRNA and protein-level cis-effect of copy number alterations (CNAs) in focal amplification, focal deletion and non-focal regions
The figure plots cumulative fraction curves of CNA-mRNA (dashed lines) and CNA-protein (solid lines) expression correlations for genes in the focal amplification regions (red), focal deletion regions (green), and non-focal regions (blue), respectively. Focal amplification regions were defined in the TCGA study. Any chromosomal regions outside the focal amplification and deletion regions were considered as non-focal regions. CNA-mRNA correlations were significantly higher than CNA-protein correlations for genes in any of the three groups. Moreover, genes in the focal amplification regions showed the highest level of CNA-mRNA and CNA-protein correlations among the three groups of genes. P values were based on the two-sided kolmogorov-smirnov test.
Extended Data Figure 8
Extended Data Figure 8. HNF4α isoforms and the effect of HNF4A shRNA on the proliferation of colon cancer cells
a, Multiple sequence alignment of the HNF4α isoforms, with peptides detected by shotgun proteomics and sequences corresponding to the shRNA target sequences highlighted. Different colors of the letters indicate different levels of sequence coverage in the shotgun proteomics study, as indicated by the color scale bar. Yellow boxes highlight sequences corresponding to the shRNA target sequences. TRCN0000019193 specifically targets P1 promoter-driven isoforms, whereas the other two target both types of isoforms. b–d, The P1- HNF4α specific shRNA showed mixed impacts (b), whereas shRNAs simultaneously targeting both P1- and P2- HNF4α showed a primarily negative impact on cell proliferation (c,d). Moreover, a stronger negative impact was associated with increased copy number, both for the P1- HNF4α specific shRNA (p=0.04, Spearman’s correlation [r]) and for all shRNAs (p=0.01, Spearman’s correlation p-values for individual shRNAs summarized by the Fisher’s combined probability test).
Extended Data Figure 9
Extended Data Figure 9. Consensus matrices, the empirical cumulative distribution function (CDF) plot and core sample identification
a, Consensus matrices of the 90 CRC samples for k = 2 to k = 8. The consensus matrices show the robustness of the discovered clusters to sampling variability (resampling 80% samples) for cluster numbers k = 2 to 8. In each consensus matrix, both the rows and the columns were indexed with the same sample order and samples belonging to the same cluster frequently are adjacent to each other. For each pair of samples, a consensus index, which is the percentage of times they belong to the same cluster during 1,000 runs of the clustering algorithm based on resampling was calculated. The consensus index for each pair of samples was represented by color gradient from white (0%) to red (100%) in the consensus matrix. b, CDF plots corresponding to the consensus matrices for k = 2 to k = 8. This plot shows the cumulative distribution of the entries of the consensus matrices within the 0–1 range. Skew toward 0 and 1 indicates good clustering. As k increases, the area under the CDF is hypothesized to increase markedly until k reaches the ktrue. In this case, 7 was considered as ktrue because the change of the area under the CDF was close to zero when k increased from 7 to 8. c, Silhouette plot for core sample identification. For each sample (y-axis), the silhouette width (x-axis) compares its similarity to its assigned class and to any other classes. Samples with higher similarity to their assigned class than to any other classes will get positive silhouette width score and be selected as core samples.
Extended Data Figure 10
Extended Data Figure 10. Network analysis of the subtype signature proteins
a, The number of signature proteins for each subtype. For a given subtype, the red circle represents proteins that were different in abundance between the subtype and all other subtypes, the green circle represents proteins that were different in abundance between the subtype and normal colon tissues. The intersection between red and green circles contains the signature proteins for each subtype. b, Visualizing subtype C signature proteins in NetGestalt. Proteins in the iRef protein-protein interaction network are placed in a linear order together with the hierarchical modular organization of the network. Alternating bar colors (green and orange) are used to distinguish neighboring modules. Proteins in the up- and down-signatures of subtype C were visualized as two separate tracks below the network modules, where each bar represents a protein. These proteins are not randomly distributed in the network. Highlighted by red or blue arrows are four Network modules (I, IV, V, VI) significantly enriched with up-signature proteins and two modules (II and III) significantly enriched with down-signature proteins (adjusted p value < 0.01). c–d, Heat maps depicting relative abundance of down- and up-signature proteins of subtype C in modules III and I, respectively. Tumors are displayed as rows, grouped by normal controls (N) and proteomic subtypes (A–E) as indicated by different side bar colors. Proteins are displayed as columns. e–f, Network diagrams depicting the interaction of down- and up-signature proteins of subtype C in modules III and I, respectively. Node and node-border colors represent relatively higher or lower abundance in the subtype compared to other subtypes and normal colon tissues, respectively. Red and blue in the heat maps and the network diagrams represent relatively higher or lower abundance, respectively.
Figure 1
Figure 1. Summary of detected single amino acid variants (SAAVs) and the impact of single nucleotide variants (SNVs) on protein abundance
a, The number of different types of SAAVs (TCGA-reported somatic variants, COSMIC-supported variants, dbSNP-supported variants, and new variants) in individual tumor samples. The samples are ordered by the number of detected somatic variants, then COSMIC-supported variants, and then dbSNP-supported variants. The Microsatellite instability (MSI) and hypermutation (Hyper) status are labeled below the bar charts for each sample (MSI-High: red, MSI-Low: orange, Microsatellite Stable: yellow; hypermutated: blue, non-hypermutated: sky blue; no data: grey). The number of somatic variants and COSMIC-supported variants were significantly higher in MSI-High and hypermutated tumors, whereas the other two types of SAAVs were randomly distributed across the data set. b, The total numbers for different types of SAAVs and their overlapping relations. All 796 detected SAAVs were annotated based on previous reports in dbSNP (left circle), COSMIC (middle circle), or TCGA-reported somatic variants (right circle), and their overlapping relations are shown in the Venn diagram. There are 162 SAAVs that have not been reported previously in these databases (new). c, Distribution of the frequency of occurrence (1 sample: light grey, 2–9 samples: grey, >=10 samples: dark grey) for different types of SAAVs. Border colors of the pie charts correspond to different SAAV types using the same color scheme as in (a). Whereas 58% of dbSNP-supported variants occurred in two or more samples, almost all somatic variants each occurred in only one sample. d, SNVs detected in RNA-Seq data were separated into three categories (dbSNP-supported, COSMIC-supported, and TCGA-Somatic). The impact of individual SNVs on protein abundance was calculated (see supplementary methods) and the impact scores for different categories of SNVs were plotted as cumulative fraction curves with two-sided p values from the Kolmogorov-Smirnov test labeled. The percentage of SNVs with an absolute impact score greater than 2 was also plotted as an inset, with p values from the Chi-squared test. Sample size for the dbSNP-supported, COSMIC-supported and TCGA-Somatic variants were 12184, 7492, and 3302, respectively.
Figure 2
Figure 2. Correlations between mRNA and protein abundance in TCGA tumors
a, Steady state mRNA and protein abundance were positively correlated in all 86 samples (multiple-test adjusted p value < 0.01) with a mean Spearman’s correlation coefficient of 0.47. b, mRNA and protein variation were positively correlated for most (89.4%) mRNA-protein pairs across the 87 samples, but only 32% showed significant correlation (multiple-test adjusted p value < 0.01), with a mean Spearman’s correlation coefficient of 0.23. c, mRNA and protein levels displayed dramatically different correlation for genes involved in different biological processes. Genes encoding intermediary metabolism functions showed high mRNA-protein correlations, whereas genes involved in oxidative phosphorylation, RNA splicing and ribosome components showed low or negative correlations. Multiple-test adjusted two-sided p-values from the Kolmogorov-Smirnov test were provided in the parentheses following the KEGG pathway names. Red and green in the figures indicate positive- and negative-correlations, respectively.
Figure 3
Figure 3. Effects of copy number alterations (CNAs) on mRNA and protein abundance
a,b, The top panels show copy number-abundance correlation matrices for mRNA abundance (a) and protein abundance (b) with significant positive and negative correlations (multiple-test adjusted p value < 0.01, Spearman’s correlation coefficient) indicated by red and green colors, respectively, and genes ordered by chromosomal location on both x and y-axes. The bottom panels show the frequency of mRNAs/proteins associated with a particular copy number alteration, where blue and black bars represent associations specific to mRNA/protein or common to both mRNA and protein, respectively. c–e, HNF4A, TOMM34 and SRC showed significant CNA-mRNA, mRNA-protein, and CNA-protein correlations (Spearman’s correlation coefficient). The color grade from light yellow to red indicates relatively low-level to high-level CNA, relative mRNA abundance or relative protein abundance among the 85 samples, which were ordered by copy number data.
Figure 4
Figure 4. Proteomic subtypes of colon and rectal cancers, associated genomic features, and relative abundance of HNF4α
a, Figure legends for b, c and d. b, Identification of five proteomic subtypes. Tumors are displayed as columns, grouped by proteomic subtypes as indicated by different colors. Proteins used for the subtype classification are displayed as rows. The heat map presents relative abundance of the proteins (logarithmic scale in base 2) in the 90 tumor cohort. c, Association of proteomic subtypes with major colorectal cancer-associated genomic alterations and previously published transcriptomic and methylation subtypes. Subtypes significantly overlapped with a transcriptomic or methylation subtype are highlighted by pink boxes. Both proteomic subtypes B and C showed significant overlap with the TCGA MSI/CIMP subtype. In addition, they showed significant overlap with the CCS2 and CCS3 subtypes in the De Sousa et al. classification, respectively. Proteomic subtype B significantly overlapped with the TCGA CIMP-H methylation subtype, whereas subtype C significantly overlapped with a non-methylation subtype (TCGA cluster 4 methylation subtype). Subtypes over-represented with a specific genomic alteration are also highlighted by pink boxes. The green box highlights the absence of TP53 mutations and 18q loss in subtype B. d, The top panel shows HNF4A copy number and relative abundance of HNF4α in the five subtypes; the bottom panel compares relative abundance of HNF4α in the five subtypes to that in normal colon samples, respectively, and the adjP values are based on the two-sided Wilcoxon rank-sum test followed by multiple-test adjustment.

Comment in

  • Proteogenomics sheds light on tumors.
    [No authors listed] [No authors listed] Cancer Discov. 2014 Oct;4(10):1108. doi: 10.1158/2159-8290.CD-NB2014-123. Epub 2014 Aug 14. Cancer Discov. 2014. PMID: 25274663 No abstract available.

Similar articles

Cited by

References

    1. Kandoth C, et al. Integrated genomic characterization of endometrial carcinoma. Nature. 2013;497:67–73. - PMC - PubMed
    1. TCGA. Comprehensive genomic characterization defines human glioblastoma genes and core pathways. Nature. 2008;455:1061–1068. - PMC - PubMed
    1. TCGA. Integrated genomic analyses of ovarian carcinoma. Nature. 2011;474:609–615. - PMC - PubMed
    1. TCGA. Comprehensive genomic characterization of squamous cell lung cancers. Nature. 2012;489:519–525. - PMC - PubMed
    1. TCGA. Comprehensive molecular portraits of human breast tumours. Nature. 2012;490:61–70. - PMC - PubMed

Publication types

MeSH terms