ADAM10 regulates Notch function in intestinal stem cells of mice
- PMID: 25038433
- PMCID: PMC4176890
- DOI: 10.1053/j.gastro.2014.07.003
ADAM10 regulates Notch function in intestinal stem cells of mice
Abstract
Background & aims: A disintegrin and metalloproteinase domain-containing protein 10 (ADAM10) is a cell surface sheddase that regulates physiologic processes, including Notch signaling. ADAM10 is expressed in all intestinal epithelial cell types, but the requirement for ADAM10 signaling in crypt homeostasis is not well defined.
Methods: We analyzed intestinal tissues from mice with constitutive (Vil-Cre;Adam10(f/f) mice) and conditional (Vil-CreER;Adam10(f/f) and Leucine-rich repeat-containing GPCR5 [Lgr5]-CreER;Adam10(f/f) mice) deletion of ADAM10. We performed cell lineage-tracing experiments in mice that expressed a gain-of-function allele of Notch in the intestine (Rosa26(NICD)), or mice with intestine-specific disruption of Notch (Rosa26(DN-MAML)), to examine the effects of ADAM10 deletion on cell fate specification and intestinal stem cell maintenance.
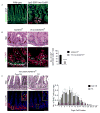
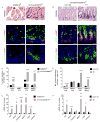
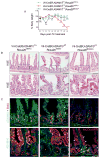
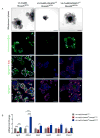
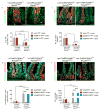
Results: Loss of ADAM10 from developing and adult intestine caused lethality associated with altered intestinal morphology, reduced progenitor cell proliferation, and increased secretory cell differentiation. ADAM10 deletion led to the replacement of intestinal cell progenitors with 2 distinct, post-mitotic, secretory cell lineages: intermediate-like (Paneth/goblet) and enteroendocrine cells. Based on analysis of Rosa26(NICD) and Rosa26(DN-MAML) mice, we determined that ADAM10 controls these cell fate decisions by regulating Notch signaling. Cell lineage-tracing experiments showed that ADAM10 is required for survival of Lgr5(+) crypt-based columnar cells. Our findings indicate that Notch-activated stem cells have a competitive advantage for occupation of the stem cell niche.
Conclusions: ADAM10 acts in a cell autonomous manner within the intestinal crypt compartment to regulate Notch signaling. This process is required for progenitor cell lineage specification and crypt-based columnar cell maintenance.
Keywords: CBC; Development; Differentiation; Intestinal Epithelium.
Copyright © 2014 AGA Institute. Published by Elsevier Inc. All rights reserved.
Figures


Similar articles
-
Cellular Plasticity of Defa4Cre-Expressing Paneth Cells in Response to Notch Activation and Intestinal Injury.Cell Mol Gastroenterol Hepatol. 2019;7(3):533-554. doi: 10.1016/j.jcmgh.2018.11.004. Epub 2018 Nov 27. Cell Mol Gastroenterol Hepatol. 2019. PMID: 30827941 Free PMC article.
-
The disintegrin/metalloproteinase Adam10 is essential for epidermal integrity and Notch-mediated signaling.Development. 2011 Feb;138(3):495-505. doi: 10.1242/dev.055210. Development. 2011. PMID: 21205794 Free PMC article.
-
Cleavage of E-cadherin by ADAM10 mediates epithelial cell sorting downstream of EphB signalling.Nat Cell Biol. 2011 Jul 31;13(9):1100-7. doi: 10.1038/ncb2298. Nat Cell Biol. 2011. PMID: 21804545
-
Role of ADAM10 in intestinal crypt homeostasis and tumorigenesis.Biochim Biophys Acta Mol Cell Res. 2017 Nov;1864(11 Pt B):2228-2239. doi: 10.1016/j.bbamcr.2017.07.011. Epub 2017 Jul 22. Biochim Biophys Acta Mol Cell Res. 2017. PMID: 28739265 Free PMC article. Review.
-
The emergence of ADAM10 as a regulator of lymphocyte development and autoimmunity.Mol Immunol. 2011 Jun;48(11):1319-27. doi: 10.1016/j.molimm.2010.12.005. Epub 2011 Jan 13. Mol Immunol. 2011. PMID: 21236490 Free PMC article. Review.
Cited by
-
Blood and Intestine eQTLs from an Anti-TNF-Resistant Crohn's Disease Cohort Inform IBD Genetic Association Loci.Clin Transl Gastroenterol. 2016 Jun 23;7(6):e177. doi: 10.1038/ctg.2016.34. Clin Transl Gastroenterol. 2016. PMID: 27336838 Free PMC article.
-
Mist1 Expression Is Required for Paneth Cell Maturation.Cell Mol Gastroenterol Hepatol. 2019;8(4):549-560. doi: 10.1016/j.jcmgh.2019.07.003. Epub 2019 Jul 19. Cell Mol Gastroenterol Hepatol. 2019. PMID: 31330316 Free PMC article.
-
Pathways regulating intestinal stem cells and potential therapeutic targets for radiation enteropathy.Mol Biomed. 2024 Oct 10;5(1):46. doi: 10.1186/s43556-024-00211-0. Mol Biomed. 2024. PMID: 39388072 Free PMC article. Review.
-
The Act of Controlling Adult Stem Cell Dynamics: Insights from Animal Models.Biomolecules. 2021 Apr 30;11(5):667. doi: 10.3390/biom11050667. Biomolecules. 2021. PMID: 33946143 Free PMC article. Review.
-
Cell Adhesion Molecule CD166/ALCAM Functions Within the Crypt to Orchestrate Murine Intestinal Stem Cell Homeostasis.Cell Mol Gastroenterol Hepatol. 2017 Jan 25;3(3):389-409. doi: 10.1016/j.jcmgh.2016.12.010. eCollection 2017 May. Cell Mol Gastroenterol Hepatol. 2017. PMID: 28462380 Free PMC article.
References
Publication types
MeSH terms
Substances
Grants and funding
LinkOut - more resources
Full Text Sources
Other Literature Sources
Medical
Miscellaneous

