Conducting a microbiome study
- PMID: 25036628
- PMCID: PMC5074386
- DOI: 10.1016/j.cell.2014.06.037
Conducting a microbiome study
Abstract
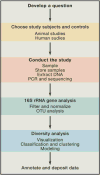
Human microbiome research is an actively developing area of inquiry, with ramifications for our lifestyles, our interactions with microbes, and how we treat disease. Advances depend on carefully executed, controlled, and reproducible studies. Here, we provide a Primer for researchers from diverse disciplines interested in conducting microbiome research. We discuss factors to be considered in the design, execution, and data analysis of microbiome studies. These recommendations should help researchers to enter and contribute to this rapidly developing field.
Copyright © 2014 Elsevier Inc. All rights reserved.
Figures


Similar articles
-
Culture of previously uncultured members of the human gut microbiota by culturomics.Nat Microbiol. 2016 Nov 7;1:16203. doi: 10.1038/nmicrobiol.2016.203. Nat Microbiol. 2016. PMID: 27819657
-
Mining the Factors Driving the Evolution of the Pit Mud Microbiome under the Impact of Long-Term Production of Strong-Flavor Baijiu.Appl Environ Microbiol. 2021 Aug 11;87(17):e0088521. doi: 10.1128/AEM.00885-21. Epub 2021 Aug 11. Appl Environ Microbiol. 2021. PMID: 34160281 Free PMC article.
-
Profiling the microbial community of a Triassic halite deposit in Northern Ireland: an environment with significant potential for biodiscovery.FEMS Microbiol Lett. 2019 Nov 1;366(22):fnz242. doi: 10.1093/femsle/fnz242. FEMS Microbiol Lett. 2019. PMID: 31778179
-
Detection of micro-organisms in the environment.Biochem Soc Trans. 1995 May;23(2):435-7. doi: 10.1042/bst0230435. Biochem Soc Trans. 1995. PMID: 7672437 Review. No abstract available.
-
Molecular characterization of the human microbiome from a reproductive perspective.Fertil Steril. 2015 Dec;104(6):1344-50. doi: 10.1016/j.fertnstert.2015.10.008. Epub 2015 Oct 23. Fertil Steril. 2015. PMID: 26602982 Review.
Cited by
-
Changes in the Firmicutes to Bacteriodetes ratio in the gut microbiome in individuals with anorexia nervosa following inpatient treatment: A systematic review and a case series.Brain Behav. 2024 Sep;14(9):e70014. doi: 10.1002/brb3.70014. Brain Behav. 2024. PMID: 39295072 Free PMC article.
-
Clearing the plate: a strategic approach to mitigate well-to-well contamination in large-scale microbiome studies.mSystems. 2024 Oct 22;9(10):e0098524. doi: 10.1128/msystems.00985-24. Epub 2024 Sep 16. mSystems. 2024. PMID: 39283083 Free PMC article.
-
Bacteria, Fungi, and Scalp Psoriasis: Understanding the Role of the Microbiome in Disease Severity.J Clin Med. 2024 Aug 16;13(16):4846. doi: 10.3390/jcm13164846. J Clin Med. 2024. PMID: 39200988 Free PMC article.
-
Gut microbiota influences onset of foraging-related behavior but not physiological hallmarks of division of labor in honeybees.mBio. 2024 Sep 11;15(9):e0103424. doi: 10.1128/mbio.01034-24. Epub 2024 Jul 29. mBio. 2024. PMID: 39072646 Free PMC article.
-
Gut microbiome changes associated with chronic pancreatitis and pancreatic cancer: a systematic review and meta-analysis.Int J Surg. 2024 Sep 1;110(9):5781-5794. doi: 10.1097/JS9.0000000000001724. Int J Surg. 2024. PMID: 38847785 Free PMC article.
References
-
- Abarenkov K, Henrik Nilsson R, Larsson KH, Alexander IJ, Eberhardt U, Erland S, Høiland K, Kjøller R, Larsson E, Pennanen T, et al. The UNITE database for molecular identification of fungi—recent updates and future perspectives. New Phytol. 2010;186:281–285. - PubMed
MeSH terms
Grants and funding
LinkOut - more resources
Full Text Sources
Other Literature Sources

