. 2014 Jul 16;34(29):9607-20.
doi: 10.1523/JNEUROSCI.3788-13.2014.

Enhancing astrocytic lysosome biogenesis facilitates Aβ clearance and attenuates amyloid plaque pathogenesis

Affiliations

Enhancing astrocytic lysosome biogenesis facilitates Aβ clearance and attenuates amyloid plaque pathogenesis

Qingli Xiao et al. J Neurosci. .

Abstract

In sporadic Alzheimer's disease (AD), impaired Aβ removal contributes to elevated extracellular Aβ levels that drive amyloid plaque pathogenesis. Extracellular proteolysis, export across the blood-brain barrier, and cellular uptake facilitate physiologic Aβ clearance. Astrocytes can take up and degrade Aβ, but it remains unclear whether this function is insufficient in AD or can be enhanced to accelerate Aβ removal. Additionally, age-related dysfunction of lysosomes, the major degradative organelles wherein Aβ localizes after uptake, has been implicated in amyloid plaque pathogenesis. We tested the hypothesis that enhancing lysosomal function in astrocytes with transcription factor EB (TFEB), a master regulator of lysosome biogenesis, would promote Aβ uptake and catabolism and attenuate plaque pathogenesis. Exogenous TFEB localized to the nucleus with transcriptional induction of lysosomal biogenesis and function in vitro. This resulted in significantly accelerated uptake of exogenously applied Aβ42, with increased localization to and degradation within lysosomes in C17.2 cells and primary astrocytes, indicating that TFEB is sufficient to coordinately enhance uptake, trafficking, and degradation of Aβ. Stereotactic injection of adeno-associated viral particles carrying TFEB driven by a glial fibrillary acidic protein promoter was used to achieve astrocyte-specific expression in the hippocampus of APP/PS1 transgenic mice. Exogenous TFEB localized to astrocyte nuclei and enhanced lysosome function, resulting in reduced Aβ levels and shortened half-life in the brain interstitial fluid and reduced amyloid plaque load in the hippocampus compared with control virus-injected mice. Therefore, activation of TFEB in astrocytes is an effective strategy to restore adequate Aβ removal and counter amyloid plaque pathogenesis in AD.

Keywords: Alzheimer's disease; TFEB; amyloid; astrocytes; lysosomes.


Figures

Figure 1.
Figure 1.
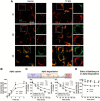
TFEB stimulates lysosome biogenesis and function. A, Representative confocal images demonstrating LysoTracker Red expression in Cerulean-tagged TFEB-transfected (Cer-TFEB) C17.2 cells versus empty vector transfected controls. Representative of n = 4 independent experiments. B, Representative confocal images demonstrating LAMP1 expression in C17.2 cells transfected with FLAG-tagged TFEB versus empty vector transfected controls. Representative of n = 4 experiments. C, Flow cytometric analysis of LysoTracker Red staining in cells transfected with FLAG-tagged TFEB or empty vector (V; as control), with quantification of mean fluorescence expressed as fold over control (inset). N = 3/group. D, E, Immunoblots (D) and quantification (E) of LAMP1 and Cathepsin B and D expression in cells transfected as in C. F, Cathepsin B and D activity in cells transfected as in C. N = 4/group; **p < 0.01.
Figure 2.
Figure 2.
TFEB enhances Aβ uptake and degradation in C17.2 cells. A, Representative confocal images of C17.2 cells transfected with TFEB or empty vector, and incubated with 500 nm FAM-Aβ42 at varying times, as indicated and imaged with LysoTracker Red colabeling. Representative of n = 3 independent experiments. B, C17.2 cells were transfected with TFEB or empty vector for 48 h, and subsequently incubated with Aβ42 (500 nm) for an additional 1–8 h, and intracellular Aβ42 was analyzed by ELISA at the time points indicated. N = 3/group per time point. C, C17.2 cells were transfected with TFEB or empty vector for 48 h and Aβ42 (500 nm) was applied for 4 h, followed by its removal. Cells were then thoroughly washed. At varying times after washing (as indicated), the cells were trypsinized, lysed, and intracellular Aβ42 was quantified by ELISA using two separate strategies. Specific antibodies used (refer to schematic, top) are noted (bottom). N = 3/group per time point. D, Cells treated as in C with the addition of Bafilomycin A1 (100 nm) for 30 min before washing out the Aβ and cultured in its presence until the cells were collected for assay. N = 4/group; *p < 0.05, **p < 0.01.
Figure 3.
Figure 3.
TFEB stimulates Aβ uptake and degradation in primary astrocytes. A, Percentage increase in Aβ uptake over a duration of 4 h in primary astrocytes transduced with TFEB over those transduced with GFP (as control), in the presence of Dynasore (100 μm), heparin (100 μg/ml; ∼18 U/ml), and vehicle (as control). N = 3 experiments. B, Transferrin uptake in primary astrocytes transduced with TFEB or GFP (as control). N = 3/group. Dy, Dynasore. C, Flow cytometric analysis with representative tracings (top) and quantitation of mean fluorescence (bottom) for 70 kDa dextran-TMR uptake in primary astrocytes transduced with TFEB or empty vector (as control) for the indicated duration. N = 4/group. D, Primary astrocytes were transduced with TFEB or GFP (as control) and incubated with Aβ for 4 h, followed by washing and trypsinization. Intracellular Aβ levels were measured thereafter at T (time) = 0 and 1 h. Inset shows percentage reduction in Aβ levels over this duration. N = 3 experiments. E, F, Immunoblot and quantitation of LAMP1, LRP1, and LDLR expression in TFEB- transduced versus GFP-transduced primary astrocytes. N = 3/group; *p < 0.05, **p < 0.01.
Figure 4.
Figure 4.
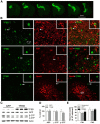
AAV8-mediated gene transfer of GFAP-promoter driven TFEB targets expression specifically to astrocytes. A, Representative fluorescence images of GFP expression in the hippocampus of APP/PS1 mice injected with AAV8-GFAP-eGFP viral particles. Sequential images of brain sections confirm high transduction efficiency throughout the anterior hippocampus. B, Representative confocal images demonstrating expression of TFEB (green) with GFAP (red, top), Iba-1 (red, middle), and NeuN (red, bottom) in the hippocampus of APP/PS1 mice injected with AAV8-GFAP-FLAG-TFEB particles, demonstrating astrocyte-specific expression of TFEB. The boxed inserts (upper right corner) demonstrate magnified images of individual TFEB-labeled cells (arrows). DG, dentate gyrus. C, D, Immunoblot and quantitation of APP, α-CTF, and β-CTF in AAV8-GFAP-FLAG-TFEB and AAV8-GFAP-eGFP transduced hippocampi. N = 3/group. E, Neuronal counts in the CA1 and CA3 layers of the hippocampi from AAV8-GFAP-FLAG-TFEB and AAV8-GFAP-eGFP transduced APP/PS1 mice and uninjected age- and sex-matched APP/PS1 mice as controls. N = 4/group.
Figure 5.
Figure 5.
AAV8-mediated astrocytic gene transfer of TFEB in astrocytes promotes lysosome biogenesis in APP/PS1 mice. A, Representative confocal images demonstrating expression of FLAG (green) and LAMP1 (red) in hippocampal tissues transduced with AAV8-GFAP-FLAG-TFEB (bottom) and AAV8-GFAP-eGFP (top) viral particles. Arrow indicates individual double-labeled cell shown under high magnification (insert, right upper corner). B, C, Immunoblots (B) with quantification (C) of lysosomal proteins in extracts from hippocampi transduced with AAV8-GFAP-FLAG-TFEB or AAV8-GFAP-eGFP. N = 3/group. D, Cathepsin B and D activity in extracts from hippocampi transduced with AAV8-GFAP-FLAG-TFEB or AAV8-GFAP-eGFP. N = 4/group; **p < 0.01.
Figure 6.
Figure 6.
AAV8-mediated astrocytic gene transfer of TFEB reduces brain ISF Aβ levels and reduces in vivo Aβ half-life. A, Assessment of Aβ levels by in vivo microdialysis in 3-month-old APP/PS1 mice transduced with AAV8-GFAP-FLAG-TFEB (TFEB) and AAV8-GFAP-eGFP (GFP) with serial hourly measurements. N = 5 mice/group. At t = 0, mice were continually administered Compound E directly to the hippocampus (200 nm, reverse microdialysis) followed by hourly sampling for Aβ. Mean absolute in vivo “exchangeable” Aβ (eAβx-40) concentration was averaged over a 9 h period before drug administration, and assessed to be 362.4 ± 49.0 pg/ml in TFEB-transduced mice versus 592.5 ± 46.9 pg/ml in controls. B, Semi-log plot of decline in percentage basal ISF Aβ levels during administration of Compound E, in animals in A. Half-life in control mice was 1.26 ± 0.11 h and 0.76 ± 0.06 h in TFEB-expressing mice. C, Quantification of averaged concentration and elimination half-life of ISF Aβ as calculated in A and B; **p < 0.01. D, E, Aβ40 and Aβ42 levels in dissected hippocampal tissues from AAV8-GFAP-FLAG-TFEB (TFEB) and AAV8-GFAP-eGFP (GFP) transduced APP/PS1 mice (5 months of age). Tissue was homogenized first in PBS (D) and then in RIPA (E) quantified with ELISA assay. HJ2 and HJ7.4 antibodies were used for capture Aβ40 and Aβ42, respectively, and HJ5.1 antibody was used for detection. N = 5 mice/group; *p < 0.05, **p < 0.01.
Figure 7.
Figure 7.
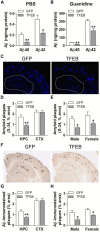
Astrocytic TFEB overexpression decreases amyloid plaque load in hippocampus of APP/PS1 mice. A, B, Aβ40 and Aβ42 levels in dissected hippocampal tissues from AAV8-GFAP-FLAG-TFEB (TFEB) and AAV8-GFAP-eGFP (GFP) transduced mice (10 months of age). Tissue was homogenized first in PBS (soluble levels, A), then in 5 mm guanidine (insoluble levels, B) quantified with ELISA assay. HJ2 and HJ7.4 antibodies were used for capture Aβ40 and Aβ42, respectively, and HJ5.1 antibody was used for detection. N = 8 mice/group; **p < 0.01. C, Representative X-34-stained images from APP/PS1 mice treated as in A. The area of the hippocampus is outlined with a dotted line. D, E, Quantification of X-34-stained plaque burden in the hippocampus in mice treated as in A (D) and plaque burden stratified by sex (E). N = 10 (5 male and 5 female) mice/group. F, Representative Aβ-immunostained images from mice treated as in A. G, H, Quantification of Aβ-stained plaque burden in the hippocampus in mice treated as in A (G) and plaque burden stratified by sex (H). N = 10 (5 male and 5 female) mice/group; *p < 0.05, **p < 0.01.

Similar articles

Cited by

References

    1. Avrahami L, Farfara D, Shaham-Kol M, Vassar R, Frenkel D, Eldar-Finkelman H. Inhibition of glycogen synthase kinase-3 ameliorates beta-amyloid pathology and restores lysosomal acidification and mammalian target of rapamycin activity in the Alzheimer disease mouse model: in vivo and in vitro studies. J Biol Chem. 2013;288:1295–1306. doi: 10.1074/jbc.M112.409250. - DOI - PMC - PubMed
    1. Baldo G, Wu S, Howe RA, Ramamoothy M, Knutsen RH, Fang J, Mecham RP, Liu Y, Wu X, Atkinson JP, Ponder KP. Pathogenesis of aortic dilatation in mucopolysaccharidosis VII mice may involve complement activation. Mol Genet Metab. 2011;104:608–619. doi: 10.1016/j.ymgme.2011.08.018. - DOI - PMC - PubMed
    1. Barres BA. The mystery and magic of glia: a perspective on their roles in health and disease. Neuron. 2008;60:430–440. doi: 10.1016/j.neuron.2008.10.013. - DOI - PubMed
    1. Basak JM, Verghese PB, Yoon H, Kim J, Holtzman DM. Low-density lipoprotein receptor represents an apolipoprotein E-independent pathway of Abeta uptake and degradation by astrocytes. J Biol Chem. 2012;287:13959–13971. doi: 10.1074/jbc.M111.288746. - DOI - PMC - PubMed
    1. Bateman RJ, Munsell LY, Morris JC, Swarm R, Yarasheski KE, Holtzman DM. Human amyloid-beta synthesis and clearance rates as measured in CSF in vivo. Nat Med. 2006;12:856–861. doi: 10.1038/nm1438. - DOI - PMC - PubMed

Publication types

MeSH terms

Substances