

A20 deficiency causes spontaneous neuroinflammation in mice
- PMID: 25026958
- PMCID: PMC4128606
- DOI: 10.1186/1742-2094-11-122
A20 deficiency causes spontaneous neuroinflammation in mice
Abstract
Background: A20 (TNFAIP3) is a pleiotropic NFκB-dependent gene that terminates NFκB activation in response to inflammatory stimuli. The potent anti-inflammatory properties of A20 are well characterized in several organs. However, little is known about its role in the brain. In this study, we investigated the brain phenotype of A20 heterozygous (HT) and knockout (KO) mice.
Methods: The inflammatory status of A20 wild type (WT), HT and KO brain was determined by immunostaining, quantitative PCR, and Western blot analysis. Cytokines secretion was evaluated by ELISA. Quantitative results were statistically analyzed by ANOVA followed by a post-hoc test.
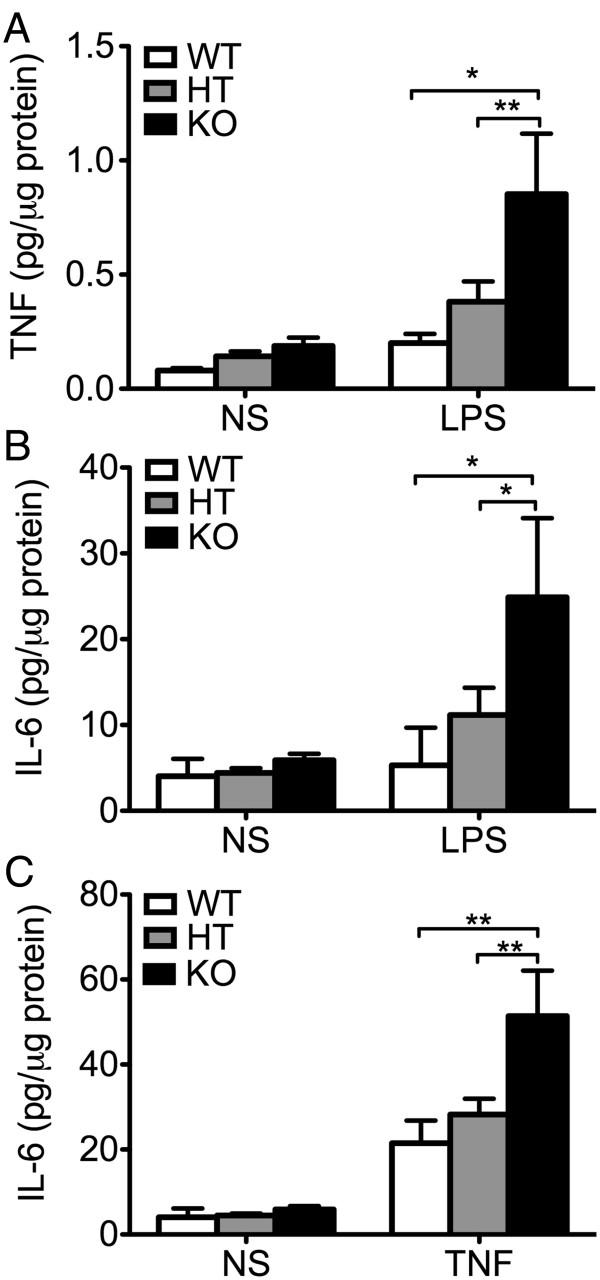
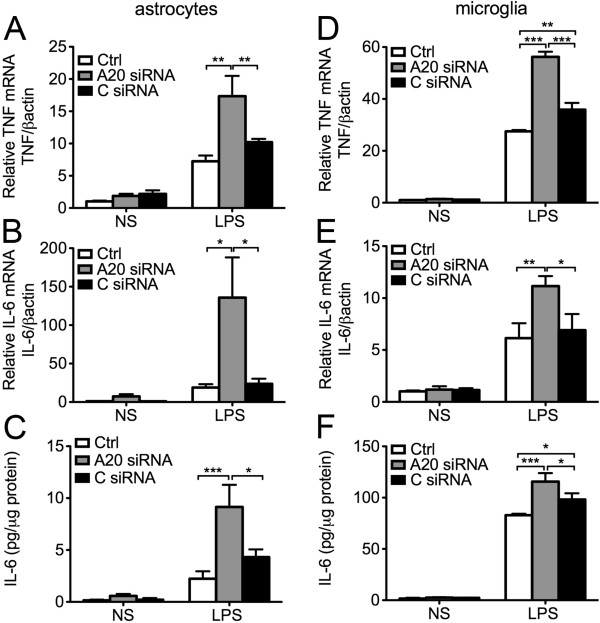
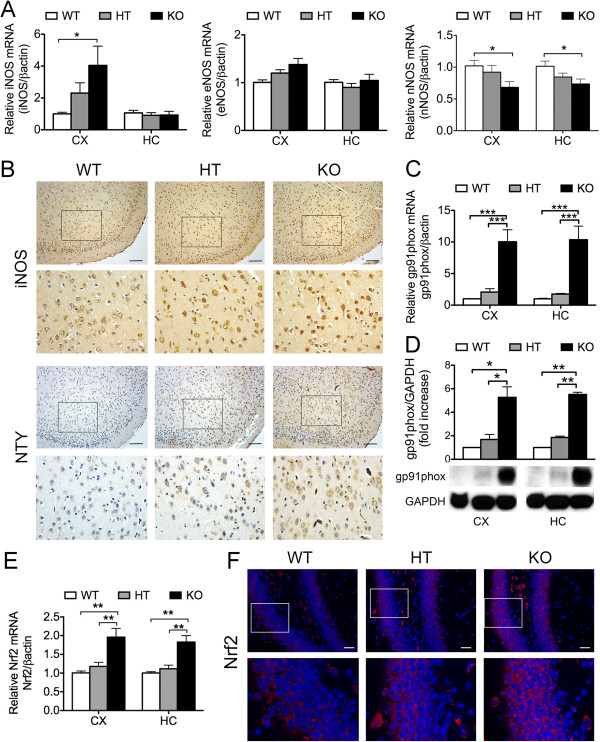
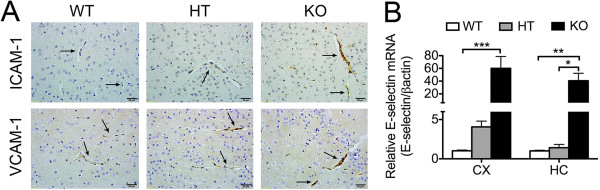
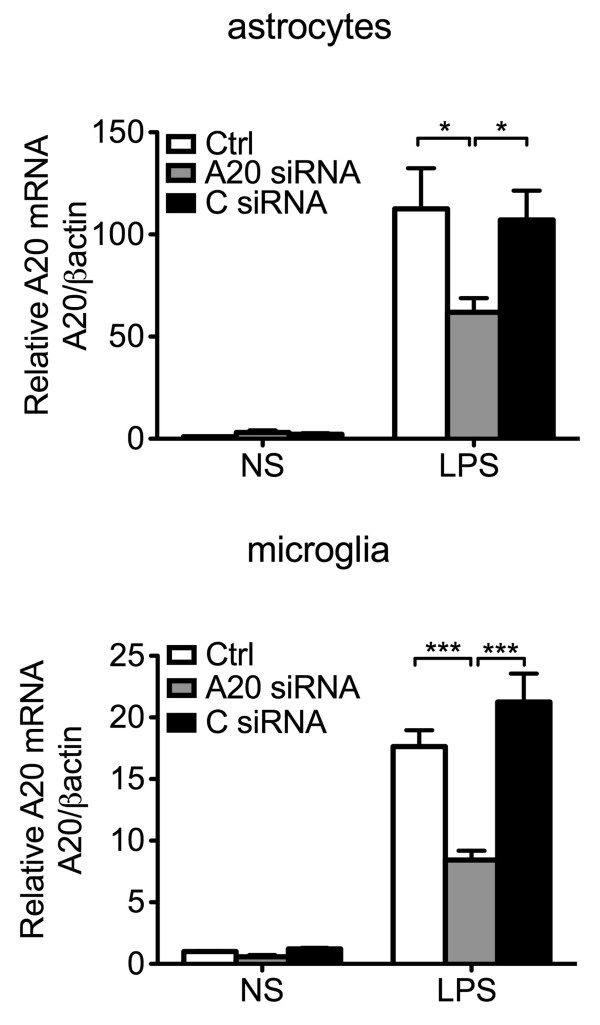
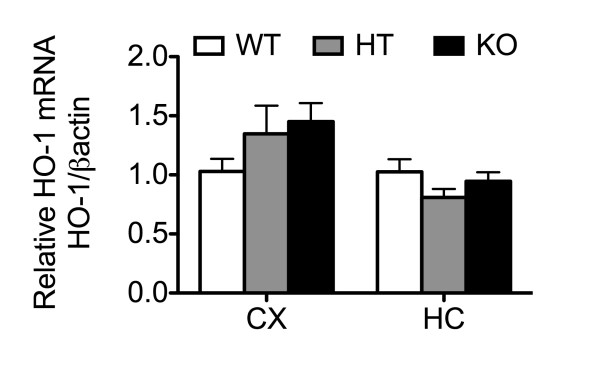
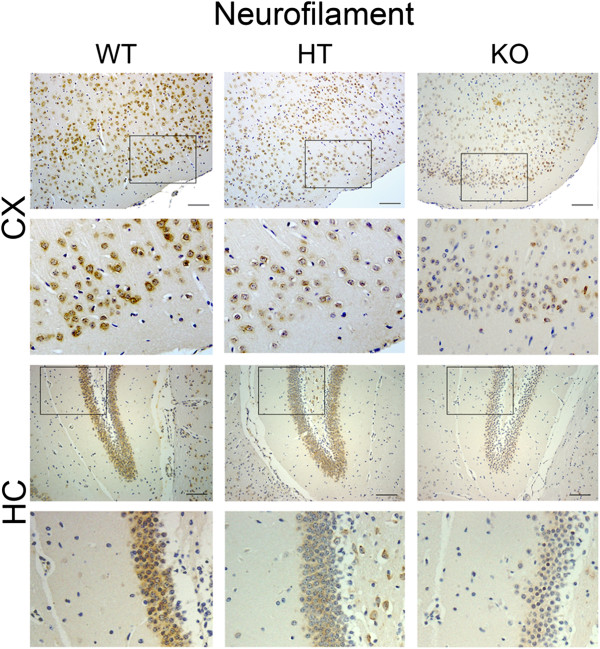
Results: Total loss of A20 caused remarkable reactive microgliosis and astrogliosis, as determined by F4/80 and GFAP immunostaining. Glial activation correlated with significantly higher mRNA and protein levels of the pro-inflammatory molecules TNF, IL-6, and MCP-1 in cerebral cortex and hippocampus of A20 KO, as compared to WT. Basal and TNF/LPS-induced cytokine production was significantly higher in A20 deficient mouse primary astrocytes and in a mouse microglia cell line. Brain endothelium of A20 KO mice demonstrated baseline activation as shown by increased vascular immunostaining for ICAM-1 and VCAM-1, and mRNA levels of E-selectin. In addition, total loss of A20 increased basal brain oxidative/nitrosative stress, as indicated by higher iNOS and NADPH oxidase subunit gp91phox levels, correlating with increased protein nitration, gauged by nitrotyrosine immunostaining. Notably, we also observed lower neurofilaments immunostaining in A20 KO brains, suggesting higher susceptibility to axonal injury. Importantly, A20 HT brains showed an intermediate phenotype, exhibiting considerable, albeit not statistically significant, increase in markers of basal inflammation when compared to WT.
Conclusions: This is the first characterization of spontaneous neuroinflammation caused by total or partial loss of A20, suggesting its key role in maintenance of nervous tissue homeostasis, particularly control of inflammation. Remarkably, mere partial loss of A20 was sufficient to cause chronic, spontaneous low-grade cerebral inflammation, which could sensitize these animals to neurodegenerative diseases. These findings carry strong clinical relevance in that they question implication of identified A20 SNPs that lower A20 expression/function (phenocopying A20 HT mice) in the pathophysiology of neuroinflammatory diseases.
Figures

Similar articles
-
Significant lethality following liver resection in A20 heterozygous knockout mice uncovers a key role for A20 in liver regeneration.Cell Death Differ. 2015 Dec;22(12):2068-77. doi: 10.1038/cdd.2015.52. Epub 2015 May 15. Cell Death Differ. 2015. PMID: 25976305 Free PMC article.
-
Tollip, an early regulator of the acute inflammatory response in the substantia nigra.J Neuroinflammation. 2016 Dec 7;13(1):303. doi: 10.1186/s12974-016-0766-5. J Neuroinflammation. 2016. PMID: 27927222 Free PMC article.
-
Micheliolide suppresses LPS-induced neuroinflammatory responses.PLoS One. 2017 Oct 17;12(10):e0186592. doi: 10.1371/journal.pone.0186592. eCollection 2017. PLoS One. 2017. PMID: 29040306 Free PMC article.
-
Single nucleotide polymorphisms at the TNFAIP3/A20 locus and susceptibility/resistance to inflammatory and autoimmune diseases.Adv Exp Med Biol. 2014;809:163-83. doi: 10.1007/978-1-4939-0398-6_10. Adv Exp Med Biol. 2014. PMID: 25302371 Review.
-
Pharmacological modulation of cytokines correlating neuroinflammatory cascades in epileptogenesis.Mol Biol Rep. 2022 Feb;49(2):1437-1452. doi: 10.1007/s11033-021-06896-8. Epub 2021 Nov 9. Mol Biol Rep. 2022. PMID: 34751915 Review.
Cited by
-
A20/TNFAIP3 Increases ENOS Expression in an ERK5/KLF2-Dependent Manner to Support Endothelial Cell Health in the Face of Inflammation.Front Cardiovasc Med. 2021 May 7;8:651230. doi: 10.3389/fcvm.2021.651230. eCollection 2021. Front Cardiovasc Med. 2021. PMID: 34026871 Free PMC article.
-
Silencing of A20 Aggravates Neuronal Death and Inflammation After Traumatic Brain Injury: A Potential Trigger of Necroptosis.Front Mol Neurosci. 2019 Sep 19;12:222. doi: 10.3389/fnmol.2019.00222. eCollection 2019. Front Mol Neurosci. 2019. PMID: 31607859 Free PMC article.
-
Overexpression of the ubiquitin-editing enzyme A20 in the brain lesions of Multiple Sclerosis patients: moving from systemic to central nervous system inflammation.Brain Pathol. 2021 Mar;31(2):283-296. doi: 10.1111/bpa.12906. Epub 2020 Nov 18. Brain Pathol. 2021. PMID: 33051914 Free PMC article.
-
Involvement of Ubiquitin-Editing Protein A20 in Modulating Inflammation in Rat Cochlea Associated with Silver Nanoparticle-Induced CD68 Upregulation and TLR4 Activation.Nanoscale Res Lett. 2016 Dec;11(1):240. doi: 10.1186/s11671-016-1430-9. Epub 2016 May 4. Nanoscale Res Lett. 2016. PMID: 27142878 Free PMC article.
-
The ubiquitin-editing enzyme A20 regulates synapse remodeling and efficacy.Brain Res. 2020 Jan 15;1727:146569. doi: 10.1016/j.brainres.2019.146569. Epub 2019 Nov 26. Brain Res. 2020. PMID: 31783001 Free PMC article.
References
-
- Unger JW. Glial reaction in aging and Alzheimer’s disease. Microsc Res Tech. 1998;43:24–28. - PubMed
-
- Sawada M, Imamura K, Nagatsu T. Role of cytokines in inflammatory process in Parkinson’s disease. J Neural Transm Suppl. 2006;70:373–381. - PubMed
-
- Noseworthy JH, Lucchinetti C, Rodriguez M, Weinshenker BG. Multiple sclerosis. N Engl J Med. 2000;343:938–952. - PubMed
Publication types
MeSH terms
Substances
Grants and funding
LinkOut - more resources
Full Text Sources
Other Literature Sources
Medical
Research Materials
Miscellaneous
