. 2014 Jul 11:15:583.
doi: 10.1186/1471-2164-15-583.

Transcriptional landscape of repetitive elements in normal and cancer human cells

Affiliations

Transcriptional landscape of repetitive elements in normal and cancer human cells

Steven W Criscione et al. BMC Genomics. .

Abstract

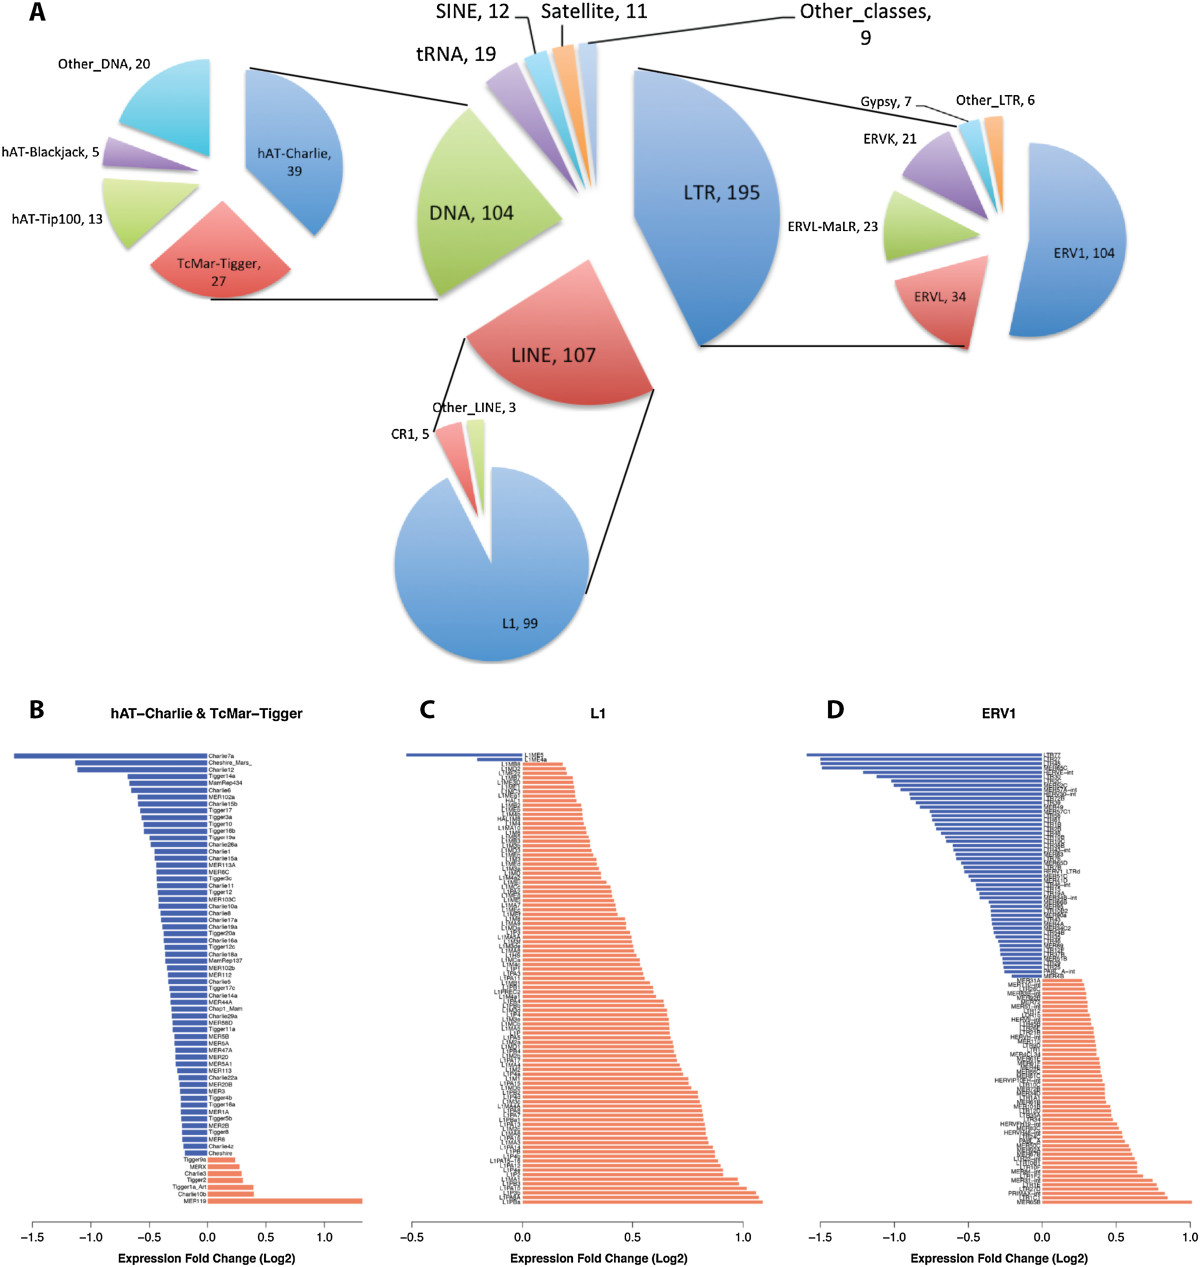
Background: Repetitive elements comprise at least 55% of the human genome with more recent estimates as high as two-thirds. Most of these elements are retrotransposons, DNA sequences that can insert copies of themselves into new genomic locations by a "copy and paste" mechanism. These mobile genetic elements play important roles in shaping genomes during evolution, and have been implicated in the etiology of many human diseases. Despite their abundance and diversity, few studies investigated the regulation of endogenous retrotransposons at the genome-wide scale, primarily because of the technical difficulties of uniquely mapping high-throughput sequencing reads to repetitive DNA.

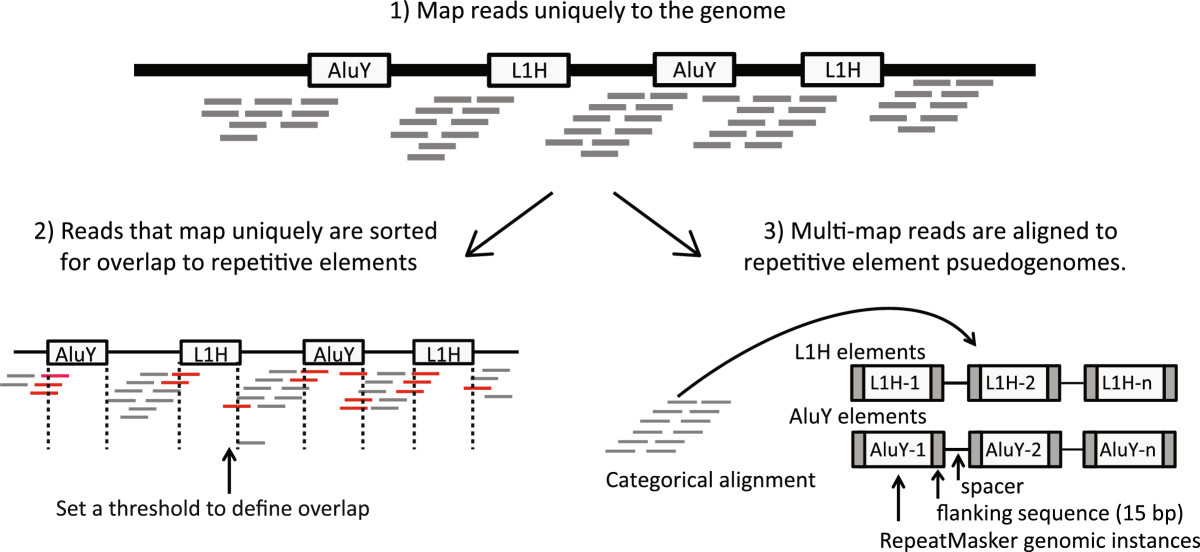
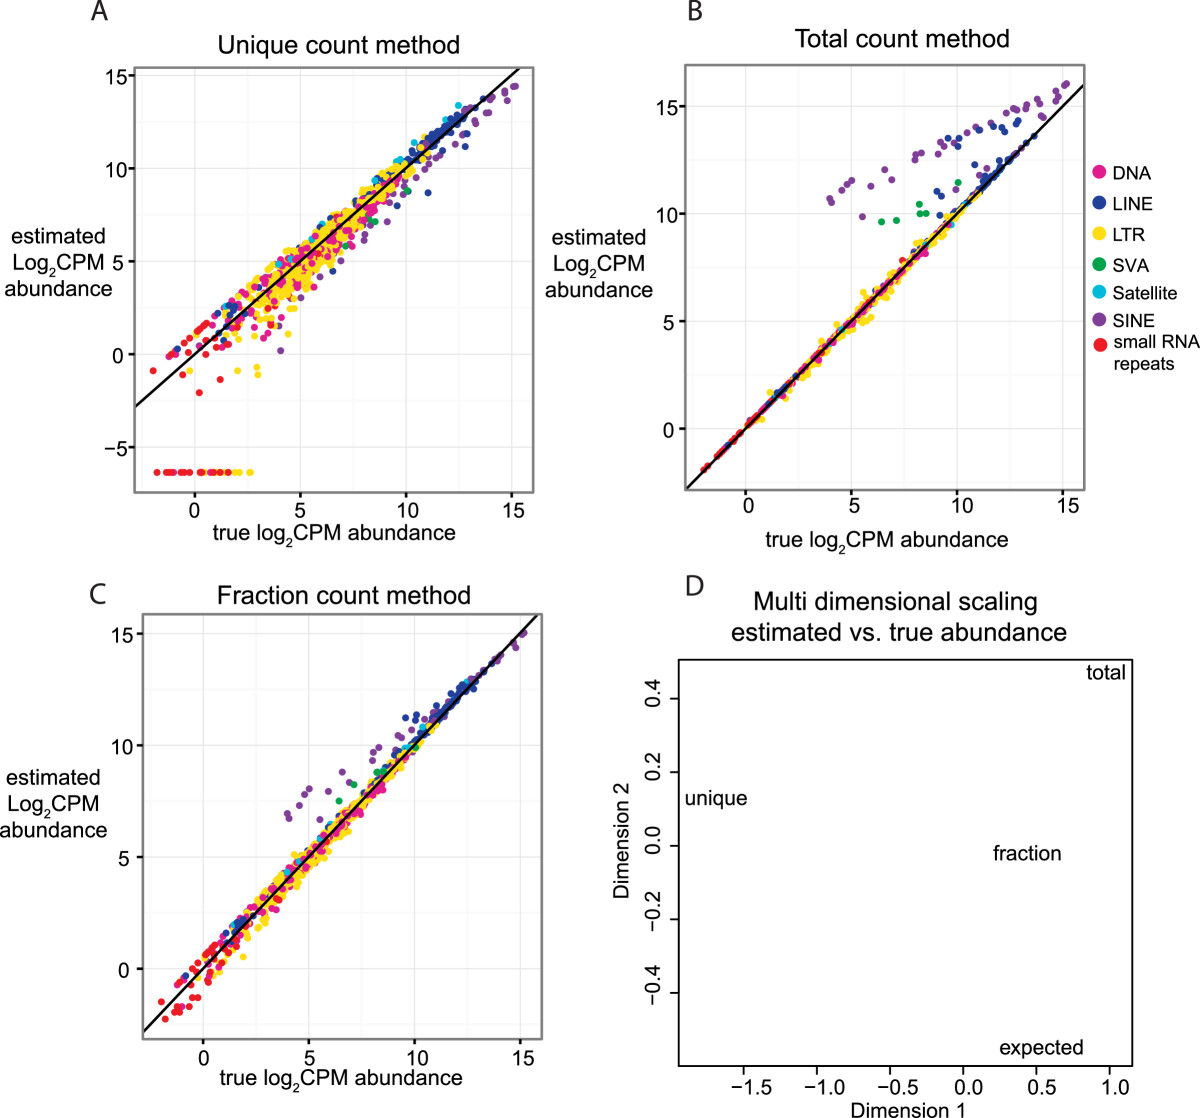
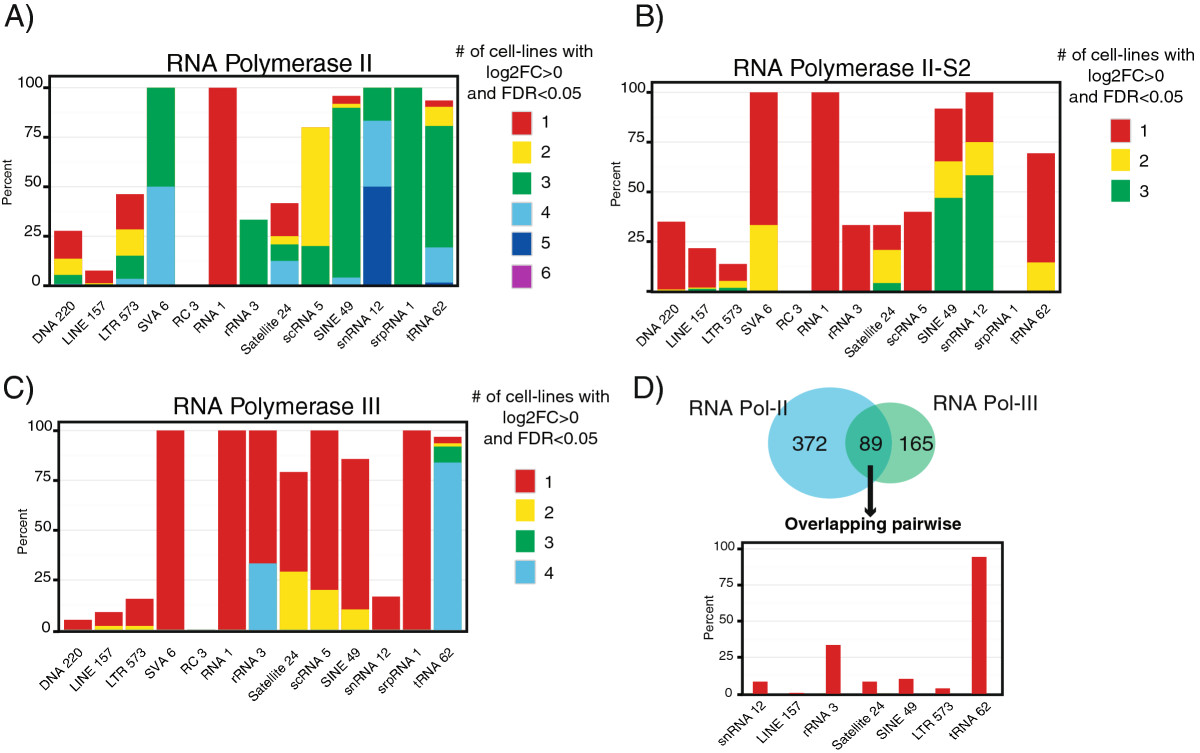
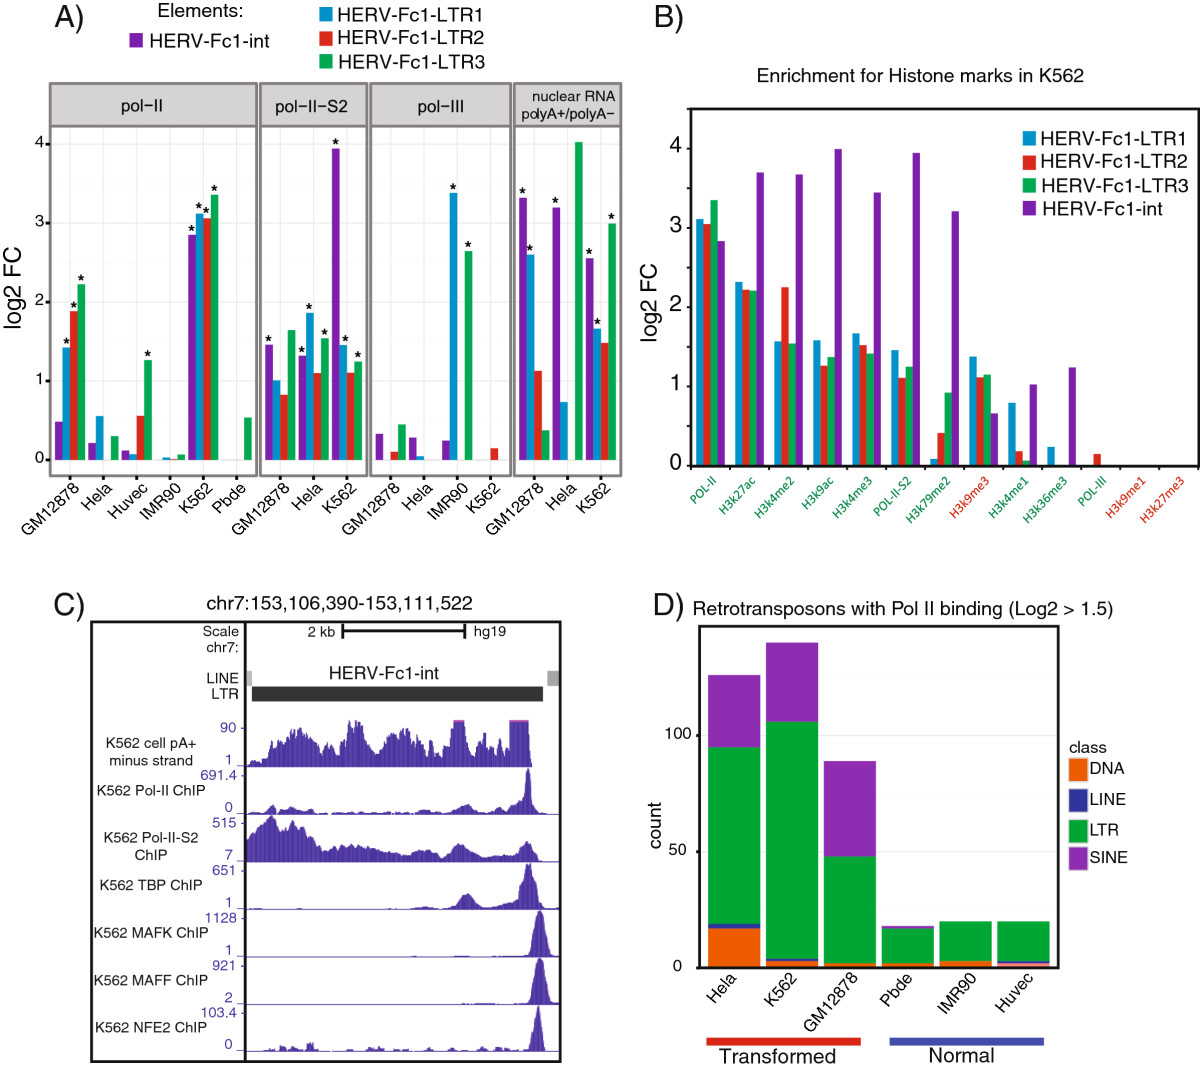
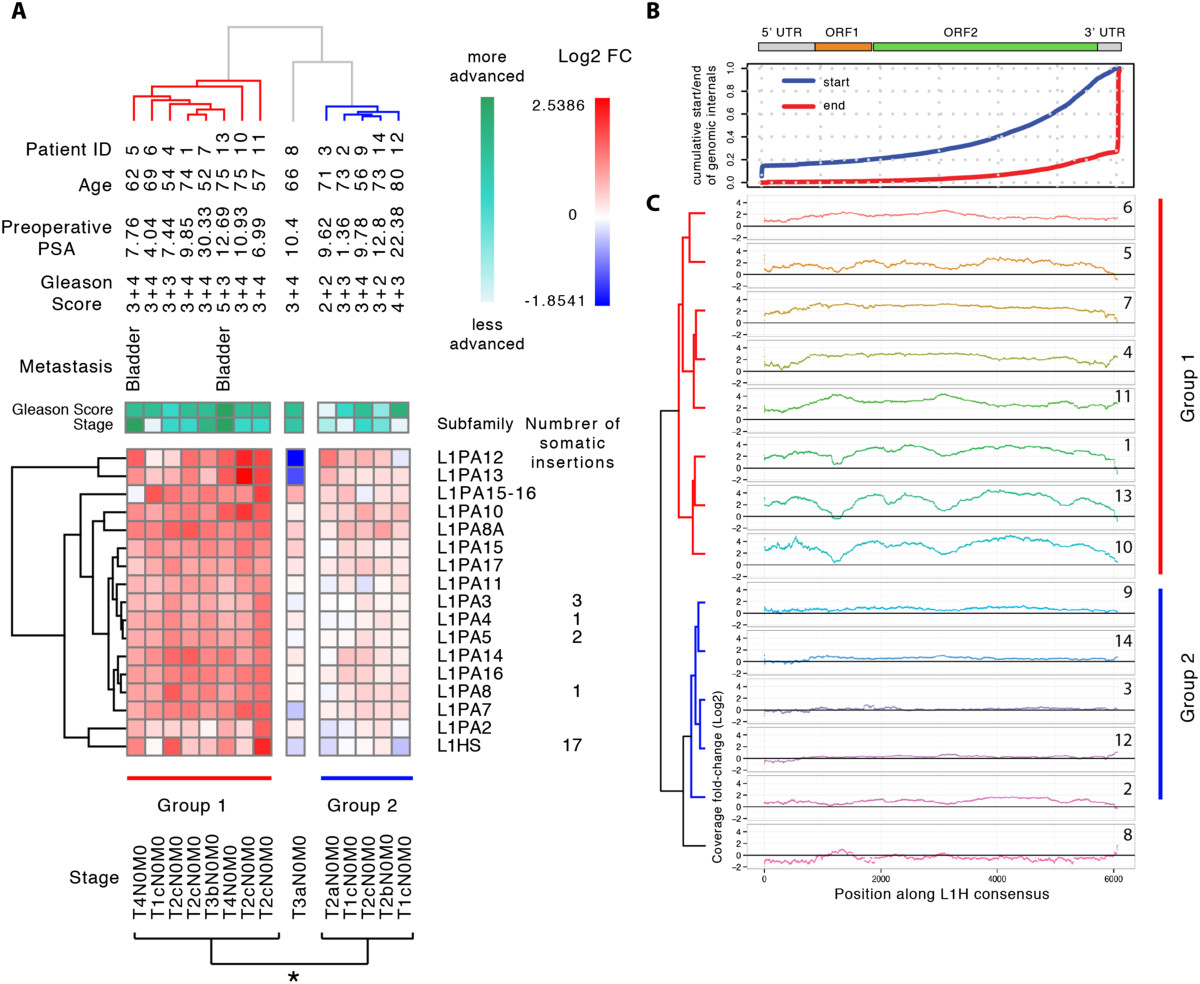
Results: Here we develop a new computational method called RepEnrich to study genome-wide transcriptional regulation of repetitive elements. We show that many of the Long Terminal Repeat retrotransposons in humans are transcriptionally active in a cell line-specific manner. Cancer cell lines display increased RNA Polymerase II binding to retrotransposons than cell lines derived from normal tissue. Consistent with increased transcriptional activity of retrotransposons in cancer cells we found significantly higher levels of L1 retrotransposon RNA expression in prostate tumors compared to normal-matched controls.

Conclusions: Our results support increased transcription of retrotransposons in transformed cells, which may explain the somatic retrotransposition events recently reported in several types of cancers.


Figures

Figure 1
Figure 1
RepEnrich read mapping strategy. Reads are mapped to the genome using the Bowtie1 aligner. Reads mapping uniquely to the genome are assigned to subfamilies of repetitive elements based on their degree of overlap to RepeatMasker annotated genomic instances of each repetitive element subfamily. Reads mapping to multiple locations are separately mapped to repetitive element assemblies – referred to as repetitive element psuedogenomes – built from RepeatMasker annotated genomic instances of repetitive element subfamilies.
Figure 2
Figure 2
Performance comparison of counting strategies on simulated L1-enriched data. Three replicates of ChIP-seq (50 bp single-end reads) data enrichment at L1 elements on chromosome 19 were simulated using the hidden Markov model (HMM) in Additional file 1: Figure S2. The expected average log2CPM for the simulation was computed using the repetitive element counts computed from the true read coordinates. The average log2CPM read abundances, computed by EdgeR from RepEnrich estimated count values using total, unique, and fractional count methods were compared to the expected true abundance. The solid line indicates y = x, values falling on the line are identical between the estimated average log2CPM and expected average log2CPM. The repetitive element subfamilies are colored according to class with small RNA repeats including scRNA, rRNA, snRNA, and tRNA classes. A) Comparison of the estimated abundance from the unique count method, which only sums reads that can be assigned uniquely to a single subfamily of repetitive elements, versus the true abundance. B) Comparison of the estimated abundance from the total count method, which sums the reads assigned to each repetitive element subfamily and allows for multiple counting of reads, versus the true abundance. C) Comparison of the estimated abundance from the fractional count method, which sums the reads that fall into each individual repetitive element subfamily once, but adds a fraction for reads mapping to more than one subfamily (1/# of repetitive element sub-families aligned), versus the true abundance. D) Multidimensional scaling (MDS) plot of the Euclidean distances between the average log2CPM values for the unique, total, and fractional count estimates of RepEnrich and the expected average log2CPM values. The fractional count average log2CPM estimate was closest to the true abundance.
Figure 3
Figure 3
RNA polymerase binding patterns to repetitive elements. A) RNA Pol II, B) active RNA Pol II S2, and C) RNA Pol III were assessed for binding to repetitive elements using generalized linear model (GLM) comparisons of ChIP versus input. To view the binding patterns we examined percent of repetitive element sub-families for the major classes of repetitive elements that displayed significant (FDR <0.05) positive enrichment (Log2FC >0). The color-coding corresponds to the number of cell lines that displayed the significant positive enrichment. The x-axis labels the class of repetitive element and the adjacent number indicates how many repetitive element sub-families fall within that class. D) The repetitive elements that displayed significant (FDR <0.05) positive enrichment (Log2FC >0) for RNA Pol II and RNA Pol III were compared for overlap across the same cell line. The 89 repetitive elements that displayed co-enrichment within the same cell line for RNA Pol II and RNA Pol III were then examined for representation of the major classes of repetitive elements, expressed as a percent.
Figure 4
Figure 4
HERV-Fc1 and Pol II binding in transformed vs. normal cell lines. LTR and other transposable elements displayed differences in RNA Pol II binding in transformed versus normal cell lines. A ) The LTR subfamily HERV-FC1 displayed cell line specific transcriptional profiles for the LTRs (LTR1-3) or internal region (int) of HERV-FC1. The GLM results are plotted as log2FCs for Pol II enrichment and differential RNA-seq analysis. The differential RNA-seq analysis compares the PolyA + vs. PolyA – enrichment of Nuclear RNA (positive log2FC values indicates PolyA + enrichment). B ) The enrichment of ChIP compared to input for RNA Pol II, active RNA Pol II-S2, active marks of transcription (H3K27ac, H3K4me2, H3K9ac, H3K4me3, H3K79me2, H3K4me1, H3K36me2) and repressed heterochromatin (H3K9me1, H3K9me3, H3K27me3) for the LTRs (LTR1-3) or internal region (int) of HERV-FC1. C ) Genome browser view of the primary locus of HERV-FC1-int contributing to expression in the K562 cell line. The ENCODE signal tracks for K562 cell PolyA + RNA (minus strand), RNA Pol II ChIP, RNA Pol II-S2 ChIP, TBP ChIP, MAFK ChIP, MAFF ChIP, and NFE2 ChIP were visualized on chr7. All other cell lines for which there was cell PolyA + RNA available displayed minimal signal at this locus. D ) The count of transposable elements displaying modest positive enrichment, log2FC >1.5, in transformed versus normal cell lines. The counts are colored by the class of transposable element.
Figure 5
Figure 5
Repetitive elements differentially expressed in prostate cancer tissue. ( A ) Classes and families of repetitive elements differentially expressed in prostate cancer tumor tissue versus normal tissue. The number next to each class and family name corresponds to the number of differentially expressed subfamilies (FDR < 0.05). ( B - D ) Expression fold-change between prostate cancer tumor tissue and normal tissue computed by the GLM on the 14 patients. The most represented family of DNA, LINE and LTR elements are shown.
Figure 6
Figure 6
Primate-specific L1 elements are overexpressed in a subclass of patients with more advanced tumor progression. (A) Clustering of log2 expression fold-changes in the subset of primate specific L1s that showed significant differential expression reveals two major classes of patients (Group 1 and Group 2). Group 1 shows widespread overexpression of primate specific L1s and contains patients with more advanced tumor progression. The number of somatic insertions refers to the number of previously reported somatic retrotransposition events for that L1 subfamily identified in prostate cancer [26]. (B) All L1 sequences in the human genome were fetched and mapped to L1Hs consensus using permissive, local alignment parameters to analyze data. Using this distribution we computed the cumulative distribution of start and end positions of genomic L1s with respect to the consensus to describe the background distribution of L1s that can potentially map to the consensus element. (C) Coverage of L1 sequences in prostate tumor versus normal RNA-seq that map to L1Hs consensus using a local alignment (Bowtie2). The log2FC was computed for each position along the L1Hs consensus from tumor and normal-matched RNA-seq coverage. Hierarchical clustering was done based on the log2FC using Euclidean metrics.

Similar articles

Cited by

References

    1. Lander ES, Linton LM, Birren B, Nusbaum C, Zody MC, Baldwin J, Devon K, Dewar K, Doyle M, FitzHugh W, Funke R, Gage D, Harris K, Heaford A, Howland J, Kann L, Lehoczky J, LeVine R, McEwan P, McKernan K, Meldrim J, Mesirov JP, Miranda C, Morris W, Naylor J, Raymond C, Rosetti M, Santos R, Sheridan A, Sougnez C, et al. Initial sequencing and analysis of the human genome. Nature. 2001;409(6822):860–921. doi: 10.1038/35057062. - DOI - PubMed
    1. De Koning APJ, Gu W, Castoe TA, Batzer MA, Pollock DD. Repetitive elements may comprise over two-thirds of the human genome. PLoS Genet. 2011;7(12):e1002384. doi: 10.1371/journal.pgen.1002384. - DOI - PMC - PubMed
    1. Levin HL, Moran JV. Dynamic interactions between transposable elements and their hosts. Nat Rev Genet. 2011;12(9):615–627. doi: 10.1038/nrg3030. - DOI - PMC - PubMed
    1. Hancks DC, Kazazian HH. Active human retrotransposons: variation and disease. Curr Opin Genet Dev. 2012;22(3):191–203. doi: 10.1016/j.gde.2012.02.006. - DOI - PMC - PubMed
    1. Cordaux R, Batzer MA. The impact of retrotransposons on human genome evolution. Nat Rev Genet. 2009;10(10):691–703. doi: 10.1038/nrg2640. - DOI - PMC - PubMed

Publication types

Associated data