. 2014 Aug;15(8):777-88.
doi: 10.1038/ni.2937. Epub 2014 Jul 6.

Epigenomic analysis of primary human T cells reveals enhancers associated with TH2 memory cell differentiation and asthma susceptibility

Affiliations

Epigenomic analysis of primary human T cells reveals enhancers associated with TH2 memory cell differentiation and asthma susceptibility

Grégory Seumois et al. Nat Immunol. 2014 Aug.

Abstract

A characteristic feature of asthma is the aberrant accumulation, differentiation or function of memory CD4(+) T cells that produce type 2 cytokines (TH2 cells). By mapping genome-wide histone modification profiles for subsets of T cells isolated from peripheral blood of healthy and asthmatic individuals, we identified enhancers with known and potential roles in the normal differentiation of human TH1 cells and TH2 cells. We discovered disease-specific enhancers in T cells that differ between healthy and asthmatic individuals. Enhancers that gained the histone H3 Lys4 dimethyl (H3K4me2) mark during TH2 cell development showed the highest enrichment for asthma-associated single nucleotide polymorphisms (SNPs), which supported a pathogenic role for TH2 cells in asthma. In silico analysis of cell-specific enhancers revealed transcription factors, microRNAs and genes potentially linked to human TH2 cell differentiation. Our results establish the feasibility and utility of enhancer profiling in well-defined populations of specialized cell types involved in disease pathogenesis.


Figures
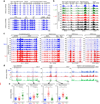
Figure 1
Figure 1
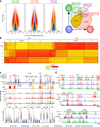
Reproducibility, microscaling and sensitivity of the H3K4me2 ChIP-seq assay. (a) Standard ChIP-seq assays (2 × 10⁶ cells; six replicates) showing H3K4me2 enrichment patterns of the gene loci (top) in D10 cells. (b) Standard ChIP-seq assay (2 × 10⁶ cells) and micro-scaled ChIP-seq assay (105, 104 and 103 cell samples; 3–4 replicates) showing H3K4me2 enrichment patterns in D10 cells. (c) ChIP-seq analysis showing H3K4me2 enrichment patterns, for control regions STIM1, NUP98, SELP and SELL loci, nonexpressed SELE locus, and TH2 cell–type specific CCR4 and CCR6 loci, in the naive cells and TH2 cells of six healthy subjects. Significant H3K4me2 enrichment (exact test for negative binomial distribution, using edgeR integrated in Bioconductor package MEDIPS) across distal cis-regulatory elements and promoters in these loci are highlighted by purple and blue dashed-line boxes, respectively. (d) ChIP-seq analysis showing cell-specific H3K4me2 enrichment patterns, for CCL5 (TH1 cell–specific), CCR4 (TH2 cell–specific) and control region YWHAZ (no change), in naive, TH1 cells and TH2 cells. For each cell type, data were merged from all donors, including assay duplicates. (e) H3K4me2 enrichment values for a specific 500-bp window (highlighted in purple dashed line boxes in d). Each dot represents data from a single assay; error bars indicate mean ± s.e.m. *P < 1 × 10⁻⁶, exact test for negative binomial distribution (using edgeR integrated in Bioconductor package MEDIPS).
Figure 2
Figure 2
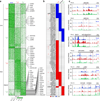
Changes in enhancer strength among TH cell subsets. (a) ‘Minus-average’ (MA) plots for genomic regions with differences in H3K4me2 enrichment (DERs) for pairwise comparisons of indicated cell types; total numbers of DERs identified are listed (left; red and orange dots indicate windows with an adjusted P < 0.05 and raw P < 0.005, respectively; exact test for negative binomial distribution, using edgeR integrated in Bioconductor package MEDIPS). Overlap among the DERs identified for each pairwise comparison (right; Supplementary Table 3). (b) Z-scores of normalized read counts for each unique enhancer DER (columns) obtained from any of the three pairwise comparisons of naive, TH2 and TH1 cells; data are shown from each independent ChIP-seq assay (n = 120 total assays) (rows). (c) H3K4me2 enrichment tracks for each cell type were merged from all assays and illustrated along with location of mouse DNase I hypersensitivity sites (HS) and locus control regions (LCR) (red arrows), IL13 and IL4 promoter (IL13 p and IL4 p; blue arrows), University of California Santa Cruz (UCSC) multispecies conservation tracks, human TH2 cell cytokine locus and cell type–specific enhancer DERs. H3K4me2 enrichment values for specific 500-bp windows (red dashed-line boxes) are shown below. Each dot represents data from a single assay; error bars indicate mean ± s.e.m. (d) Tracks similar to those in c, for IFNG, GATA3 and TBX21. Enhancer DERs that overlap evolutionarily conserved and putative human-specific enhancers are highlighted by red and blue dashed-line boxes, respectively.
Figure 3
Figure 3
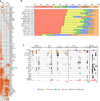
Genes and pathways linked to differentiation of CD4+ memory cells. (a) Z-scores of normalized read counts for each unique promoter-localized DER (rows) obtained from any of the three pairwise comparisons of naive, TH2 and TH1 cells; to illustrate samples that are above or below the average across all samples per window (row), a two-color scale (see key) was used for Z-scores; data are from each independent ChIP-seq assay (n = 120) (columns). Promoter-localized DERs were classified into six groups based on gain or loss of H3K4me2 enrichment during differentiation of naive T cells into the TH2 cells or TH1 cells (Supplementary Table 3); in each group, the promoter-localized DERs were arranged by their chromosomal location (from the start of chromosome 1 to the end of chromosome Y); ‘shared’ denotes ‘shared memory enhancers’ that displayed equivalent H3K4me2 gain or loss in both TH2 cells and TH1 cells when compared to naive cells. Target genes of some promoter-localized DERs are shown to the right. (b) miRNAs that showed the strongest gain or loss of H3K4me2 enrichment in their promoter regions for the various DER subgroups. (c) miRNAs for which the H3K4me2 enrichment tracks for each cell type are shown, for indicated miRNAs (* in b). Purple dashed-line boxes indicate the promoter regions (TSS ± 1 kb) for each miRNA.
Figure 4
Figure 4
Upstream regulators of TH2 cell genes. Induced gene-regulatory network analysis (performed using version 27 software from the ConsensusPathDB interaction database; Online Methods) of genes in the TH2 cell gain category (listed in Supplementary Table 4) shows that MYC, E2F2, E2F4 are key upstream regulators of this subgroup of genes.
Figure 5
Figure 5
Enrichment of transcription factor binding motifs and sites in enhancers linked to CD4 memory differentiation. (a) Heat map shows known transcription factor (TF) binding motifs that were significantly enriched in each DER subgroup (analysis performed using HOMER accessing its motif database; Online Methods and Supplementary Note). Motifs with P ≤ 1.00 × 10⁻³ and ratio of target sequences with motif versus background sequences with motif >1.1 were defined as significantly enriched (Supplementary Table 9). (b) Selected TFs (independent analysis performed for 161 TFs profiled by the ENCODE project and 18 other CD4+ T cell–related TFs, Online Methods) that showed significant enrichment of their binding sites at genomic locations of cell-specific enhancers in the TH2 cell gain subgroup (Supplementary Table 10). Shown are percentage of binding sites that overlap different cell-specific enhancer DER subgroups, the absolute number of binding sites that overlap all DERs and their percentage of the total genome-wide binding sites (in parentheses next to the name). Also shown is an example of a TF (SUZ12) whose binding sites are depleted in TH2 cell gain DERs (last row). (c) ChIP-seq peak tracks (black bars) of transcription factors (TH2 cell gain category) for human TH2 cell cytokine locus (IL4, IL13 and RAD50), IL12A and NF2L2 (encoding NRF2) along with UCSC gene tracks (top), multispecies gene conservation tracks (dark blue tracks), cell type–specific enhancer DERs and H3K27Ac track from ENCODE.
Figure 6
Figure 6
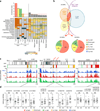
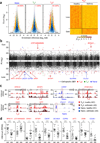
Asthma GWAS SNPs are enriched in TH2 cell enhancers. (a) Enrichment values of asthma GWAS SNPs in TH cell enhancer subgroups (Fig. 2b) and other cell tissue–specific enhancers (top) and for SNPs associated with other diseases (bottom; Supplementary Table 11). Enrichment values that did not reach significance (Chi-squared test, Online Methods) are shown in gray. ADMSC, adipose-derived mesenchymal stem cells. (b) Overlap of cell-specific DERs (shown in Fig. 2b) with asthma GWAS SNPs (top) and percentages of overlapping DERs or asthma SNPs in different DER subgroups (bottom). (c) UCSC tracks of IL33IL18R, IL5RAD50IL13IL4 and RORA loci containing large haplotype blocks of asthma-associated SNPs (black lines indicate their genomic location, red lines are SNPs that overlap DERs), along with cell-specific DERs tracks and H3K4me2 tracks for each cell type (merged from all assays shown in Fig. 2). Graphs show H3K4me2 enrichment values for each asthma-SNP-associated DERs (500-bp regions harboring the asthma SNP; highlighted in purple dashed-line boxes in c) in TH2 cells from the same H3K4me2 ChIP-seq assays shown in Figure 2. Each dot represents data from an independent assay; n = 18 assays from 10 healthy (HC) subjects, n = 24 assays from 12 asthmatic (AS) subjects; error bars indicate mean ± s.e.m.; *raw P < 0.05; **raw P < 0.01; NS, nonsignificant, calculated using MEDIPS.
Figure 7
Figure 7
Identification of asthma-associated enhancers. (a) MA plots (vertically displayed) illustrate genomic regions with differences in H3K4me2 enrichment (DERs) between healthy and asthmatic subjects in the three different cell types (Supplementary Table 12). Red dots and orange dots indicate windows with adjusted P < 0.05, or with raw P < 0.005, respectively (exact test for negative binomial distribution, using edgeR integrated in Bioconductor package MEDIPS). Z-scores (right) of normalized read counts for each asthma-associated DER (rows) identified in the TH2 cells. (b) Manhattan plot illustrates the genome-wide distribution of asthma-associated DERs in relation to their statistical significance values (P values, MEDIPS; y-axis parameter). Red dashed line sets the threshold for an adjusted P < 0.05. (c) Comparison of H3K4me2 enrichment between healthy and asthmatic subjects in indicated cells. H3K4me2 tracks for each cell type were merged from all assays performed in healthy (HC) and asthmatic (AS) donors (same cohort as shown for the analysis above and in Fig. 2). (d) H3K4me2 enrichment values for each asthma-associated DER (highlighted in purple dashed line boxes in c from the same H3K4me2 ChIP-seq assays shown in Fig. 2). Each dot represents data from an independent assay; n = 18 assays from 10 healthy subjects (HC), n = 24 assays from 12 asthmatic patients (AS); error bars indicate mean ± s.e.m.; *P < 0.05, **P < 0.01, ***P < 0.001 (MEDIPS).

Comment in

  • Enhancing the understanding of asthma.
    Vahedi G, Richard AC, O'Shea JJ. Vahedi G, et al. Nat Immunol. 2014 Aug;15(8):701-3. doi: 10.1038/ni.2946. Nat Immunol. 2014. PMID: 25045871 Free PMC article. No abstract available.

Similar articles

Cited by

References

    1. Ahmed R, Gray D. Immunological memory and protective immunity: understanding their relation. Science. 1996;272:54–60. - PubMed
    1. Ansel KM, Lee DU, Rao A. An epigenetic view of helper T cell differentiation. Nat. Immunol. 2003;4:616–623. - PubMed
    1. Kay AB. Allergy and allergic diseases. Second of two parts. N. Engl. J. Med. 2001;344:109–113. - PubMed
    1. Ober C, Yao TC. The genetics of asthma and allergic disease: a 21st century perspective. Immunol. Rev. 2011;242:10–30. - PMC - PubMed
    1. Gregersen PK, Olsson LM. Recent advances in the genetics of autoimmune disease. Annu. Rev. Immunol. 2009;27:363–391. - PMC - PubMed

Publication types

MeSH terms

Associated data