

Combined autophagy and proteasome inhibition: a phase 1 trial of hydroxychloroquine and bortezomib in patients with relapsed/refractory myeloma
- PMID: 24991834
- PMCID: PMC4203515
- DOI: 10.4161/auto.29264
Combined autophagy and proteasome inhibition: a phase 1 trial of hydroxychloroquine and bortezomib in patients with relapsed/refractory myeloma
Abstract
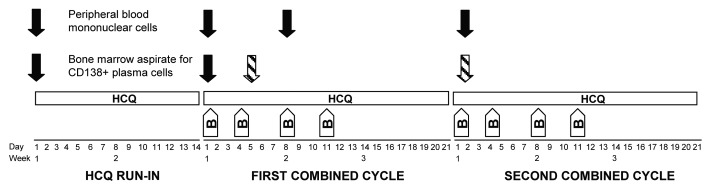
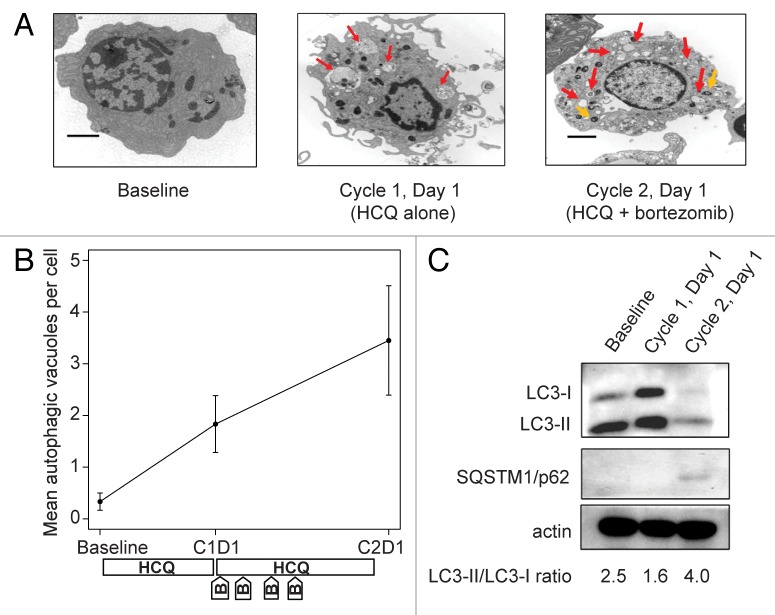
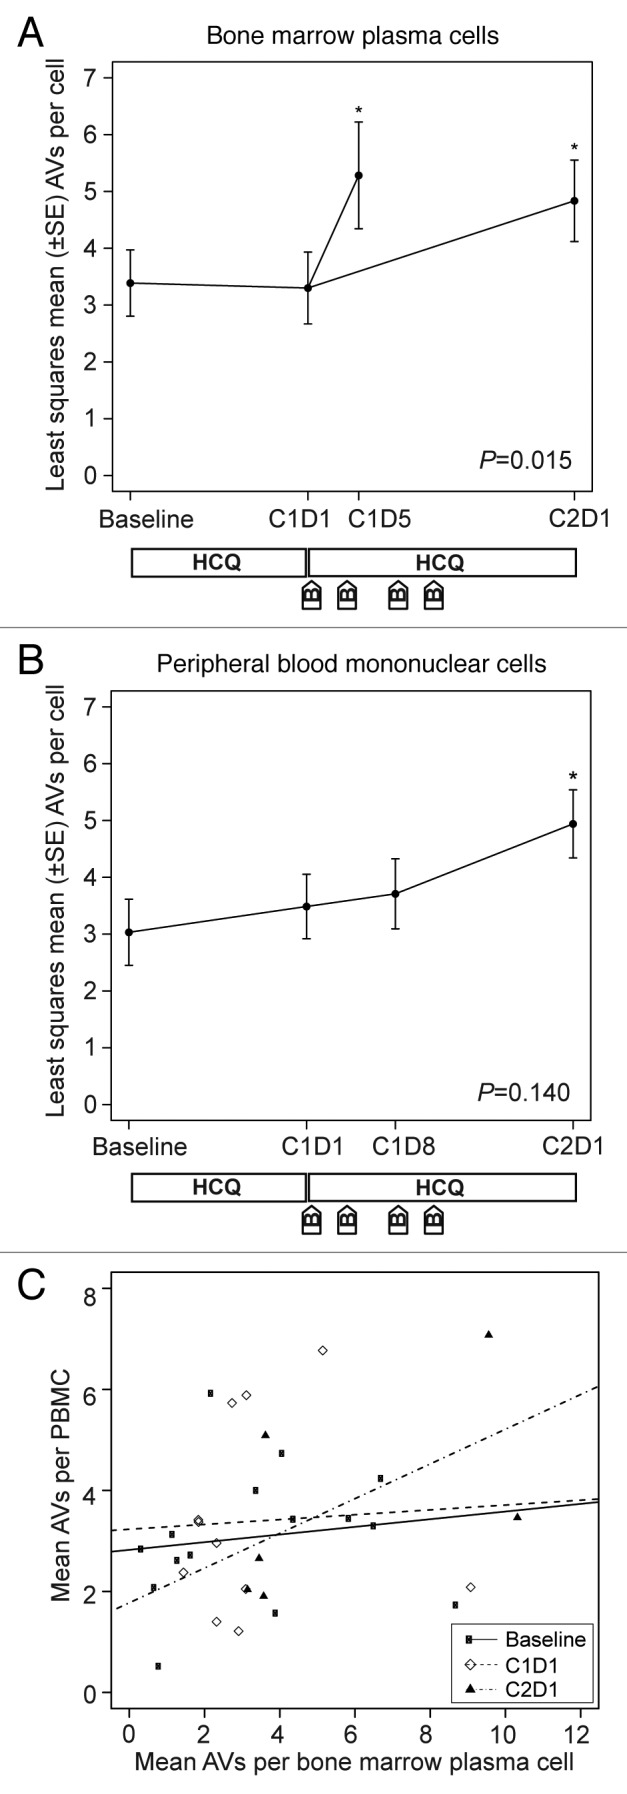
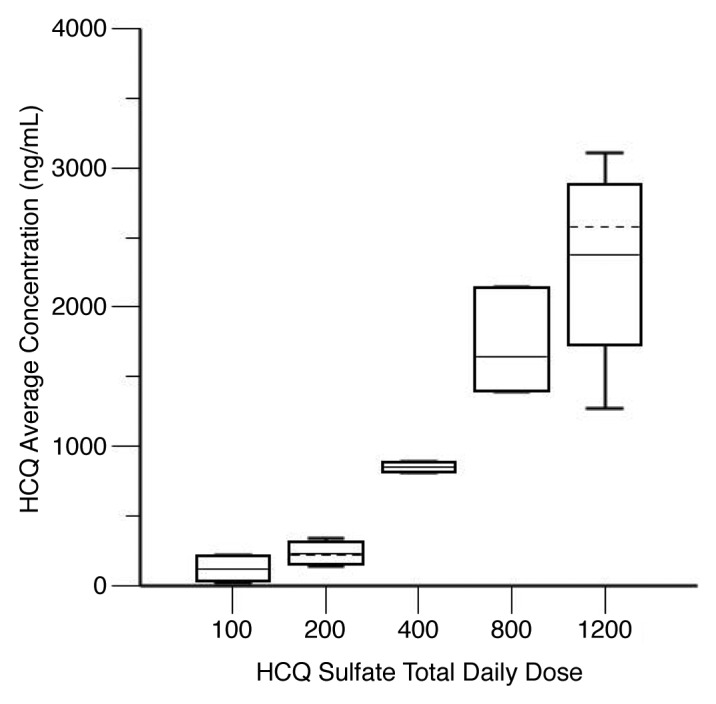
The efficacy of proteasome inhibition for myeloma is limited by therapeutic resistance, which may be mediated by activation of the autophagy pathway as an alternative mechanism of protein degradation. Preclinical studies demonstrate that autophagy inhibition with hydroxychloroquine augments the antimyeloma efficacy of the proteasome inhibitor bortezomib. We conducted a phase I trial combining bortezomib and hydroxychloroquine for relapsed or refractory myeloma. We enrolled 25 patients, including 11 (44%) refractory to prior bortezomib. No protocol-defined dose-limiting toxicities occurred, and we identified a recommended phase 2 dose of hydroxychloroquine 600 mg twice daily with standard doses of bortezomib, at which we observed dose-related gastrointestinal toxicity and cytopenias. Of 22 patients evaluable for response, 3 (14%) had very good partial responses, 3 (14%) had minor responses, and 10 (45%) had a period of stable disease. Electron micrographs of bone marrow plasma cells collected at baseline, after a hydroxychloroquine run-in, and after combined therapy showed therapy-associated increases in autophagic vacuoles, consistent with the combined effects of increased trafficking of misfolded proteins to autophagic vacuoles and inhibition of their degradative capacity. Combined targeting of proteasomal and autophagic protein degradation using bortezomib and hydroxychloroquine is therefore feasible and a potentially useful strategy for improving outcomes in myeloma therapy.
Keywords: autophagy; myeloma; proteasome.
Figures
Similar articles
-
Discovery, Development, and clinical applications of bortezomib.Oncology (Williston Park). 2004 Dec;18(14 Suppl 11):4-13. Oncology (Williston Park). 2004. PMID: 15688597 Review.
-
Hydroxychloroquine potentiates carfilzomib toxicity towards myeloma cells.Oncotarget. 2016 Oct 25;7(43):70845-70856. doi: 10.18632/oncotarget.12226. Oncotarget. 2016. PMID: 27683126 Free PMC article.
-
Phase I and II pharmacokinetic and pharmacodynamic study of the proteasome inhibitor bortezomib in Japanese patients with relapsed or refractory multiple myeloma.Cancer Sci. 2008 Jan;99(1):140-4. doi: 10.1111/j.1349-7006.2007.00638.x. Epub 2007 Oct 27. Cancer Sci. 2008. PMID: 17970782 Free PMC article. Clinical Trial.
-
Meta-analysis of the efficacy and safety of bortezomib re-treatment in patients with multiple myeloma.Clin Lymphoma Myeloma Leuk. 2014 Oct;14(5):380-8. doi: 10.1016/j.clml.2014.03.005. Epub 2014 Jun 11. Clin Lymphoma Myeloma Leuk. 2014. PMID: 25023616
-
Bortezomib combination therapy in multiple myeloma.Semin Hematol. 2012 Jul;49(3):228-42. doi: 10.1053/j.seminhematol.2012.04.010. Semin Hematol. 2012. PMID: 22726546 Free PMC article. Review.
Cited by
-
Mitochondrial dysfunction generates aggregates that resist lysosomal degradation in human breast cancer cells.Cell Death Dis. 2020 Jun 15;11(6):460. doi: 10.1038/s41419-020-2658-y. Cell Death Dis. 2020. PMID: 32541677 Free PMC article.
-
Role of Autophagy and AMPK in Cancer Stem Cells: Therapeutic Opportunities and Obstacles in Cancer.Int J Mol Sci. 2024 Aug 8;25(16):8647. doi: 10.3390/ijms25168647. Int J Mol Sci. 2024. PMID: 39201332 Free PMC article. Review.
-
Targeting Hedgehog signaling pathway and autophagy overcomes drug resistance of BCR-ABL-positive chronic myeloid leukemia.Autophagy. 2015;11(2):355-72. doi: 10.4161/15548627.2014.994368. Autophagy. 2015. PMID: 25701353 Free PMC article.
-
OP16 induces deadly autophagy and apoptosis of cells by inhibiting Akt in esophageal squamous cell carcinoma.Mol Cell Biochem. 2020 Sep;472(1-2):219-230. doi: 10.1007/s11010-020-03800-z. Epub 2020 Jul 15. Mol Cell Biochem. 2020. PMID: 32671513
-
Biologic Functions of Hydroxychloroquine in Disease: From COVID-19 to Cancer.Pharmaceutics. 2022 Nov 22;14(12):2551. doi: 10.3390/pharmaceutics14122551. Pharmaceutics. 2022. PMID: 36559044 Free PMC article. Review.
References
-
- Richardson PG, Sonneveld P, Schuster MW, Irwin D, Stadtmauer EA, Facon T, Harousseau JL, Ben-Yehuda D, Lonial S, Goldschmidt H, et al. Assessment of Proteasome Inhibition for Extending Remissions (APEX) Investigators Bortezomib or high-dose dexamethasone for relapsed multiple myeloma. N Engl J Med. 2005;352:2487–98. doi: 10.1056/NEJMoa043445. - DOI - PubMed
-
- San Miguel JF, Schlag R, Khuageva NK, Dimopoulos MA, Shpilberg O, Kropff M, Spicka I, Petrucci MT, Palumbo A, Samoilova OS, et al. VISTA Trial Investigators Bortezomib plus melphalan and prednisone for initial treatment of multiple myeloma. N Engl J Med. 2008;359:906–17. doi: 10.1056/NEJMoa0801479. - DOI - PubMed
-
- de Vos S, Goy A, Dakhil SR, Saleh MN, McLaughlin P, Belt R, Flowers CR, Knapp M, Hart L, Patel-Donnelly D, et al. Multicenter randomized phase II study of weekly or twice-weekly bortezomib plus rituximab in patients with relapsed or refractory follicular or marginal-zone B-cell lymphoma. J Clin Oncol. 2009;27:5023–30. doi: 10.1200/JCO.2008.17.7980. - DOI - PubMed
-
- Dunleavy K, Pittaluga S, Czuczman MS, Dave SS, Wright G, Grant N, Shovlin M, Jaffe ES, Janik JE, Staudt LM, et al. Differential efficacy of bortezomib plus chemotherapy within molecular subtypes of diffuse large B-cell lymphoma. Blood. 2009;113:6069–76. doi: 10.1182/blood-2009-01-199679. - DOI - PMC - PubMed
-
- Fisher RI, Bernstein SH, Kahl BS, Djulbegovic B, Robertson MJ, de Vos S, Epner E, Krishnan A, Leonard JP, Lonial S, et al. Multicenter phase II study of bortezomib in patients with relapsed or refractory mantle cell lymphoma. J Clin Oncol. 2006;24:4867–74. doi: 10.1200/JCO.2006.07.9665. - DOI - PubMed
Publication types
MeSH terms
Substances
Grants and funding
LinkOut - more resources
Full Text Sources
Other Literature Sources
Medical