. 2014 Aug 15;289(33):22614-22629.
doi: 10.1074/jbc.M114.567040. Epub 2014 Jul 2.

Structure of Yin Yang 1 oligomers that cooperate with RuvBL1-RuvBL2 ATPases

Affiliations

Structure of Yin Yang 1 oligomers that cooperate with RuvBL1-RuvBL2 ATPases

Andrés López-Perrote et al. J Biol Chem. .

Abstract

Yin Yang 1 (YY1) is a transcription factor regulating proliferation and differentiation and is involved in cancer development. Oligomers of recombinant YY1 have been observed before, but their structure and DNA binding properties are not well understood. Here we find that YY1 assembles several homo-oligomeric species built from the association of a bell-shaped dimer, a process we characterized by electron microscopy. Moreover, we find that YY1 self-association also occurs in vivo using bimolecular fluorescence complementation. Unexpectedly, these oligomers recognize several DNA substrates without the consensus sequence for YY1 in vitro, and DNA binding is enhanced in the presence of RuvBL1-RuvBL2, two essential AAA+ ATPases. YY1 oligomers bind RuvBL1-RuvBL2 hetero-oligomeric complexes, but YY1 interacts preferentially with RuvBL1. Collectively, these findings suggest that YY1-RuvBL1-RuvBL2 complexes could contribute to functions beyond transcription, and we show that YY1 and the ATPase activity of RuvBL2 are required for RAD51 foci formation during homologous recombination.

Keywords: ATPase; DNA Repair; Electron Microscopy (EM); RuvBL1; RuvBL2; Single Particle Analysis; Structural Biology; Transcription Factor; YY1.


Figures

FIGURE 1.
FIGURE 1.
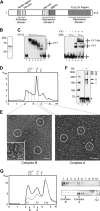
Purification and characterization of human YY1. A, scheme of human YY1 primary sequence. Relevant domains and motifs are indicated. B, SimplyBlue (Invitrogen) staining SDS-PAGE of purified His-YY1. C, left panel, His-YY1 was incubated with a synthetic HJ DNA (described as J3 under “Experimental Procedures”), and reactions were resolved by 6% non-denaturating PAGE. 0.3 nm of HJ (J3) (lane 1) was titrated with increasing amounts of YY1 (lanes 2–7, 1920, 960, 480, 240, 120, and 60 nm, respectively). Right panel, antibody super shift experiments demonstrated the specificity of the interaction. Lane 1, HJ probe alone (described as HJ_25_no_sp under “Experimental Procedures”); lanes 2 and 3, 2 and 1 μg of anti-YY1 antibody (Ab) alone, respectively; lane 4, YY1 protein alone (100 nm); lanes 5 and 6, incubation of YY1 protein (100 nm) with 2 and 1 μg of anti-YY1 antibody, respectively. Positions of unbound HJ probe, YY1-HJ, and YY1-HJ-antibody shifted-bands are indicated. D, SEC of purified His-YY1 in a BioSep-SEC-S4000 (Phenomenex) column. The column was calibrated with molecular weight standards (GE Healthcare), and the elution volume for some of the standards is shown on the top of the chromatogram. E, different fractions from the SEC in D were observed in the electron microscope, and fields from representative electron micrographs are shown. Typical molecule images are highlighted within circles. The inset in the left panel shows a view of aggregates found to elute first from the SEC column. The scale bar represents 250 Å. F, Western blot with an anti-YY1 antibody of His-YY1 after cross-linking with glutaraldehyde (GA); lane 1, molecular weight standards (Bio-Rad); lane 2, control without GA; lane 3, 30 min of incubation with GA. His-YY1 monomer migrates as a 70-kDa protein in SDS-PAGE (labeled as *). Cross-linked bands, with a relative molecular weight multiples of the YY1 monomer, are labeled with arrows. G, SEC of His-YY1 was as in D (black line). The peak fraction corresponding to complex B was re-injected (gray line) in the same column, and the fractions (F1 to F10) of both experiments were analyzed by silver-stained SDS-PAGE. The top panel corresponds to fractions from the black line and bottom panel for the gray line chromatography, respectively. Positions of the YY1 complexes A and B as well as molecular weight standards (GE Healthcare) used for column calibration are indicated. Total volume of the column (Vt) is indicated by an asterisk (*).
FIGURE 2.
FIGURE 2.
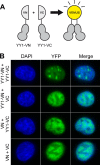
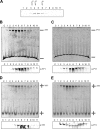
YY1 multimerizes in vivo. A, scheme of the expression constructs used in BiFC experiments. The coding sequence of YY1 was fused to either the N-terminal (YY1-VN) or C-terminal (YY1-VC) domain of Venus. B, U2OS cells transiently co-transfected with plasmids expressing the fusions in A were analyzed by microscopy. Co-transfection of YY1-VN with VC or YY1-VC with VN displayed no difference in pan-nuclear fluorescence compared with cells co-transfected with the empty vectors (VC and VN). Only cells co-transfected with both YY1 fusion constructs (YY1-VN and YY1-VC) had distinct foci present in the nuclei.
FIGURE 3.
FIGURE 3.
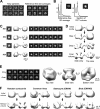
Structure of the human YY1 dimer. A, single molecule images and two-dimensional reference-free averages of complex A of His-YY1 show a typical square shape. The scale bar represents 5 nm. B, left panel, analysis of the rotational power spectra of a representative reference-free two-dimensional (2D) average of YY1. Right panel, rotational power spectra of sections along the longitudinal axis of the YY1 RCT structure. One representative section is displayed that revealed a strong component with 4-fold symmetry compatible with a dimeric or tetrameric complex. Scale bars represent 5 nm. C, four representative ab initio low resolution structures of YY1 complex A obtained by the RCT method. Two-dimensional reference-free averages used for each three-dimensional reconstruction are shown in the left panels and sections of each of the models (right panels). The scale bar represents 25 Å. D, angular refinement of YY1 dimer (complex A). Initial refinement was performed without imposing any symmetry (steps 1 and n) using the RCT model #01 shown in C as the initial template, and after convergence, c2 rotational symmetry was imposed and further refined (Final volume). Volumes are shown rendered at a threshold representing around 75% of the protein mass for visualization of structural features. The scale bar represents 25 Å. E, three-dimensional structure of the YY1 dimer (complex A) obtained after angular refinement. The scale bar represents 25 Å. Characteristic regions of the complex, defined as head and arm, are labeled. The left panel shows the comparison of the computational projections (Proj.) of the refined volume with the averages (Aver.) of the single molecule images assigned to each orientation. The scale bar represents 5 nm. F, angular refinement of YY1 complex A using several initial volumes as templates to discard a significant model bias. Refinement was performed applying 2-fold rotational symmetry and using as templates: a random conical tilt structure, a reconstruction obtained by common lines, or using the Startcsym command in EMAN (33) and a featureless blob using methods defined in EMAN2 (32). In all cases refinements converged to very similar structures (Refined volume). The scale bar represents 25 Å.
FIGURE 4.
FIGURE 4.
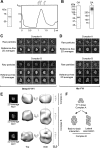
YY1 multimerizes in larger complexes by the association of YY1 dimers. A, purification of Strep-II-YY1. Left panel, SDS-PAGE and SimplyBlue (Invitrogen) staining of purified Strep-II-YY1. Right panel, SEC of Strep-II-YY1 using a Superdex 200 PC 3.2/30 (GE Healthcare) column. Molecular weight standards (GE Healthcare) used for column calibration are indicated on the top of the chromatogram. B, silver staining SDS-PAGE of the Strep-II-YY1 protein purified and stabilized by the GraFix method in a glycerol/glutaraldehyde (GA) gradient (right panel) and in a glycerol gradient (left panel). C, selected raw molecule images and reference-free averages of Strep-II-YY1 (complexes A and B). The scale bar represents 10 nm. 2D averages, two dimensional averages. D, raw molecule images and reference-free averages of His-YY1 (complexes A and B). Images for both samples (His- and Strep-II-tagged YY1) were similar. The scale bar represents 10 nm. E, representative RCT structures obtained from images and averages of Strep-II-YY1. The peak from the SEC contained a mixture of complexes A and B. The scale bar represents 25 Å. The two-dimensional averages of the images used for each RCT reconstructions are shown in the left panels. The scale bar represents 5 nm. F, hypothetical models for the association of YY1. Two potential ways of association of YY1 dimers into larger oligomers, based on the two-dimensional averages and the RCT structures of complexes A and B, are proposed.
FIGURE 5.
FIGURE 5.
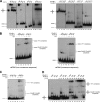
YY1 oligomers recognize DNA with and without the consensus sequence. A, purified Strep-II-YY1 was fractionated as in Fig. 4A and analyzed by SDS-PAGE and silver-staining. Molecular weight markers used for SEC calibration are indicated above the gel. B, EMSA using the fractions from the SEC experiment shown in A and a dsDNA containing the consensus sequence for YY1 (CCAT) (described as dsDNA_sp_2 under “Experimental Procedures”). C, EMSA as in B but using a dsDNA that does not contain the consensus sequence (described as dsDNA_no_sp_2 under “Experimental Procedures”). D, EMSA as in B but using a synthetic 4-way HJ containing the consensus sequence for YY1 (CCAT) (described as HJ_25_sp under “Experimental Procedures”). E, EMSA as in D but using a synthetic 4-way HJ that does not contain the consensus sequence (described as HJ_25_no_sp under “Experimental Procedures”). Lanes labeled as C (B–E) show the nucleic acid in each case in the absence of protein. The bottom panels (B–E) show the same gels, run for longer, and where the presence of YY1 in the shifted DNA was detected by Western blot with an anti-YY1 antibody (α-YY1).
FIGURE 6.
FIGURE 6.
Analysis of the interaction of purified YY1 with RuvBL1 and RuvBL2. A, SDS-PAGE and SimplyBlue (Invitrogen) staining of purified His-RuvBL1, His-RuvBL2, His-RuvBL1-RuvBL2, and RuvBL1-RuvBL2. B, chromatograms and SDS-PAGE analysis of the fractions from a SEC of His-RuvBL1, His-RuvBL2, and His-RuvBL1-RuvBL2 (solid line) and RuvBL1-RuvBL2 (dash line) using a Superdex 200 PC 3.2/30 (GE Healthcare) column. Proteins were stained using SimplyBlue (Invitrogen) (His-RuvBL1, His-RuvBL1-RuvBL2, and RuvBL1-RuvBL2) or by silver staining (His-RuvBL2). The positions for the different oligomeric species (12-mer, dodecamer; 6-mer, hexamer; 1-mer, monomer) are indicated in each case and were determined by comparison with molecular weight standards. The asterisk (*) in the case of His-RuvBL1 SEC indicates a peak of aggregated material as observed by EM. C, pulldown experiments of Strep-II-YY1 and His-RuvBL1 or His-RuvBL2. Strep-II-YY1 was incubated without (lane 1) or with His-RuvBL1 (lane 3) or His-RuvBL2 (lane 5) and affinity purified using the Strep-II-tag present in YY1. As a control, His-RuvBL1 (lane 2) or His-RuvBL2 (lane 4) was purified in the same conditions but in the absence of YY1. D, pulldown experiments of Strep-II-YY1 and His-RuvBL1-RuvBL2 or RuvBL1-RuvBL2. Strep-II-YY1 was incubated without (lane 1) or with His-RuvBL1-RuvBL2 (lane 3) or RuvBL1-RuvBL2 (lane 5) and affinity-purified as in A. As a control, His-RuvBL1-RuvBL2 (lane 2) or RuvBL1-RuvBL2 (lane 4) was pull downed in the same conditions as those before but in the absence of YY1.
FIGURE 7.
FIGURE 7.
YY1 and RuvBL1-RuvBL2 cooperate in DNA binding. A, left panel, EMSA assays showing binding of Strep-II-YY1 to several DNA substrates (described under “Experimental Procedures”) and represented as a schematic in each gel. Binding reactions contained 0, 240, 120, 60, or 30 nm protein and 0.3 nm DNA species: HJ (J3) (lanes 1–5), dsDNA non-consensus sequence (dsDNA_no_sp_1) (lanes 6–10), 80-nt ssDNA (lanes 11–14), and dsDNA consensus sequence (dsDNA_sp_1) (lanes 15–19). Right panel, EMSA assays showing binding of His-RuvBL1-RuvBL2 to the same DNA substrates. Binding reactions contained 0, 1.4, 0.7, 0.35, or 0.17 μm protein and 0.3 nm DNA species: HJ (J3) (lanes 1–5), dsDNA non-consensus sequence (dsDNA_no_sp_1) (lanes 6–10), 80-nt ssDNA (lanes 11–14), and dsDNA consensus sequence dsDNA_sp_1) (lanes 15–19). Reactions were performed as described under “Experimental Procedures,” and protein-DNA complexes were visualized by 6% PAGE and autoradiography. B, RuvBL1-RuvBL2 enhances the binding of YY1 to dsDNA either containing (right panel, dsDNA_sp_1) or not the consensus sequence (left panel, dsDNA_no_sp_1). Reactions assembled on ice contained combinations of a decreasing concentration of His-RuvBL1-RuvBL2 (1.4, 0.7, 0.35 or 0.17 μm) and a fixed concentration of Strep-II-YY1 (120 nm in the left panel and 15 nm in the right panel). After DNA addition (0.3 nm), samples were incubated for 30 min at 37 °C before electrophoresis. C, YY1 and RuvBL1-RuvBL2 also cooperate in ssDNA binding. Shown is a similar experiment as B but using a 80-nt ssDNA (0.3 nm) (lanes 1–9). His-RuvBL1-RuvBL2 concentrations were varied as indicated from 700 to 87 nm, and the fixed concentration of Strep-II-YY1 used was 120 nm. D, EMSA of the enhancement in binding of Strep-II-YY1 to HJ (J3) (0.3 nm) in the presence of the indicated concentrations His-RuvBL1-RuvBL2 (concentrations are expressed in nm).
FIGURE 8.
FIGURE 8.
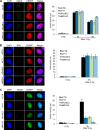
YY1 and RuvBL2 function during G2 to promote RAD51 foci formation, but not γH2AX or RPA foci, after exposure to IR. A, A549 cells were transfected with scrambled siRNA (siCTR) or siRNA directed against YY1, RuvBL2, or BRCA2, irradiated (3 Gy) and harvested 2 or 8 h later and immunostained for γH2AX and CENPF (to identify G2 phase cells). Average γH2AX foci per G2 cell were quantified (right panel). B, cells transfected as in A were irradiated (3 Gy), harvested after 2 h, and immunostained for RPA and CENPF. Average RPA foci per G2 cell were quantified (right panel). C, cells transfected as in A were immunostained for RAD51 and CENPF, and average RAD51 foci per G2 cell were quantified (right panel). All data (A–C) are the means of >3 experiments; error bars, S.D.
FIGURE 9.
FIGURE 9.
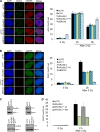
RuvBL2 cooperates with YY1 to promote RAD51 foci formation, and the ATPase activity of RuvBL2 is required for this activity. A, A549 cells were transfected with scrambled siRNA (siCTR) or siRNAs directed against YY1, RuvBL2, or BRCA2, as indicated, irradiated (3 Gy), harvested 2 or 8 h later, and immunostained for γH2AX and CENPF (to identify G2 phase cells). Average γH2AX foci per G2 cell were quantified (right panel). B, cells treated as in A were immunostained for RAD51 and CENPF, and average RAD51 foci per G2 cell were quantified (right panel). All data (A and B) are the mean of >3 experiments; error bars, S.D. C, top, Western blot analysis of whole cell extracts prepared from A549 cells transfected with the indicated siRNA. Bottom, Western blot analysis of whole cell extracts prepared from A549 cells transfected with single or double siRNA constructs as indicated. Anti-KAP1 is shown as a loading control. D, U2OS cells transfected with siRNA directed against RuvBL2 and either GFP, GFP-RuvBL2, or GFP-RuvBL2-K83A were irradiated (3 Gy), harvested, and immunostained for RAD51 and CENPF. Average RAD51 foci per GFP positive G2 cell were quantified and are presented as the means of three experiments; error bars, S.D.

Similar articles

Cited by

References

    1. Gordon S., Akopyan G., Garban H., Bonavida B. (2006) Transcription factor YY1: structure, function, and therapeutic implications in cancer biology. Oncogene 25, 1125–1142 - PubMed
    1. Calame K., Atchison M. (2007) YY1 helps to bring loose ends together. Genes Dev. 21, 1145–1152 - PubMed
    1. He Y., Casaccia-Bonnefil P. (2008) The Yin and Yang of YY1 in the nervous system. J. Neurochem. 106, 1493–1502 - PMC - PubMed
    1. Jeon Y., Lee J. T. (2011) YY1 tethers Xist RNA to the inactive X nucleation center. Cell 146, 119–133 - PMC - PubMed
    1. Nicholson S., Whitehouse H., Naidoo K., Byers R. J. (2011) Yin Yang 1 in human cancer. Crit. Rev. Oncog. 16, 245–260 - PubMed

Publication types

MeSH terms