. 2014 Jul 3;511(7507):99-103.
doi: 10.1038/nature13489. Epub 2014 Jun 25.

Host-directed therapy of tuberculosis based on interleukin-1 and type I interferon crosstalk

Affiliations

Host-directed therapy of tuberculosis based on interleukin-1 and type I interferon crosstalk

Katrin D Mayer-Barber et al. Nature. .

Abstract

Tuberculosis remains second only to HIV/AIDS as the leading cause of mortality worldwide due to a single infectious agent. Despite chemotherapy, the global tuberculosis epidemic has intensified because of HIV co-infection, the lack of an effective vaccine and the emergence of multi-drug-resistant bacteria. Alternative host-directed strategies could be exploited to improve treatment efficacy and outcome, contain drug-resistant strains and reduce disease severity and mortality. The innate inflammatory response elicited by Mycobacterium tuberculosis (Mtb) represents a logical host target. Here we demonstrate that interleukin-1 (IL-1) confers host resistance through the induction of eicosanoids that limit excessive type I interferon (IFN) production and foster bacterial containment. We further show that, in infected mice and patients, reduced IL-1 responses and/or excessive type I IFN induction are linked to an eicosanoid imbalance associated with disease exacerbation. Host-directed immunotherapy with clinically approved drugs that augment prostaglandin E2 levels in these settings prevented acute mortality of Mtb-infected mice. Thus, IL-1 and type I IFNs represent two major counter-regulatory classes of inflammatory cytokines that control the outcome of Mtb infection and are functionally linked via eicosanoids. Our findings establish proof of concept for host-directed treatment strategies that manipulate the host eicosanoid network and represent feasible alternatives to conventional chemotherapy.


Figures
Extended Data Figure 1
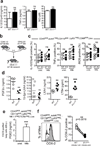
Extended Data Figure 1. Lipid mediator production and COX2 expression in Il1r1−/− animals and mixed bone-marrow chimaeric mice after Mtb infection
a, IL12/23 p40, TNF-α or NO measured in supernatants of WT and Il1r1−/− BMDM after exposure to live Mtb (m.o.i. = 3). b, CD45.1/1 mice were lethally irradiated and reconstituted with equal ratios of WT (CD45.1/2) and Il1r1−/− (CD45.2/2) bone-marrow cells and infected with Mtb. c, Frequency of IL-12/23p40, TNF-α or iNOS expression in WT (white circles) or Il1r1−/−(KO, dark circles) total CD68pos mononuclear myeloid cells, gated as indicated. Each connecting line depicts an individual animal. Data in are representative of two independent experiments with 3–5 mice each. Paired t-tests P values are indicated (n.s., not significant). d, PGF2α, 15-Epi-LXA4, LXA4 or LTB4 concentrations in BALF 25 days after Mtb infection of WT or Il1r1−/− mice. e, Pulmonary single-cell suspensions from day 28 Mtb-infected WT mice were FACS-sorted based on indicated surface marker expression and cultured for 16 h, with (white bars) or without addition of Mtb (grey bars), after which PGE2 was measured in culture supernatants. f, Analysis of donor bone-marrow derived CD68pos myeloid cells 4 weeks p.i. in isolated lung cells marked by CD45.1 and CD45.2 expression for COX-2 protein expression (left, filled histogram: WT cells; thick line: Il1r1−/− cells; dotted line: isotype control) and frequency (right) of COX-2 expression by WT (white circles) or Il1r1−/−(dark circles) total CD68pos mononuclear myeloid cells. Each connecting line depicts an individual animal. AU, arbitrary units. Data are representative of two independent experiments with 3–5 mice each. Paired t-tests P values are indicated (n.s., not significant).
Extended Data Figure 2
Extended Data Figure 2. Characterization of extracellular bacilli in WT or IL-1-deficient macrophage cultures
a, PGE2 measured in supernatants of WT and Il1r1−/− or Il1α,Il1β−/− BMDM after exposure to live Mtb (m.o.i. = 3). b, Ratio of PGE2 to LXA4 in WT or Il1r1−/− BMDC 40 h after live Mtb (m.o.i. = 10) infection. WT, Il1r1−/− or Il1α,Il1β−/− BMDM were infected with H37Rv Mtb (m.o.i. = 3) in vitro. c, d, 5 days later free extracellular bacilli in each culture was assessed through microscopy on cytospin slides (c) as well as the frequency of infected macrophages (d). 4–5 view fields, a total of 454 macrophages, per experimental group, were blindly scored. Data shown are the means ± s.d. and are representative of 2 independent experiments. ***P ≤ 0.0005 significant differences compared to WT cells. e, H37Rv-RFP (left panel) alone, BMDM alone (middle panel) or H37Rv-RFP mixed briefly with BMDM (right panel) to quantify free extracellular bacteria by flow cytometry. f, WT or Il1r1−/− BMDM were infected with H37Rv-RFP (m.o.i. = 3) in vitro. Free bacteria in cultures were analysed by FACS at indicated time points. g, WT, Il1r1−/− or Il1α,Il1β−/− BMDM were infected with H37Rv-RFP (m.o.i. = 3) in vitro and in the presence or absence of recombinant murine IL-1α, IL-1β or both. 5 days later cell-free bacteria were measured by FACS. ***P ≤ 0.0005 significant differences in indicated comparisons. Data shown are the means ± s.d. and are representative of 2 independent experiments.
Extended Data Figure 3
Extended Data Figure 3. Role of COX-2 in IL-1-dependent PGE2 synthesis and bacterial control
a, c.f.u. at 5 days after in vitro infection (m.o.i. = 3) of WT or Il1r1−/− BMDM in the presence or absence of PGE2. b, c.f.u. at 5 days after in vitro infection (m.o.i. = 3) of WT or Il1α,Il1β−/− BMDM in the presence or absence of IL1, PGE2 or the COX-2 inhibitor valdecoxib (left) and PGE2 concentrations after 48 h (right). c, c.f.u. at 5 days after in vitro infection (m.o.i. = 3) of WT or Ptgs2(Y385F) enzymatic activity-deficient BMDMin the presence or absence of the COX-2 inhibitor valdecoxib (left) and PGE2 concentrations after 48 h (right). d, PGE2 concentration in lungs (left) and serum (right) of 4-week Mtb-infected WT, Il1r1−/− or ptgs2(Y385F) enzymatic activity-deficient animals. e, LXA4 and 15-Epi-LXA4 concentrations or in serum of 4 weeks. Infected WT, Il1r1−/− or ptgs2(Y385F) enzymatic activity-deficient animals after aerosol challenge with 100–150 c.f.u. H37Rv. *P ≤ 0.05 and **P ≤ 0.005, significant differences compared to WT. Data shown are the means ± s.d. and are representative of 2 independent experiments. e, IL-1β concentration in supernatant of primary human monocyte derived macrophages from 35 healthy donors, 24 h after Mtb infection (m.o.i. = 5) in relation to LDH levels in same cultures.
Extended Data Figure 4
Extended Data Figure 4. IL-1 type I IFN crosstalk
a, IL-1β and IL1Ra concentrations measured in BALF of WT or Ifnar1−/− mice 4 weeks p.i. b, PGE2/15-Epi-LXA4 and PGE2/LXA4 ratios, LXA4, and 15-Epi-LXA4 concentrations in supernatants of primary human MDM from 22 healthy donors, 24 h after Mtb infection (m.o.i. = 5) in the presence or absence of rhIFN-β. Differences were compared as indicated by lines. c, PGE2 concentrations in culture supernatants of primary human MDM from 7 healthy donors, 24 h after Mtb infection (m.o.i. = 5) in the presence or absence of rhIFN-β, rhIL-1α and Il-1β or PGE2. Differences were compared as indicated by lines. d, WT (white) or Il1α,Il1β−/− (light grey) BMDM were infected with increasing m.o.i. of Mtb in vitro. mRNA expression of indicated genes was determined at 40 h. e, WT (white) or Il1α,Il1β−/− (light grey) BMDM were infected with m.o.i. = 3 of Mtb in vitro in the presence or absence of recombinant murine IL-1α, IL-1β or both. mRNA expression of indicated genes was determined at 40 h. Data shown are the means ± s.d. and are representative of 2 independent experiments.
Extended Data Figure 5
Extended Data Figure 5. Cytokine expression in Mtb-infected pICLC-treated WT mice
WT mice were treated with pICLC (+) or without (−, PBS) intranasally twice a week, starting day 1 after aerosol challenge with Mtb. a–c, c.f.u. (a), FACS analysis of dead cells (b) and indicated cytokines measured in BALF at 4 weeks post infection (c). d, Indicated cytokines and eicosanoids were measured by ELISA in lung homogenates, BALF and serum 4 weeks p.i. Data are representative of a minimum of 3 independent experiments with a minimum of 4 mice per group.
Extended Data Figure 6
Extended Data Figure 6. PGE2 administration and 5–LO inhibition in IL-1-deficient animals reduces necrotic pathology and increases bacterial control
a, Experimental design for host-directed therapy with PGE2 and zileuton in Mtb-infected mice. b, Weight loss (travelling error bars indicate s.d., n = 6) during Mtb infection of WT (left) or Il1α,Il1β−/− (right) mice treated with or without i.n. PGE2 and zileuton. c, d, Bacterial loads in BALF (c) or FACS analysis (d) of dead cells 21 days after aerosol exposure to Mtb (H37Rv) in lungs of WT or Il1α,Il1β−/− treated with or without i.n. PGE2 and zileuton. e, Representative haematoxylin-and-eosin-staining of lung lobes of untreated Il1r1−/− or treated Il1r1−/− with i.n. PGE2 and zileuton in drinking water (top panels). Bottom panels show the relative number of acid fast bacilli, lung inflammation (% lung affected, mean granuloma sizes) and degree of necrosis scored blindly by a trained pathologist. Differences were compared as indicated by lines. Data shown are representative of two independent experiments with a minimum of 6 mice per group. f, Survival after aerosol exposure to Mtb (H37Rv) of Ifng−/− (top panel) or Tnfa−/− (bottom panel) untreated (PBS) or treated i.n. PGE2 (twice a week) and zileuton (in drinking water) starting at day 1 p.i. Data shown are representative of three independent experiments with a minimum of 4 mice per group. g, Survival after aerosol exposure to Mtb (H37Rv) of Il1r1−/− (top panel) treated with either PGE2 or zileuton. Data shown are representative of two independent experiments with a minimum of 4 mice per group. Bottom panel shows survival of Il1r1−/−, Alox5−/− or Il1r1,Alox5−/− mice. Data shown are representative of three independent experiments with a minimum of 4 mice per group.
Extended Data Figure 7
Extended Data Figure 7. PGE2 and/or 5–LO inhibition in pICLC-treated WT mice reduces necrotic pathology and increases bacterial control
a, WT mice were treated with pICLC or without (PBS) intranasal twice a week, starting day 1 after aerosol challenge with Mtb. Representative haematoxylin-andeosin-staining of lung lobes of untreated WT (PBS), pICLC-treated or pICLC-treated with i.n. PGE2 and zileuton in drinking water (left panels) three weeks after Mtb infection. Right panels show the relative number of acid fast bacilli, lung inflammation (% lung affected, mean granuloma sizes) and degree of necrosis scored blindly by a trained pathologist. Differences were compared as indicated by lines. Data shown are representative of two independent experiments with a minimum of 4 mice per group. b, WT mice were treated as indicated in figure. Weight loss in experimental groups was normalized to time of moribundity of last remaining mouse in pICLC group (between day 40 and day 100, depending on experiment). For pICLC group (black), weight loss is shown for each animal at time of moribundity. Data shown are combined from three individual experiments with 3–7 mice per group. Differences were compared to pICLC (black) group. c, WT mice were untreated (PBS) treated with pICLC or pICLC, PGE2 and zileuton intranasally starting day 1 after aerosol challenge with Mtb. 3 weeks post infection IL1Ra was measured by ELISA in BALF and serum. Data shown are representative of two independent experiments with a minimum of 4 mice per group. d, Bacterial loads 28 days after aerosol exposure to Mtb (H37Rv) in BALF of pICLC-treated WT (black) mice with or without i.n. PGE2 (yellow) or zileuton (orange) or a combination of both (red) as indicated in figure. e, PGE2 and IFN-β concentrations in BALF of indicated mice 4 weeks p.i. ***P ≤ 0.0005, significant differences compared to pICLC (black)-treated group. Data shown are representative of three independent experiments with a minimum of 4 mice per group.
Extended Data Figure 8
Extended Data Figure 8. Host-directed therapy with PGE2 and zileuton does not interfere with antibiotic treatment
Bacterial loads in C3HeB/FeJ mice 43 days p.i. with 100–150 c.f.u. H37Rv, treated or untreated with PGE2 intranasally and zileuton in drinking water. Starting day 24 p.i. antibiotic treatment with rifampicin, pyrazinamide and isoniazid was given 5× a week until one day before collection. a, b, Bacterial loads in BALF (a) and lungs (b). Differences were compared as indicated by lines. Data shown are from one experiment with 5–7 mice per group.
Extended Data Figure 9
Extended Data Figure 9. IL-10, but not LTB4 or 12/15-LO, is required for type I IFN-driven disease exacerbation of pICLC-treated WT animals infected with Mtb
a, WT or Ifnar1−/− mice were treated with pICLC or without (PBS) intranasal twice a week, starting day 1 after aerosol challenge with Mtb. Weight loss in experimental groups was normalized to time of moribundity of last remaining mouse in pICLC group (black) for each independent experiment. For pICLC group (black), weight loss is shown for each animal at time of moribundity. Data shown are combined from two individual experiments with 3–7 mice per group. Differences were compared as indicated by lines. b, WT or Alox5−/− mice were treated with pICLC or without (PBS) intranasally twice a week or administered zileuton in the drinking water. Data shown are representative of two individual experiments with 4–8 mice per group. Differences were compared as indicated by lines. c, WT or Il10−/− mice were treated with pICLC or without (PBS) intranasally twice a week. For pICLC group (black), weight loss is shown for each animal at time of moribundity. Data shown are representative of two individual experiments with 3–8 mice per group. Differences were compared as indicated by lines. Survival (right panel) of WT or Il10−/− mice treated with (dark grey lines) or without (light grey lines). Data shown are representative of two individual experiments with 4–6 mice per group. d,WT, 12/15-LO−/−, Ltb4r1−/− mice were treated with pICLC or without (PBS) intranasally twice a week. For pICLC groups, weight loss is shown for each animal at time of moribundity. Data shown are representative of two individual experiments with 5–7 mice per group. Differences were compared to PBS controls in each mouse strain. Survival of WT or 12/15-LO−/− mice (middle panel) treated with pICLC (dark blue lines) or without (light blue lines). Data shown are representative of two individual experiments with 4–6 mice per group. Survival of WT or Ltb4r1−/− mice (right panel) treated with pICLC (burgundy lines) or without (brown lines). Data shown are representative of two individual experiments with 4–6 mice per group.
Extended Data Figure 10
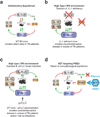
Extended Data Figure 10. Schematic summary of IL-1–type I IFN counter-regulation during Mtb infection
a, Virulent Mtb directly induces IL-1α and IL-1β as well as type I IFNs in myelophagocytic cells. Whereas IL-1 is required for bacterial control, type I IFNs are considered detrimental because they can exert pro-bacterial effects. During low-dose aerosol infection in WT B6 mice the balance of these two pathways establishes an inflammatory equilibrium that allows for containment of bacilli and chronic infection and thus models certain aspects associated with latency in TB patients. This is achieved by an antagonist relationship whereby type I IFNs inhibit IL-1α/β directly as well as through induction of IL-10 and IL1Ra, while in the opposing direction IL-1α/β limit type I IFNs through COX-2-mediated PGE2 induction. b, In the absence of IL-1, PGE2 fails to inhibit type I IFNs and the equilibrium is disturbed. This leads to excessive type I IFN expression that in turn causes increased bacterial replication and pathology, thus modelling the type I IFN-associated uncontrolled active disease that occurs in a subset of TB patients. c, Likewise, experimental induction of type I IFNs by pICLC or viral co-infections creates a detrimental environment with uncontrolled bacterial growth and extracellular bacteria, ultimately resulting in loss of host resistance and increased mortality. d, HDT targeting PGE2, either directly or indirectly by enhancing PGE2 levels via 5-LO inhibition with zileuton, returns the system to a non-pathological steady state by limiting type I IFN-driven disease exacerbation, bacterial replication and pulmonary necrosis. Green arrows indicate inductive and red lines inhibitory pathways.
Figure 1
Figure 1. IL-1 triggers PGE2 synthesis during Mtb infection
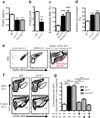
a, Bacterial loads (colony forming units, c.f.u.); b, PGE2 concentrations and PGE2/LXA ratio 25 days after aerosol exposure to Mtb in BALF of C57BL6 wild type (WT), Il1r1−/−, Il1α,Il1β−/−, Il1β−/− or Il1a−/− mice (n = 4–8). c, c.f.u. in Mtb-infected (m.o.i. = 3) WT or Il1r1−/− BMDM cultures. d, Mtb-RFP-infected (m.o.i. = 3) WT and Il1α,Il1β−/− BMDMs cultured with or without PGE2. Extracellular bacteria were analysed by FACS (day 5). e, c.f.u. after in vitro infection (m.o.i. = 3) of WT or Il1α,Il1β−/− BMDM in the presence or absence of IL1, PGE2 or the COX-2 inhibitor valdecoxib. rmIL-1α, recombinant murine IL-1α. f, Lung c.f.u. of 4-week Mtb-infected WT, Il1r1−/− or Ptgs2(Y385F) mice (n = 5). a–f, Data are representative of two independent experiments. *P ≤ 0.05; **P < 0.005; ***P < 0.0005; compared as indicated in figure by lines or to WT control groups. Error bars denote s.d. (Mann–Whitney test). g, Survival of WT, Il1r1−/− or Ptgs2(Y385F) animals after aerosol challenge with 25–40 c.f.u. Data shown are from one experiment (n = 4, Mantel–Cox test). h, PGE2 concentration in supernatants of MDM from 23 healthy donors, 24 h after Mtb infection in the presence or absence of rhIL-1α, rhIL-1β or anti-hIL1R1 neutralizing antibody. rhIL-1α, recombinant human IL-1α; anti-hIL1R1, anti-human IL-1R1. Differences were compared as indicated by lines (Wilcoxon matched pairs test).
Figure 2
Figure 2. IL-1 and PGE2 negatively regulate type I IFNs
a, b, PGE2 measured in BALF of indicated mouse strains 4 weeks post infection (p.i.) (n = 5) (a) and WT or Il1α,Il1β−/− BMDM infected for 40 h (m.o.i. = 5) or in the presence or absence of recombinant murine IFN-β (rmIFNβ; b). c, PGE2 in supernatants of MDM from 22 healthy donors, 24 h after Mtb infection (m.o.i. = 5) in the presence or absence of rhIFN-β (Wilcoxon matched pairs test). d, IfnbmRNA expression and IFN-β protein in lungs of Mtb-infected WT or Il1r1−/− mice at indicated time points. AU, arbitrary units (n = 9). e, f, IFN-βprotein in supernatants of WT or Il1α,Il1β−/− BMDM infected for 40 h (e) or WT BMDM in the presence or absence of rmIL-1α or IL-1β (f). g, IFN-β protein concentration in supernatants WT BMDM (40 h p.i. Mtb) treated with increasing concentrations of PGE2. h, IFN-β protein in supernatants of MDM from 7 healthy donors, 24 h after Mtb infection with or without PGE2 (Wilcoxon matched pairs test). i, c.f.u. at indicated time points of Mtb-infected (m.o.i. = 5) WT BMDM cultures treated with anti-IFNAR1 monoclonal antibody, rmIL-1α or Il-1β, rmIFN-β or PGE2. j, c.f.u. after 5 days of Mtb infection (m.o.i. = 5) of Il1r1−/− BMDM treated with anti-mIFNAR1 mAb or PGE2. k, Survival of WT, Il1r1−/−, Ifnar1−/− or Il1r1,Ifnar1−/− double-deficient animals after Mtb infection (n = 5, Mantel–Cox test). Data shown are representative of two (a, b, d–g, i, k) or three (j) independent experiments. *P ≤ 0.05; **P < 0.005; ***P < 0.0005; compared as indicated in figure by lines or to WT control groups. Error bars denote s.d. (Mann–Whitney test).
Figure 3
Figure 3. IL-1, interferon and eicosanoid pathways are engaged in active TB disease
a, Mann–Kendall linear trend post hoc comparison of ratios of PGE2/LXA4 and PGE2/15-Epi-LXA4 according to AFB grade in the Chinese cohort. Each dot represents one individual with triangles depicting directionality of trend. b, PTB patients were stratified into mild (AFB−, unilateral lung lesions) and severe disease (AFB ≥ 1+, and bilateral lung lesions) categories and canonical correlation analysis (CCA) was performed independently for Indian and Chinese cohorts. Indicated parameters were used to differentiate PTB from HC and LTBI groups as well as clinical severity within PTB group based on combined canonical coefficients. sIL-1R, soluble IL-1R.
Figure 4
Figure 4. HDT targeting eicosanoids confers protection in highly susceptible mice associated with high type I IFN responses
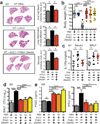
a, Lung c.f.u. (day 21 p.i.) (left, n = 10, error bars denote s.d., Mann–Whitney test) and survival (right, n = 13, Mantel–Cox test between treated and untreated Il1α,Il1β−/− mice) after aerosol exposure to Mtb of WT or Il1α,Il1β−/− treated with or without intranasal (i.n.) PGE2 (twice a week) and zileuton (in drinking water) starting day 1 p.i. Data shown are combined from two independent experiments. b–e, Mice were treated i.n. with pICLC or without (PBS) twice a week, starting day 1 after aerosol challenge with Mtb. b, Weight loss (left, travelling error bars indicate s.d., n = 7) and survival (right) during Mtb infection of WT (pICLC or PBS i.n.) mice treated with or without i.n. PGE2 and zileuton. c, Lung c.f.u. 4 weeks p.i. of WT mice treated as indicated (left, n = 5, error bars denote s.d. (Mann–Whitney test). Survival (right) of pICLC-treated WT mice (black) compared to those who also received PGE2 (yellow), zileuton (orange) or both (red). Differences were compared to pICLC group (Mantel–Cox test). Data are representative of three independent experiments (n = 5). d, Survival of pICLC-treated WT mice (black), Ifnar1−/− animals (purple, without pICLC in pink) or Alox5−/− mice (dark green, without pICLC in light green). Statistical significance was compared to pICLC group. Data are representative of two independent experiments (n = 4–6). e, Survival of pICLC-administered WT mice treated with zileuton in drinking water starting day 1 (solid orange line) compared to d30 (dotted orange line). Data shown are combined from two independent experiments (n = 10). Statistical significance was compared to pICLC (black) group with Mantel–Cox test. *P ≤ 0.05; **P < 0.005; ***P < 0.0005.

Comment in

Similar articles

  • Targeting the inflammatory response in tuberculosis.
    Friedland JS. Friedland JS. N Engl J Med. 2014 Oct 2;371(14):1354-6. doi: 10.1056/NEJMcibr1408663. N Engl J Med. 2014. PMID: 25271609 No abstract available.
  • Cytokines: Tipping TB off balance.
    Legg K. Legg K. Nat Rev Immunol. 2014 Aug;14(8):516. doi: 10.1038/nri3722. Epub 2014 Jul 18. Nat Rev Immunol. 2014. PMID: 25033906 No abstract available.
  • Immunology: Fixing the odds against tuberculosis.
    Behar SM, Sassetti CM. Behar SM, et al. Nature. 2014 Jul 3;511(7507):39-40. doi: 10.1038/nature13512. Epub 2014 Jun 25. Nature. 2014. PMID: 24990740 No abstract available.
  • [Development of antituberculous drugs: current status and future prospects].
    Tomioka H, Namba K. Tomioka H, et al. Kekkaku. 2006 Dec;81(12):753-74. Kekkaku. 2006. PMID: 17240921 Review. Japanese.
  • Tuberculosis.
    Bloom BR, Atun R, Cohen T, Dye C, Fraser H, Gomez GB, Knight G, Murray M, Nardell E, Rubin E, Salomon J, Vassall A, Volchenkov G, White R, Wilson D, Yadav P. Bloom BR, et al. In: Holmes KK, Bertozzi S, Bloom BR, Jha P, editors. Major Infectious Diseases. 3rd edition. Washington (DC): The International Bank for Reconstruction and Development / The World Bank; 2017 Nov 3. Chapter 11. In: Holmes KK, Bertozzi S, Bloom BR, Jha P, editors. Major Infectious Diseases. 3rd edition. Washington (DC): The International Bank for Reconstruction and Development / The World Bank; 2017 Nov 3. Chapter 11. PMID: 30212088 Free Books & Documents. Review.

Cited by

References

    1. WHO. Tuberculosis Fact sheet N°104. 2012 http://www.who.int/mediacentre/factsheets/fs104/en/index.html.
    1. Russell DG, Barry CE, III, Flynn JL. Tuberculosis: what we don’t know can, and does, hurt us. Science. 2010;328:852–856. - PMC - PubMed
    1. Bishai W, Sullivan Z, Bloom BR, Andersen P. Bettering BCG: a tough task for a TB vaccine? Nature Med. 2013;19:410–411. - PubMed
    1. Lawn SD, Zumla AI. Tuberculosis. Lancet. 2011;378:57–72. - PubMed
    1. Gandhi NR, et al. Multidrug-resistant and extensively drug-resistant tuberculosis: a threat to global control of tuberculosis. Lancet. 2010;375:1830–1843. - PubMed

Publication types

MeSH terms