Moving beyond the hazard ratio in quantifying the between-group difference in survival analysis
- PMID: 24982461
- PMCID: PMC4105489
- DOI: 10.1200/JCO.2014.55.2208
Moving beyond the hazard ratio in quantifying the between-group difference in survival analysis
Abstract
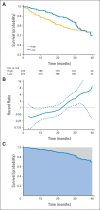
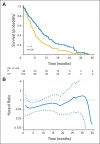
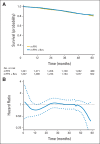
In a longitudinal clinical study to compare two groups, the primary end point is often the time to a specific event (eg, disease progression, death). The hazard ratio estimate is routinely used to empirically quantify the between-group difference under the assumption that the ratio of the two hazard functions is approximately constant over time. When this assumption is plausible, such a ratio estimate may capture the relative difference between two survival curves. However, the clinical meaning of such a ratio estimate is difficult, if not impossible, to interpret when the underlying proportional hazards assumption is violated (ie, the hazard ratio is not constant over time). Although this issue has been studied extensively and various alternatives to the hazard ratio estimator have been discussed in the statistical literature, such crucial information does not seem to have reached the broader community of health science researchers. In this article, we summarize several critical concerns regarding this conventional practice and discuss various well-known alternatives for quantifying the underlying differences between groups with respect to a time-to-event end point. The data from three recent cancer clinical trials, which reflect a variety of scenarios, are used throughout to illustrate our discussions. When there is not sufficient information about the profile of the between-group difference at the design stage of the study, we encourage practitioners to consider a prespecified, clinically meaningful, model-free measure for quantifying the difference and to use robust estimation procedures to draw primary inferences.
© 2014 by American Society of Clinical Oncology.
Conflict of interest statement
Authors' disclosures of potential conflicts of interest and author contributions are found at the end of this article.
Figures


Similar articles
-
Utilizing the integrated difference of two survival functions to quantify the treatment contrast for designing, monitoring, and analyzing a comparative clinical study.Clin Trials. 2012 Oct;9(5):570-7. doi: 10.1177/1740774512455464. Epub 2012 Aug 22. Clin Trials. 2012. PMID: 22914867 Free PMC article.
-
Interpretability of Cancer Clinical Trial Results Using Restricted Mean Survival Time as an Alternative to the Hazard Ratio.JAMA Oncol. 2017 Dec 1;3(12):1692-1696. doi: 10.1001/jamaoncol.2017.2797. JAMA Oncol. 2017. PMID: 28975263 Free PMC article.
-
Efficiency of two sample tests via the restricted mean survival time for analyzing event time observations.Biometrics. 2018 Jun;74(2):694-702. doi: 10.1111/biom.12770. Epub 2017 Sep 12. Biometrics. 2018. PMID: 28901017 Free PMC article.
-
Practical Recommendations on Quantifying and Interpreting Treatment Effects in the Presence of Terminal Competing Risks: A Review.JAMA Cardiol. 2022 Apr 1;7(4):450-456. doi: 10.1001/jamacardio.2021.4932. JAMA Cardiol. 2022. PMID: 34851356 Review.
-
Are non-constant rates and non-proportional treatment effects accounted for in the design and analysis of randomised controlled trials? A review of current practice.BMC Med Res Methodol. 2019 May 16;19(1):103. doi: 10.1186/s12874-019-0749-1. BMC Med Res Methodol. 2019. PMID: 31096924 Free PMC article. Review.
Cited by
-
Beyond hazard ratios: appropriate statistical methods for quantifying the clinical effectiveness of immune-oncology therapies - the example of the Netherlands.BMC Med Res Methodol. 2024 Oct 30;24(1):260. doi: 10.1186/s12874-024-02373-5. BMC Med Res Methodol. 2024. PMID: 39478443 Free PMC article.
-
Treatment Strategies' Impact on Progression-Free Survival According to RMST Function in Metastatic Colorectal Cancer Patients: A Retrospective Study from Romania.J Clin Med. 2024 Oct 17;13(20):6174. doi: 10.3390/jcm13206174. J Clin Med. 2024. PMID: 39458124 Free PMC article.
-
Effectiveness of immune checkpoint inhibitors and other treatment modalities in patients with advanced mucosal melanomas: a systematic review and individual patient data meta-analysis.EClinicalMedicine. 2024 Oct 4;77:102870. doi: 10.1016/j.eclinm.2024.102870. eCollection 2024 Nov. EClinicalMedicine. 2024. PMID: 39416390 Free PMC article.
-
Causal effect estimation in survival analysis with high dimensional confounders.Biometrics. 2024 Oct 3;80(4):ujae110. doi: 10.1093/biomtc/ujae110. Biometrics. 2024. PMID: 39400258
-
Comparative effectiveness of 6x R-CHOP21 versus 6x R-CHOP21 + 2 R for patients with advanced-stage diffuse large B-cell lymphoma.Blood Cancer J. 2024 Sep 12;14(1):157. doi: 10.1038/s41408-024-01137-0. Blood Cancer J. 2024. PMID: 39266543 Free PMC article.
References
-
- Kalbfleisch JD, Prentice RL. The Statistical Analysis of Failure Time Data. New York, NY: John Wiley & Sons; 1980.
-
- Cox DR, Oakes D. Analysis of Survival Data. London, United Kingdom: Chapman and Hall; 1984.
-
- Cox DR. Regression models and life tables. J R Stat Soc B. 1972;34:187–220.
-
- Higgins JP, Green S, editors. Cochrane Handbook for Systematic Reviews of Interventions. New York, NY: John Wiley & Sons; 2008.
Publication types
MeSH terms
Grants and funding
LinkOut - more resources
Full Text Sources
Other Literature Sources

