Aβ1-42 reduces P-glycoprotein in the blood-brain barrier through RAGE-NF-κB signaling
- PMID: 24967961
- PMCID: PMC4611731
- DOI: 10.1038/cddis.2014.258
Aβ1-42 reduces P-glycoprotein in the blood-brain barrier through RAGE-NF-κB signaling
Abstract
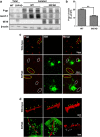
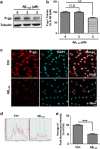
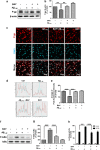
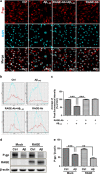
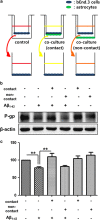
The reduced clearance of amyloid-β peptide (Aβ) from the brain partly accounts for the neurotoxic accumulation of Aβ in Alzheimer's disease (AD). Recently, it has been suggested that P-glycoprotein (P-gp), which is an efflux transporter expressed on the luminal membrane of the brain capillary endothelium, is capable of transporting Aβ out of the brain. Although evidence has shown that restoring P-gp reduces brain Aβ in a mouse model of AD, the molecular mechanisms underlying the decrease in P-gp expression in AD is largely unknown. We found that Aβ1-42 reduced P-gp expression in the murine brain endothelial cell line bEnd.3, which was consistent with our in vivo data that P-gp expression was significantly reduced, especially near amyloid plaques in the brains of five familial AD mutations (5XFAD) mice that are used as an animal model for AD. A neutralizing antibody against the receptor for advanced glycation end products (RAGE) and an inhibitor of nuclear factor-kappa B (NF-κB) signaling prevented the decrease in Aβ1-42-induced P-gp expression, suggesting that Aβ reduced P-gp expression through NF-κB signaling by interacting with RAGE. In addition, we observed that the P-gp reduction by Aβ was rescued in bEnd.3 cells receiving inductive signals or factors from astrocytes making contacts with endothelial cells (ECs). These results support that alterations of astrocyte-EC contacts were closely associated with P-gp expression. This suggestion was further supported by the observation of a loss of astrocyte polarity in the brains of 5XFAD mice. Taken together, we found that P-gp downregulation by Aβ was mediated through RAGE-NF-κB signaling pathway in ECs and that the contact between astrocytes and ECs was an important factor in the regulation of P-gp expression.
Figures

Similar articles
-
Blood-Brain Barrier Disruption Increases Amyloid-Related Pathology in TgSwDI Mice.Int J Mol Sci. 2021 Jan 27;22(3):1231. doi: 10.3390/ijms22031231. Int J Mol Sci. 2021. PMID: 33513818 Free PMC article.
-
Aβ₁₋₄₂-RAGE interaction disrupts tight junctions of the blood-brain barrier via Ca²⁺-calcineurin signaling.J Neurosci. 2012 Jun 27;32(26):8845-54. doi: 10.1523/JNEUROSCI.6102-11.2012. J Neurosci. 2012. PMID: 22745485 Free PMC article.
-
Aβ1-42 oligomer induces alteration of tight junction scaffold proteins via RAGE-mediated autophagy in bEnd.3 cells.Exp Cell Res. 2018 Aug 15;369(2):266-274. doi: 10.1016/j.yexcr.2018.05.025. Epub 2018 May 29. Exp Cell Res. 2018. PMID: 29856989
-
P-glycoprotein: a role in the export of amyloid-β in Alzheimer's disease?FEBS J. 2020 Feb;287(4):612-625. doi: 10.1111/febs.15148. Epub 2019 Dec 9. FEBS J. 2020. PMID: 31750987 Review.
-
Preventing activation of receptor for advanced glycation endproducts in Alzheimer's disease.Curr Drug Targets CNS Neurol Disord. 2005 Jun;4(3):249-66. doi: 10.2174/1568007054038210. Curr Drug Targets CNS Neurol Disord. 2005. PMID: 15975028 Review.
Cited by
-
A Fundamental Role for Oxidants and Intracellular Calcium Signals in Alzheimer's Pathogenesis-And How a Comprehensive Antioxidant Strategy May Aid Prevention of This Disorder.Int J Mol Sci. 2021 Feb 21;22(4):2140. doi: 10.3390/ijms22042140. Int J Mol Sci. 2021. PMID: 33669995 Free PMC article. Review.
-
Cellular and molecular mechanisms of the blood-brain barrier dysfunction in neurodegenerative diseases.Fluids Barriers CNS. 2024 Jul 19;21(1):60. doi: 10.1186/s12987-024-00557-1. Fluids Barriers CNS. 2024. PMID: 39030617 Free PMC article. Review.
-
Effect of Aβ protein on inhibiting proliferation and promoting apoptosis of retinal pigment epithelial cells.Int J Ophthalmol. 2018 Jun 18;11(6):929-934. doi: 10.18240/ijo.2018.06.06. eCollection 2018. Int J Ophthalmol. 2018. PMID: 29977803 Free PMC article.
-
Cell-Type-Specific Profiling of Alternative Translation Identifies Regulated Protein Isoform Variation in the Mouse Brain.Cell Rep. 2019 Jan 15;26(3):594-607.e7. doi: 10.1016/j.celrep.2018.12.077. Cell Rep. 2019. PMID: 30650354 Free PMC article.
-
Design and Synthesis of New Benzo[d]oxazole-Based Derivatives and Their Neuroprotective Effects on β-Amyloid-Induced PC12 Cells.Molecules. 2020 Nov 18;25(22):5391. doi: 10.3390/molecules25225391. Molecules. 2020. PMID: 33218007 Free PMC article.
References
-
- 1Braak H, Braak E. Neuropathological stageing of Alzheimer-related changes. Acta Neuropathol 1991; 82: 239–259. - PubMed
-
- 2Hardy J, Selkoe DJ. The amyloid hypothesis of Alzheimer's disease: progress and problems on the road to therapeutics. Science 2002; 297: 353–356. - PubMed
-
- 5Ohtsuki S, Terasaki T. Contribution of carrier-mediated transport systems to the blood-brain barrier as a supporting and protecting interface for the brain; importance for CNS drug discovery and development. Pharm Res 2007; 24: 1745–1758. - PubMed
Publication types
MeSH terms
Substances
LinkOut - more resources
Full Text Sources
Other Literature Sources
Medical
Miscellaneous

