. 2014 Jul 1;20(1):103-18.
doi: 10.1016/j.cmet.2014.05.005. Epub 2014 Jun 12.

Adipocyte inflammation is essential for healthy adipose tissue expansion and remodeling

Affiliations

Adipocyte inflammation is essential for healthy adipose tissue expansion and remodeling

Ingrid Wernstedt Asterholm et al. Cell Metab. .

Abstract

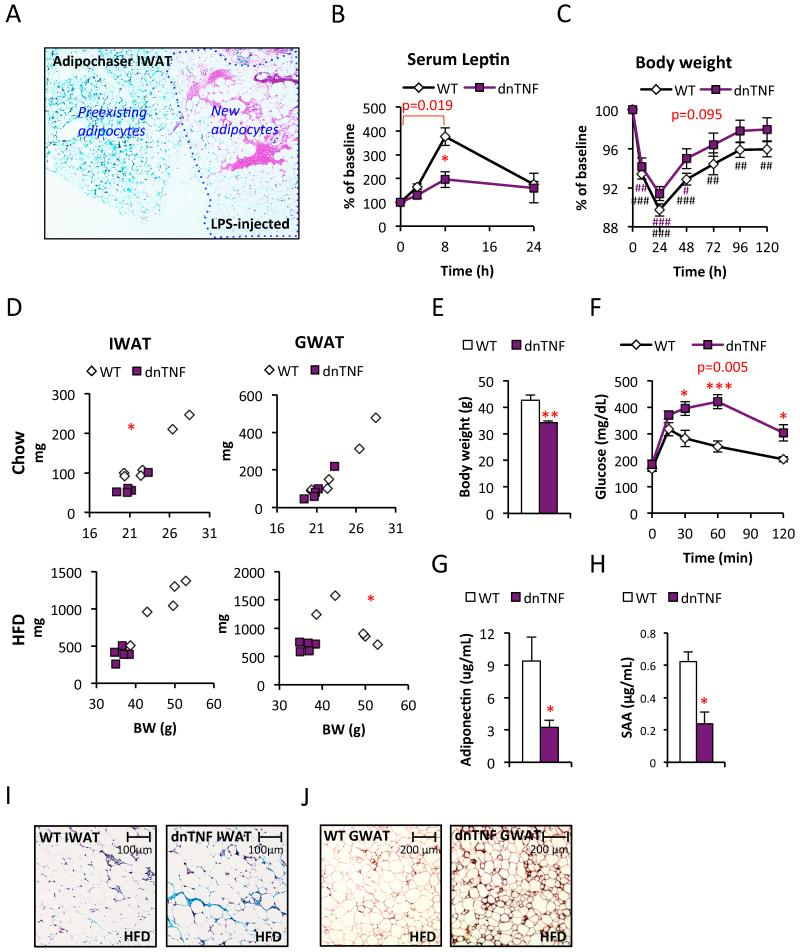
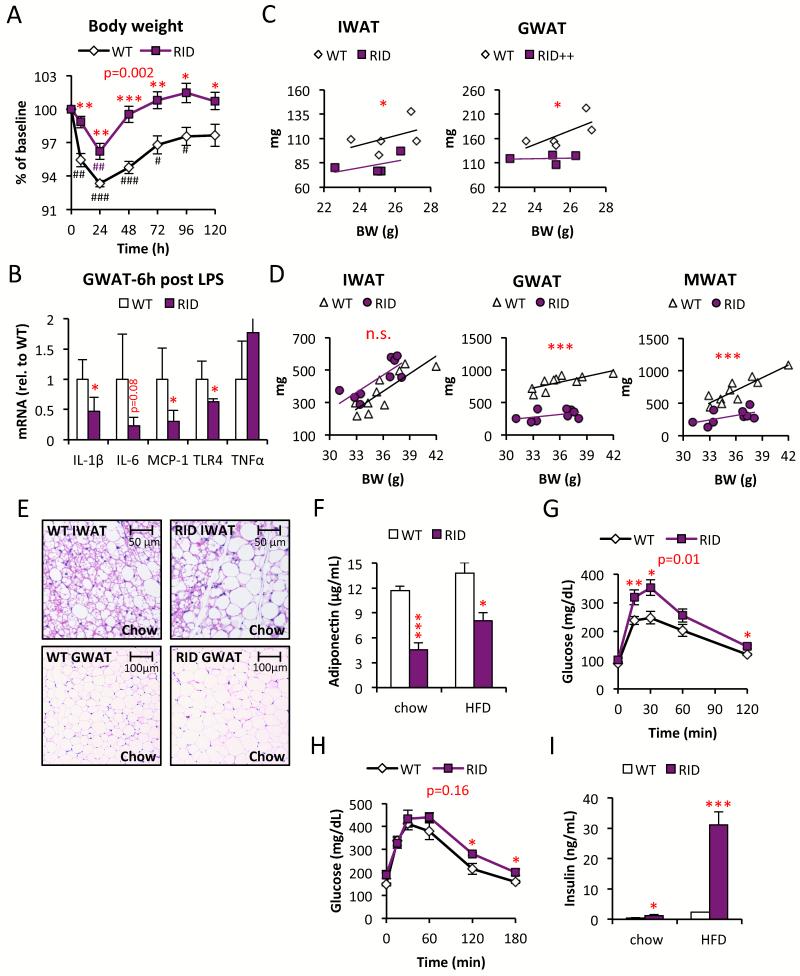
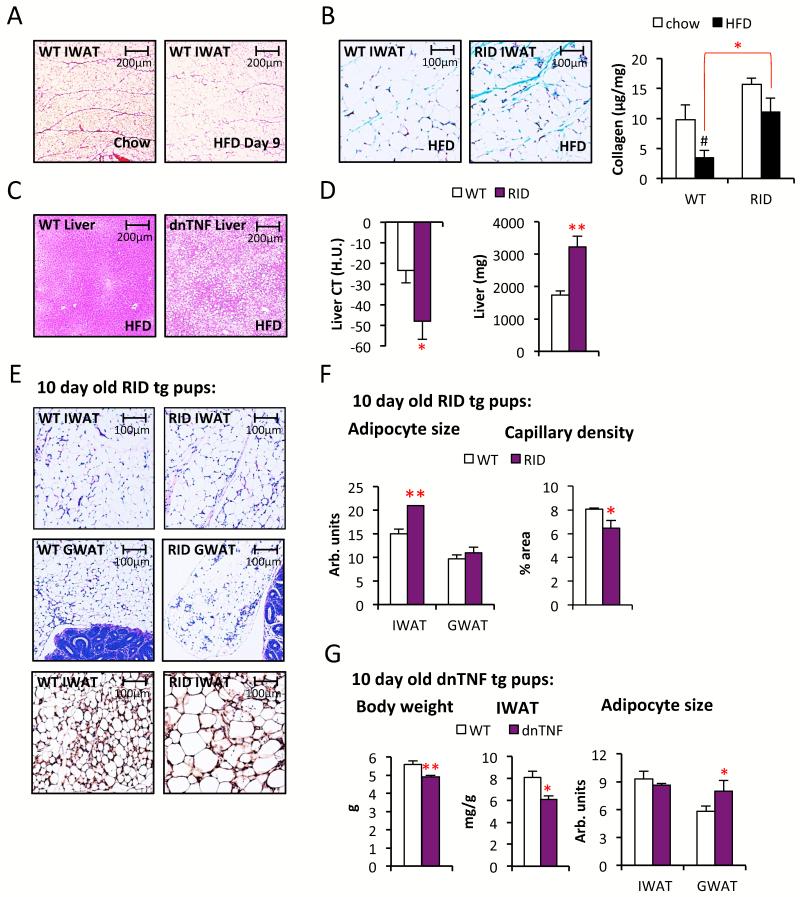
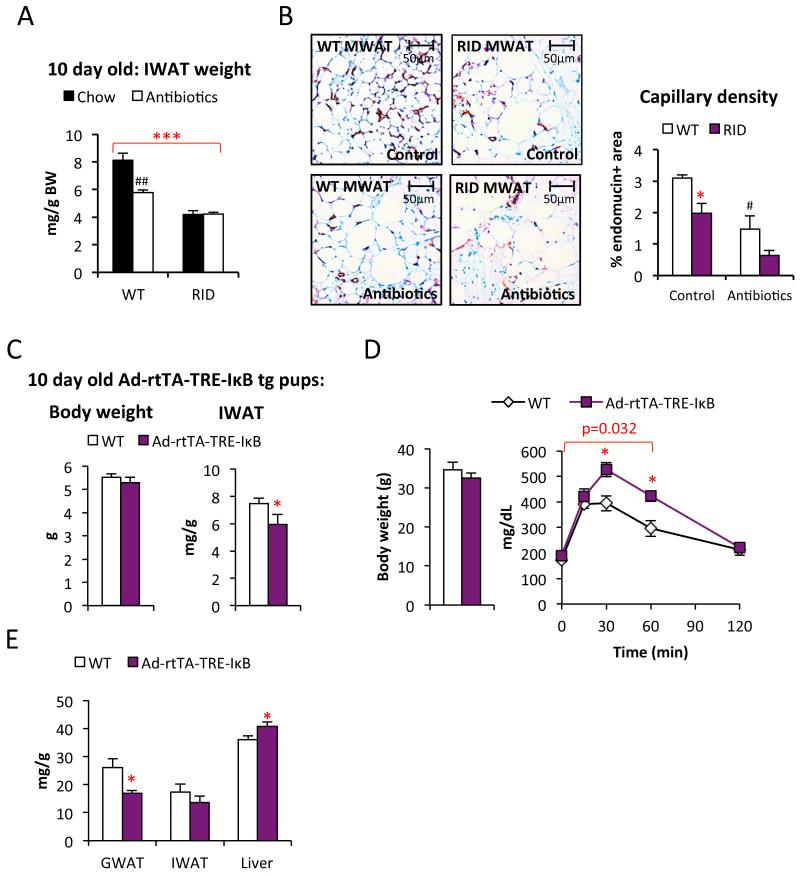
Chronic inflammation constitutes an important link between obesity and its pathophysiological sequelae. In contrast to the belief that inflammatory signals exert a fundamentally negative impact on metabolism, we show that proinflammatory signaling in the adipocyte is in fact required for proper adipose tissue remodeling and expansion. Three mouse models with an adipose tissue-specific reduction in proinflammatory potential were generated that display a reduced capacity for adipogenesis in vivo, while the differentiation potential is unaltered in vitro. Upon high-fat-diet exposure, the expansion of visceral adipose tissue is prominently affected. This is associated with decreased intestinal barrier function, increased hepatic steatosis, and metabolic dysfunction. An impaired local proinflammatory response in the adipocyte leads to increased ectopic lipid accumulation, glucose intolerance, and systemic inflammation. Adipose tissue inflammation is therefore an adaptive response that enables safe storage of excess nutrients and contributes to a visceral depot barrier that effectively filters gut-derived endotoxin.


Figures

Figure 1
Figure 1. Reduced fat mass and glucose tolerance in dnTNF tg mice
(A) X-Gal-LacZ stained LPS-injected Adipochaser IWAT (blue=preexisting adipocytes, white=new adipocytes) (B-C) Leptin and body weight change after i.p. injection with 0.3 mg/kg LPS in dnTNF tg and wildtype female mice. (D) IWAT and GWAT weight in relation to body weight in chow (top) and HFD-fed (bottom) male dnTNF tg and wildtype controls. (E-H) Body weight, glucose tolerance test, serum adiponectin and SAA-levels in male dnTNF tg and littermate controls after 11 weeks HFD-feeding. (I) Representative Trichrome stain of IWAT in male dnTNF tg and littermate controls after 11 weeks HFD-feeding. (J) Representative perilipin (red) and mac2 (brown) immunostain in GWAT after 22 weeks HFD-feeding in male dnTNF tg and littermate control. Error bars represent SEM, a p-value <0.05 according to student t-test was considered as significant and is indicated by */#; **/##: p<0.01; ***/###: p<0.001 (* = Difference in between genotype, # = Difference from initial weight). P-values in red indicate difference between groups during the indicated time course according to repeated measurement ANOVA.
Figure 2
Figure 2. Reduced fat mass and reduced glucose tolerance in RID tg mice
(A) LPS (0.3 mg/kg)-induced body weight change in male RID tg and wildtype controls. (B) Gene expression in GWAT harvested from male RID tg and wildtype controls 6h after LPS injection. (C) IWAT and GWAT in relation to body weight in chow-fed male RID tg and wildtype mice. (D) IWAT, GWAT and MWAT in relation to body weight in 15 week HFD-fed male RID tg and wildtype mice. (E) Representative H&E stain of IWAT and GWAT in male RID tg and wildtype mice on chow (F) Adiponectin levels in male RID tg and wildtype mice on chow and after 12 weeks HFD. Glucose tolerance in (G) chow-fed and (H) 12-week HFD-fed male RID tg and wildtype mice. (I) Serum-insulin levels in 3 h fasted male RID tg and wildtype mice. 1-way ANOVA analysis shows that both diet (F=8.1, p=0.013) and genotype (F=12.3, p=0.004) contribute significantly to collagen levels. Error bars represent SEM, a p-value <0.05 according to student t-test was considered as significant and is indicated by */#; **/##: p<0.01; ***/###: p<0.001 (* = Difference in between genotype, # = Difference from initial weight). P-values in red indicate difference between groups during time courses according to repeated measurement ANOVA.
Figure 3
Figure 3. Increased HFD-induced steatosis and delayed adipose tissue development in dnTNF and RID tg mice
(A) Representative Picrosirius red stain of IWAT from 8-week old C57B6 males on chow and after 9 day with HFD. (B) Representative Trichrome stain and collagen levels in IWAT of HFD-fed male RID tg and wildtype mice. (C) Representative H&E stain of liver sections from 11 weeks HFD-fed male dnTNF tg and littermate control. (D) Liver fat quantified by CT and liver weight in 11 weeks HFD-fed male RID tg and wildtype controls. (E) Representative H&E stain of IWAT and GWAT sections and endomucin immune-stain of IWAT (bottom panels) and (with quantification shown in (F)) from 10-day old male RID tg and wildtype pups. (G) Body weight, IWAT weight and adipocyte sizes in 10-day old dnTNF tg and littermate controls. Error bars represent SEM, a p-value <0.05 according to student t-test was considered as significant and is indicated by */#; **: p<0.01; ***: p<0.001 (*significantly different from WT, # significantly different from untreated controls of same genotype).
Figure 4
Figure 4. Ablation of gut microbiota affects capillary density and Ad-rtTA-TRE-IκB tg mice display reduced adipogenesis and glucose tolerance
(A) Effect of antibiotics-treatment on IWAT weight in 10-day old RID tg and wildtype pups. 1-way ANOVA analysis shows that both treatment (F=5.3, p=0.026) and genotype (F=29.4, p<0.001) contribute significantly to the IWAT weight. (B) Effect of antibiotics-treatment on capillary density in MWAT as judged by endomucin immune-stain in male RID tg and wildtype mice. 1-way ANOVA analysis shows that both treatment (F=35.1, p=0.002) and genotype (F=14.8, p=0.012) contribute significantly to capillary density in MWAT. (C) Body weight and IWAT weight in doxycycline-treated 10-day old Ad-rtTA-TRE-IκB tg and littermate controls. (D) Body weight and glucose tolerance in 8-weeks HFD-fed male Ad-rtTA-TRE-IκB tg and littermate controls. (E) Dissected tissue weight in 8-weeks HFD-fed Ad-rtTA-TRE-IκB tg and littermate controls. Error bars represent SEM, a p-value <0.05 according to student t-test was considered as significant and is indicated by */#; **/##: p<0.01; ***: p<0.001 (*significantly different from WT, # significantly different from untreated controls of same genotype). P-value in red indicates difference between groups during the indicated time course according to repeated measurement ANOVA).
Figure 5
Figure 5. Reduced β3AR-agonist-induced browning of white adipose tissue in RID tg mice
(A) Photo of IWAT and GWAT harvested from male RID tg and wildtype mice after chronic β3AR-agonist treatment (10 days with daily i.p injection with 1mg/kg in PBS). (B) Representative H&E stain of IWAT from male RID tg and wildtype mice after chronic β3AR-agonist treatment. (C) Representative BrdU immunostain of GWAT harvested after chronic β3AR-agonist treatment (co-administered with 10 mg/kg BrdU) in male RID tg and wildtype mice. Orange arrows points towards BrdU positive nuclei (D) Gene expression analyses of IWAT 3 h (acute) after β3AR-agonist injection and after chronic treatment (IWAT harvested 24 h after last injection) in male RID tg and wildtype mice. Error bars represent SEM, a p-value <0.05 according to student t-test was considered as significant and is indicated by */#; **/##: p<0.01 (*significantly different from WT, # significantly different from untreated controls of same genotype). Additional 1-way ANOVA analyses have been performed for Figure 4D (Table S3)
Figure 6
Figure 6. Leaky gut and colitis associated with signs of systemic inflammation in RID tg mice
(A) Liver fat quantified by CT in chow-fed male RID tg and wildtype mice. (B) Liver weight and (C) representative H&E stain of liver sections to show hepatocyte size in chow-fed male RID tg and wildtype mice with a body weight <30g. (D) Spleen size in chow-fed RIDs chow-fed male RID tg and wildtype mice. (E) Serum levels of anti-LPS IgG in young chow-fed vs. DSS-treated male RID tg and wildtype mice. 1-way ANOVA analysis shows that both treatment (F=78.8, p<0.001) and genotype (F=26.4, p<0.001) contribute significantly to anti-LPS IgG levels (F) Serum levels of FITC-dextran after an oral load in young chow-fed female RID tg and wildtype mice. (G) Colon weight/length ratios, representative H&E images of colon and (H) spleen weight in untreated, and in response to DSS treatment, in male RID tg and wildtype mice. 1-way ANOVA analysis shows that both treatment (F=153.6/47.3, p<0.001/<0.001) and genotype (F=27.4/13.9, p<0.001/0.05) contribute significantly to both colon thickness and spleen size. Error bars represent SEM, a p-value <0.05 according to student t-test was considered as significant and is indicated by */#; **/##: p<0.01; ***/###: p<0.001 (*significantly different from WT, # significantly different from untreated controls of same genotype). P-value in red indicates differences between groups during time course according to repeated measurement ANOVA.
Figure 7
Figure 7. Antibiotics-treatment improves the RID tg mouse phenotype
A) Gene expression analysis of proximal colon in untreated, and in response to 3 DSS treatments, in male RID tg and wildtype mice. (B) Spleen, (C) fasting serum-insulin and (D) SAA1 and 2 mRNA levels in liver in control or antibiotic-treated male RID tg and wildtype mice. 1-way ANOVA analysis shows that both treatment (F=15.8/8.7/12.1/5.8, p=0.001/0.003/0.004/0.03) and genotype (F=19.3/17.1/23.6/31.8, p<0.001/0.001/<0.001/<0.001) contribute significantly to spleen size, insulin levels, liver SAA1 and liver SAA2 levels. (E) Summary and proposed model: Acute inflammation is essential for healthy adipose tissue expansion and proper remodeling. Inability of adipose tissue to accurately sense and respond to inflammatory stimuli leads to reduced adipose tissue expansion and an increased risk for microbial translocation. Error bars represent SEM, a p-value <0.05 according to student t-test was considered as significant and is indicated by */#; **/##: p<0.01; ***: p<0.001 (*significantly different from WT, # significantly different from untreated controls of same genotype).

Comment in

Similar articles

Cited by

References

    1. Asterholm IW, McDonald J, Blanchard PG, Sinha M, Xiao Q, Mistry J, Rutkowski JM, Deshaies Y, Brekken RA, Scherer PE. Lack of “immunological fitness” during fasting in metabolically challenged animals. J Lipid Res. 2012;53:1254–1267. - PMC - PubMed
    1. Asterholm IW, Scherer PE. Enhanced metabolic flexibility associated with elevated adiponectin levels. The American journal of pathology. 2010;176:1364–1376. - PMC - PubMed
    1. Cao Y. Angiogenesis modulates adipogenesis and obesity. The Journal of clinical investigation. 2007;117:2362–2368. - PMC - PubMed
    1. Cristancho AG, Lazar MA. Forming functional fat: a growing understanding of adipocyte differentiation. Nature reviews. Molecular cell biology. 2011;12:722–734. - PMC - PubMed
    1. Engelman JA, Berg AH, Lewis RY, Lisanti MP, Scherer PE. Tumor necrosis factor alpha-mediated insulin resistance, but not dedifferentiation, is abrogated by MEK1/2 inhibitors in 3T3-L1 adipocytes. Mol Endocrinol. 2000;14:1557–1569. - PubMed

Publication types

MeSH terms

LinkOut - more resources