. 2014 Aug 15;127(Pt 16):3463-76.
doi: 10.1242/jcs.146696. Epub 2014 Jun 13.

Rassf5 and Ndr kinases regulate neuronal polarity through Par3 phosphorylation in a novel pathway

Affiliations

Rassf5 and Ndr kinases regulate neuronal polarity through Par3 phosphorylation in a novel pathway

Rui Yang et al. J Cell Sci. .

Abstract

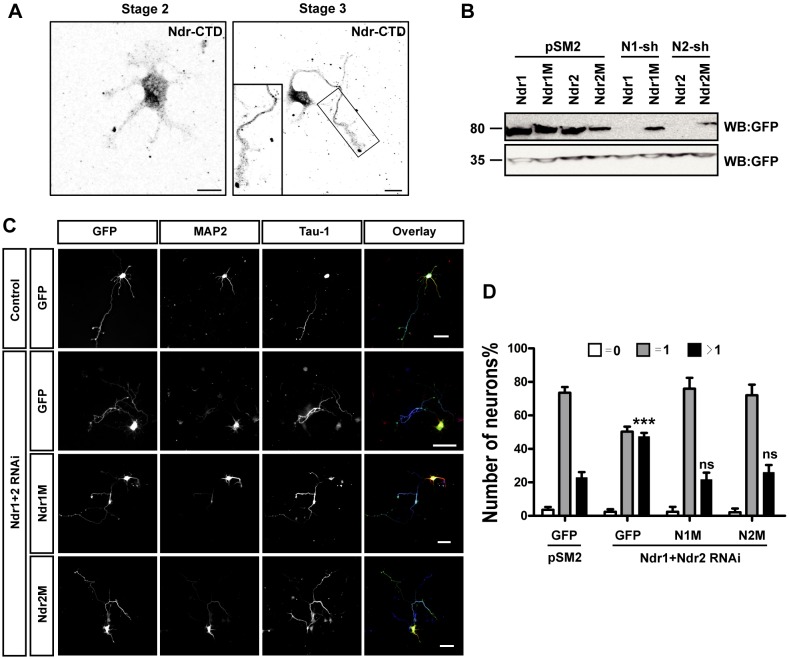
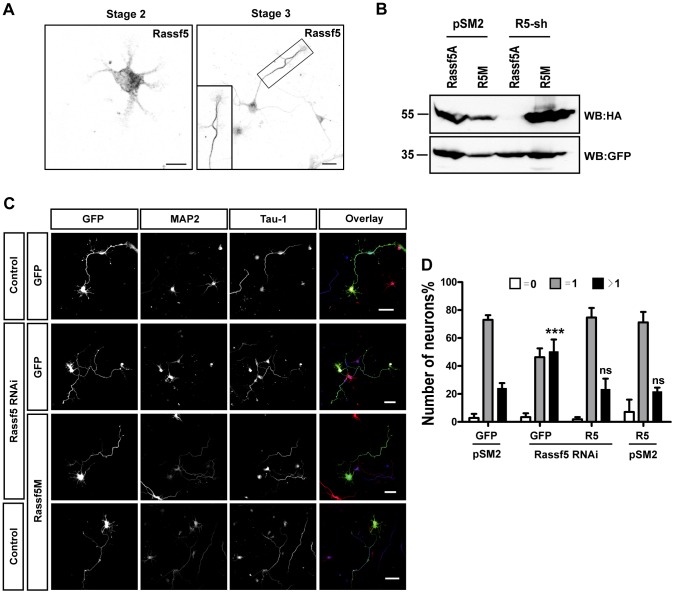
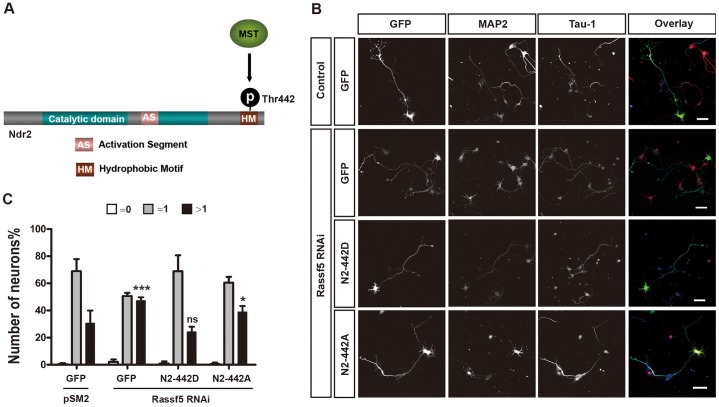
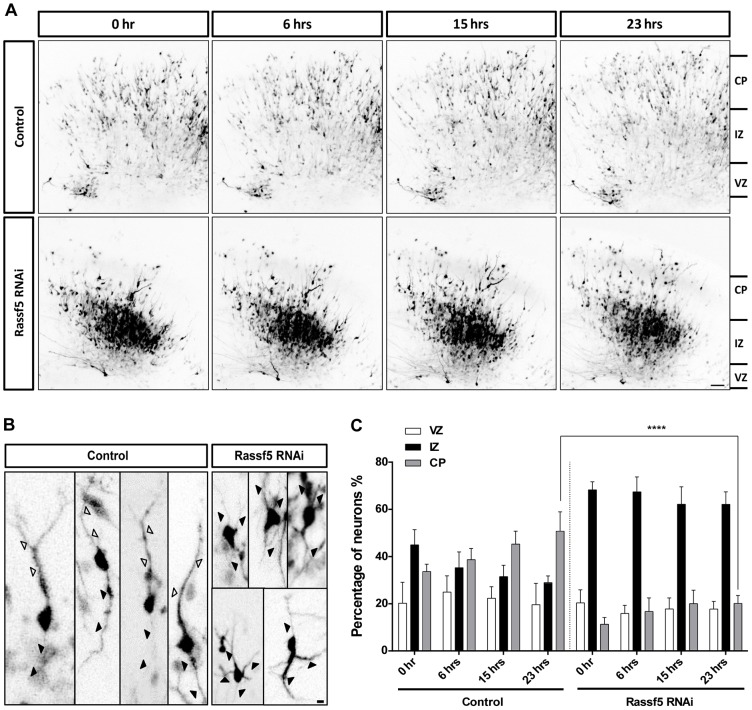
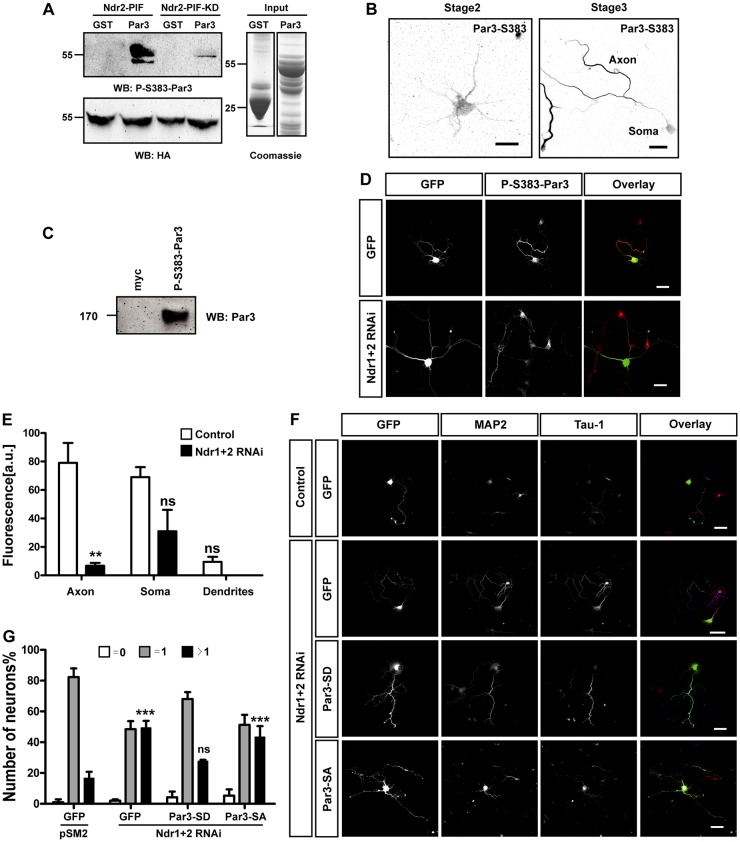
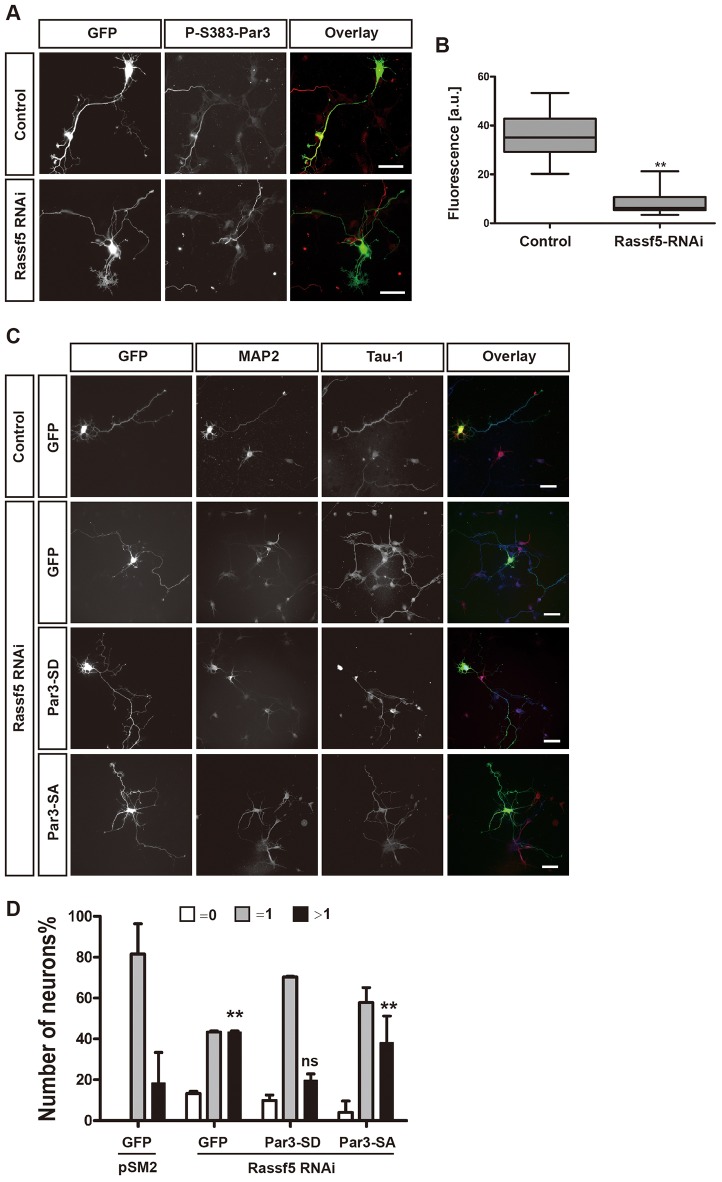
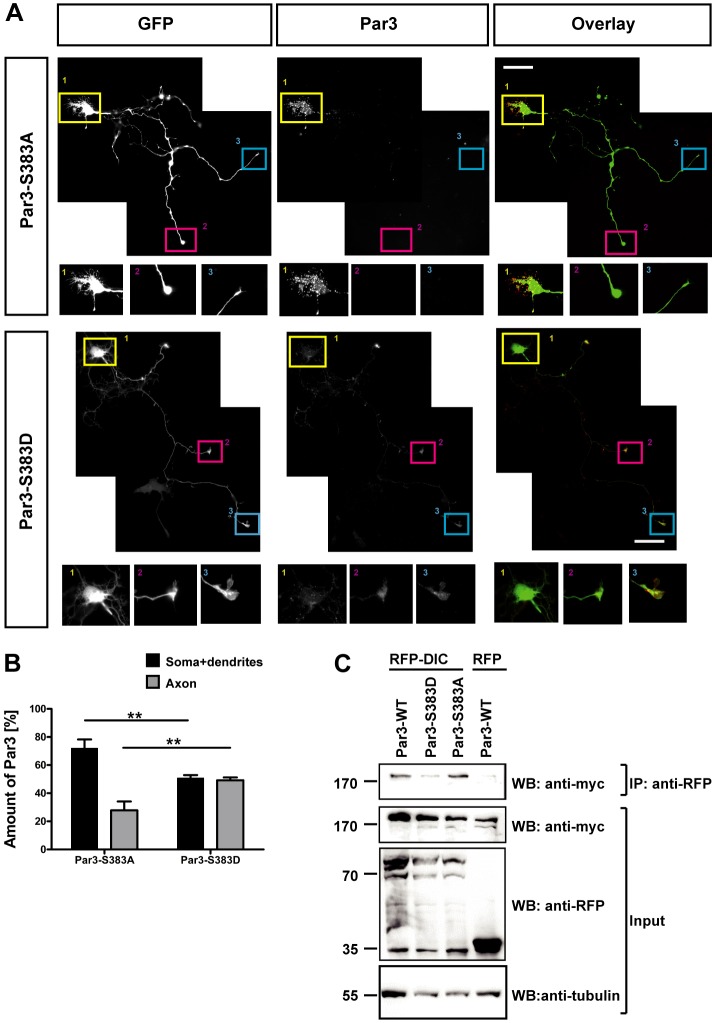
The morphology and polarized growth of cells depend on pathways that control the asymmetric distribution of regulatory factors. The evolutionarily conserved Ndr kinases play important roles in cell polarity and morphogenesis in yeast and invertebrates but it is unclear whether they perform a similar function in mammalian cells. Here, we analyze the function of mammalian Ndr1 and Ndr2 (also known as STK38 or STK38L, respectively) in the establishment of polarity in neurons. We show that they act downstream of the tumor suppressor Rassf5 and upstream of the polarity protein Par3 (also known as PARD3). Rassf5 and Ndr1 or Ndr2 are required during the polarization of hippocampal neurons to prevent the formation of supernumerary axons. Mechanistically, the Ndr kinases act by phosphorylating Par3 at Ser383 to inhibit its interaction with dynein, thereby polarizing the distribution of Par3 and reinforcing axon specification. Our results identify a novel Rassf5-Ndr-Par3 signaling cascade that regulates the transport of Par3 during the establishment of neuronal polarity. Their role in neuronal polarity suggests that Ndr kinases perform a conserved function as regulators of cell polarity.

Keywords: Axon formation; Cell polarity; Ndr kinases; Par.


Figures

Fig. 1.
Fig. 1.
Knockdown of Ndr1 and Ndr2 results in the formation of supernumerary axons. (A) Hippocampal neurons from E18 rat embryos were fixed at stage 2 and stage 3 and stained with an antibody against the Ndr-CTD. A higher magnification of the axon at stage 3 is shown in the lower-left corner. Scale bars: 10 µm. (B) HEK 293T cells were transfected with vectors for GFP, Ndr1, Ndr2 or shRNA-resistant Ndr1 (Ndr1M) or Ndr2 (Ndr2M) and shRNAs against Ndr1 (N1-sh) and Ndr2 (N2-sh) or pSM2 (control), as indicated. The expression of GFP–Ndr1 and GFP–Ndr2 was analyzed by western blotting (WB) using an anti-GFP antibody. Staining for GFP confirmed comparable transfection efficiencies and protein loading. (C) Hippocampal neurons were transfected at 0 DIV with vectors for GFP (green), shRNA-resistant Ndr1 (Ndr1M, N1M) or Ndr2 (Ndr2M, N2M) and shRNAs directed against Ndr1 and Ndr2 (Ndr1+2 RNAi). Neurons were fixed at 3 DIV and stained with the Tau-1 antibody (blue in overlay) and an anti-MAP2 antibody (red in overlay). Scale bars: 50 µm. (D) The percentage of unpolarized neurons without an axon (0, white), polarized neurons with a single axon (1, gray) and neurons with multiple axons (>1, black) is shown. Values are the mean±s.e.m. (three transfections, n>100); ns, non-significant; ***P≤0.001 compared with control (GFP+pSM2); two-way ANOVA.
Fig. 2.
Fig. 2.
Rassf5 is required for neuronal polarity. (A) Neurons from the hippocampus of E18 rat embryos were fixed at stage 2 and stage 3, and stained with the anti-Rassf5 antibody. A higher magnification of the axon at stage 3 is shown in the lower-left corner. Scale bars: 10 µm. (B) HEK 293T cells were transfected with vectors for GFP, HA–Rassf5A, shRNA-resistant HA–Rassf5A (R5M) and an shRNA against Rassf5 (R5-sh) or pSM2 (control), as indicated. The expression of Rassf5A was analyzed by western blotting (WB) using an anti-HA antibody. Staining for GFP confirmed comparable transfection efficiencies and protein loading. (C) Hippocampal neurons were transfected at 0 DIV with vectors for GFP (green), shRNA-resistant Rassf5A (R5M) and an shRNA against Rassf5 or pSM2 (control). Neurons were fixed at 3 DIV and stained with the Tau-1 antibody (blue in overlay) and an anti-MAP2 antibody (red in overlay). Scale bars: 50 µm. (D) The percentage of unpolarized neurons without an axon (0, white), polarized neurons with a single axon (1, gray) and neurons with multiple axons (>1, black) is shown. Values are the mean±s.e.m. (three transfections, n>150); ns, non-significant; ***P≤0.001 compared with control (GFP+pSM2); two-way ANOVA.
Fig. 3.
Fig. 3.
Ndr2-T442D is sufficient to rescue the suppression of Rassf5. (A) Schematic representation of Ndr2. Mst kinases phosphorylate Ndr2 at Thr442 (p) and activate its kinase activity. (B) Hippocampal neurons were transfected at 0 DIV with vectors for GFP (green), phospho-mimic Ndr2-Thr442 (N2-442D), non-phosphorylatable Ndr2-Thr442 (N2-442A) and an shRNA against Rassf5 or pSM2 (control), as indicated. Neurons were fixed at 3 DIV and stained with the Tau-1 antibody (blue) and an anti-MAP2 antibody (red). Scale bars: 50 µm. (C) The percentage of unpolarized neurons without an axon (0, white), polarized neurons with a single axon (1, gray) and neurons with multiple axons (>1, black) is shown. Values are the mean±s.e.m. (three transfections, n>150 neurons); ns, non-significant; *P<0.05; ***P≤0.001, compared with control (GFP+pSM2); two-way ANOVA.
Fig. 4.
Fig. 4.
The knockdown of Rassf5 interferes with the polarization of neurons. (A–C) E14.5 brains were transfected by ex vivo electroporation with empty pCAGGS-U6 (control) or pCAGGS-U6-Rassf5 with an shRNA against Rassf5 (Rassf5 RNAi), and live-cell imaging of slice cultures was performed at 36 h after electroporation. (A) Representative images (maximum-intensity projection) of cortical slices at the indicated time-points are shown. CP, cortical plate; IZ, intermediate zone; VZ, ventricular zone. Scale bars: 50 µm. (B) Representative images (maximum-intensity projection) of transfected neurons after 23 h of live-cell imaging from control and Rassf5-knockdown slices are shown. Open arrowheads mark leading processes, black arrowheads mark trailing axons or processes of unpolarized neurons after knockdown of Rassf5. Scale bars: 10 µm. (C) The percentage of GFP-positive cells in the ventricular and subventricular zone (VZ), intermediate zone and cortical plate at 0, 6, 12 and 23 h is shown. Values are the mean±s.e.m. (three experiments, n = 200–400 neurons per time-point); ****P<0.0001 compared with control; two-way ANOVA.
Fig. 5.
Fig. 5.
Ndr kinases phosphorylate Par3 at Ser383. (A) Bacterially expressed GST or GST–Par3-PDZ1 (Par3) were purified (input, Coomassie Blue staining) and incubated with HA–Ndr2-PIF or HA–Ndr2-PIF-KD isolated from HEK 293T cells for an in vitro phosphorylation assay. Par3 phosphorylation was analyzed by western blotting (WB) using antibody against phosphorylated (P)-Ser383-Par3 antibody (upper panel). Blotting for HA confirmed comparable expression of Ndr2 constructs (lower panel). Numbers indicate the molecular mass in kDa. (B) Hippocampal neurons were stained with the anti-phospho-Ser383-Par3 antibody at stage 2 (unpolarized neuron, scale bar: 20 µm) and stage 3 (polarized neuron, scale bar: 50 µm). (C) Par3 was immunoprecipitated from lysates of E18 rat brain using the anti-phospho-S383-Par3 or an anti-Myc antibody as negative control, and the precipitation of phosphorylated protein was detected with an anti-Par3 antibody. (D) Hippocampal neurons were transfected at 0 DIV with vectors for GFP (green in overlay) and pSM2 (control), and shRNAs for Ndr1 and 2 (Ndr1+2 RNAi), fixed at 3 DIV and stained with the anti-phospho-Ser-383Par3 antibody (red in overlay). Scale bars: 50 µm. <@?show=[to]?>(E) The intensity of the immunofluorescence signal in the axon, soma and dendrites for staining with the anti-phospho-Ser383-Par3 antibody was quantified in arbitrary units (a.u.; control, white bars; Ndr1+2 RNAi, black bars). Values are the mean±s.e.m. (n>10); ns, non-significant; **P≤0.01 compared with control; two-way ANOVA. (F) Hippocampal neurons were transfected at 0 DIV with vectors for GFP (green), phospho-mimic Par3-S383,1196D (Par3-SD) or non-phosphorylatable Par3-S383,1196A (Par3-SA) and shRNAs directed against Ndr1 and Ndr2 (Ndr1+2 RNAi) or pSM2 (control), as indicated. Neurons were fixed at 3 DIV and stained with the Tau-1 antibody (blue in overlay) and an anti-MAP2 antibody (red in overlay). Scale bars: 50 µm. (G) The percentage of unpolarized neurons without an axon (0, white), polarized neurons with a single axon (1, gray) and neurons with multiple axons (>1, black) is shown. Values are the mean±s.e.m. (three transfections, n>180 neurons); ns, non-significant; ***P≤0.001 compared with the control (GFP+pSM2); two-way ANOVA.
Fig. 6.
Fig. 6.
The phospho-mimic Par3-S383,1196D is sufficient to rescue the effects of Rassf5 knockdown. (A) Hippocampal neurons were transfected at 0 DIV with vectors for GFP (green) and an shRNA against Rassf5 (Rassf5 RNAi) or pSM2 (control). Neurons were fixed at 3 DIV and stained with antibody against phosphorylated (P)-Ser-383Par3 antibody (red in overlay). (B) The intensity of the immunofluorescence for staining with the anti-phospho-Ser383-Par3 antibody was quantified in arbitrary units (a.u.). Boxes show the median (midline), 25th percentile (control, 29.22; Rassf5-shRNA, 5) and 75th percentile (control, 43; Rassf5-shRNA, 11). Whiskers show the minimum and maximum (control, 20 to 53; Rassf5-shRNA, 3 to 21). n = 7; **P≤0.01 compared with control (Student's t-test). (C) Hippocampal neurons were transfected at 0 DIV with vectors for GFP (green), Par3-S383,1196A (Par3-SA) or Par3-S383,1196D (Par3-SD) and an shRNA against Rassf5 or pSM2 (control), as indicated. Neurons were stained at 3 DIV with the Tau-1 antibody (blue in overlay) and an anti-MAP2 antibody (red in overlay). Scale bars: 50 µm. (D) The percentage of unpolarized neurons without an axon (0, white), polarized neurons with a single axon (1, gray) and neurons with multiple axons (>1, black) is shown. Values are the mean±s.e.m. (three transfections, n>180 neurons); ns, non-significant; **P≤0.01 compared with the control (GFP+pSM2); two-way ANOVA.
Fig. 7.
Fig. 7.
Par3-S383A and Par3-S383D show different patterns of subcellular localization. (A) Hippocampal neurons were transfected at 0 DIV with vectors encoding GFP and Myc–Par3-S383A or Myc–Par3-S383D. Neurons were fixed at 3 DIV and stained with an anti-Myc antibody (Par3). A higher magnification of the areas marked by squares is shown below each image. Scale bars: 50 µm. (B) The relative intensity of the immunofluorescence in the axon (gray bars) or soma and dendrites (black bars) for staining with the anti-phospho-Ser383-Par3 antibody was quantified as the percentage of the total signal for phospho-Ser383-Par3. Values are the mean±s.e.m. (n = 6); **P<0.01 between indicated pairs; two-way ANOVA. (C) RFP–Dlic2 (DIC) or RFP (negative control) were coexpressed with Myc-tagged wild-type (WT) Par3, phospho-mimic Par3-S383D or non-phosphorylatable Par3-S383A in HEK 293T cells. Dlic2 was immunoprecipitated (IP) from cell lysates with an anti-RFP antibody, and the bound proteins were detected by western blotting (WB) using an anti-Myc antibody. Blotting for RFP, Myc and tubulin (input) confirmed that comparable amounts of proteins were expressed and loaded. Numbers indicate the molecular mass in kDa.

Similar articles

Cited by

References

    1. Arimura N., Kaibuchi K. (2007). Neuronal polarity: from extracellular signals to intracellular mechanisms. Nat. Rev. Neurosci. 8, 194–205 10.1038/nrn2056 - DOI - PubMed
    1. Banker G. A., Cowan W. M. (1977). Rat hippocampal neurons in dispersed cell culture. Brain Res. 126, 397–425 10.1016/0006-8993(77)90594-7 - DOI - PubMed
    1. Barnes A. P., Polleux F. (2009). Establishment of axon-dendrite polarity in developing neurons. Annu. Rev. Neurosci. 32, 347–381 10.1146/annurev.neuro.31.060407.125536 - DOI - PMC - PubMed
    1. Bichsel S. J., Tamaskovic R., Stegert M. R., Hemmings B. A. (2004). Mechanism of activation of NDR (nuclear Dbf2-related) protein kinase by the hMOB1 protein. J. Biol. Chem. 279, 35228–35235 10.1074/jbc.M404542200 - DOI - PubMed
    1. Calvisi D. F., Ladu S., Gorden A., Farina M., Conner E. A., Lee J. S., Factor V. M., Thorgeirsson S. S. (2006). Ubiquitous activation of Ras and Jak/Stat pathways in human HCC. Gastroenterology 130, 1117–1128 10.1053/j.gastro.2006.01.006 - DOI - PubMed

Publication types

Substances