. 2014 Jun 10:5:4082.
doi: 10.1038/ncomms5082.

Oxytocin is an age-specific circulating hormone that is necessary for muscle maintenance and regeneration

Affiliations

Oxytocin is an age-specific circulating hormone that is necessary for muscle maintenance and regeneration

Christian Elabd et al. Nat Commun. .

Abstract

The regenerative capacity of skeletal muscle declines with age. Previous studies suggest that this process can be reversed by exposure to young circulation; however, systemic age-specific factors responsible for this phenomenon are largely unknown. Here we report that oxytocin--a hormone best known for its role in lactation, parturition and social behaviours--is required for proper muscle tissue regeneration and homeostasis, and that plasma levels of oxytocin decline with age. Inhibition of oxytocin signalling in young animals reduces muscle regeneration, whereas systemic administration of oxytocin rapidly improves muscle regeneration by enhancing aged muscle stem cell activation/proliferation through activation of the MAPK/ERK signalling pathway. We further show that the genetic lack of oxytocin does not cause a developmental defect in muscle but instead leads to premature sarcopenia. Considering that oxytocin is an FDA-approved drug, this work reveals a potential novel and safe way to combat or prevent skeletal muscle ageing.


Figures

Figure 1
Figure 1. Systemic oxytocin declines with age and oxytocin receptor is expressed in skeletal muscle satellite cells
a, OT plasmatic levels were quantified by Enzyme Immunoassay in young (2-4 month old) and aged (18-24 month old) C57BL/6 male mice. Data represent mean ± SEM (n=6 young versus n=7 old). Two-tailed unpaired Student’s t test **: p value < 0.01. b and c, Whole skeletal muscle (GA) protein extracts (b), and hind limb satellite cell protein extracts (c) were prepared from young and old non-injured mice. Oxytocin receptor (OTR), Pax7, and myosin heavy chain (MHC) were assayed by western blot analysis. 30 μg of protein were loaded per lane and β-actin was used as a loading control. In b and c, Y-SKM: young skeletal muscle; O-SKM: old skeletal muscle; Y-SC: young satellite cell; O-SC: old satellite cell. d and e, Quantification of western blot from b, and c, using Image J software. Data represent mean +/− SEM (n=4 Y-SKM, n=4 O-SKM, n=3 Y-SC, and n=3 O-SC). Two-tailed unpaired Student’s t test *: p value < 0.05. f, Cross sections from non-injured and 3 day-injured tibialis anterior muscle were immunostained for OTR and dystrophin or OTR and Pax7, as indicated, and counterstained with DAPI. IgG control are displayed (bottom) and dashed lines delineate muscle fibers. Scale bars represent 20 μm.
Figure 2
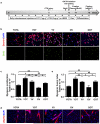
Figure 2. Age-specific systemic oxytocin decline plays a key role in the defective muscle regeneration observed upon aging
a, Schematic of the experimental procedure. Cardiotoxin (CTX) muscle injury was performed at day 0. Four days before muscle injury and over the course of the experiment, mice were administered OT (1 μg g−1 of mice), OTA (2 μg g−1 of mice), or vehicle (HBSS) daily. Five days after muscle injury, mice were killed and (GA) muscles were dissected. 10 μm cross sections were stained for hematoxylin and eosin (H&E). b, Hematoxylin and eosin (H&E) (top) and eMyHC (bottom) staining of cardiotoxin-injured gastrocnemius muscle cross sections from mice injected with OT, OTA, or vehicle (HBSS). Scale bars represent 50 μm. c, Muscle regeneration was quantified by scoring the number of newly-formed fibers (eMyHC positive fibers with centrally-located nuclei) in the injured area of gastrocnemius cross sections. Data represent mean ± SEM (n=9 YV, n=5 OV, n=6 YOT, n=6 OOT, n=5 YOTA). One-way ANOVA with post-hoc Newman-Keuls test **: p value < 0.01, ***: p value < 0.001, NS: Not Significant. d, Fibrosis quantification of gastrocnemius muscle cross sections 5 days after injury. The fibrotic index represents the percentage of the injury area occupied by connective tissue. Data represent mean ± SEM (n=3 YV, n=3 OV, n=3 YOT, n=3 OOT, n=3 YOTA). One-way ANOVA with post-hoc Newman-Keuls test *: p value < 0.05, **: p value < 0.01, NS: Not Significant. In b-d, YOTA: Young injected with OTA; YOT: Young injected with OT; YV: Young injected with vehicle, OV: Old injected with vehicle; OOT: Old injected with OT.
Figure 3
Figure 3. Oxytocin improves muscle stem cell proliferation in vivo after injury
a, Schematic of the experimental procedure. Cardiotoxin (CTX) muscle injury was performed at day 0. Six days before muscle injury and over the course of the experiment, mice were administered OT (1 μg g−1 of mice), or vehicle (HBSS) daily. Twelve hours prior to euthanasia, mice were administered with BrdU (50 μg g−1 of mice, IP). Three days after muscle injury, tibialis anterior (TA) muscles were isolated. b, Representative micrographs of 3-day-injured TA muscle cross sections (10 μm) immunostained for BrdU and Desmin and counterstained with DAPI. Right panels represent magnifications of the dashed area from left panels. White arrow indicates a BrdU and Desmin double positive cell, yellow and white arrowheads indicate BrdU or Desmin single positive cells, respectively. Scale bars represent 100 μm (left panels) and 50 μm (right panels). c, Quantification of the percentage of proliferating myogenic cells (Desmin+ and BrdU+). Data represent mean ± SEM (n=4 YV, n=4 OV, n=4 OOT), one-way ANOVA with post-hoc Newman-Keuls test *: p value < 0.05, **: p value < 0.01.
Figure 4
Figure 4. Oxytocin rejuvenates muscle stem cell function in injured tissue
a, Schematic of the experimental procedure. Cardiotoxin (CTX) muscle injury was performed at day 0. Six days before muscle injury and over the course of the experiments, mice were administered OT (1 μg g−1 of mice), OTA (2 μg g−1 of mice), or vehicle (HBSS) daily. Twelve hours prior to euthanasia, mice were administered with BrdU (50 μg g−1 of mice, IP). Three days after muscle injury, GA and TA muscles were isolated and digested into bulk fibers. Cells were cultured in their mouse’s respective sera (shortened as “own” on the schematic) for 24 hours and either fixed and stained for Desmin and BrdU or induced to differentiate for 48 hours and subsequently fixed and stained for eMyHC. b and c, Myogenic cell proliferation. Muscle fiber associated activated satellite cells were isolated 3 days after injury from mice injected with OT, OTA, or vehicle (HBSS), plated in media containing their mouse’s respective sera and fixed 24 hours after plating. b, Representative micrographs of cells immunostained for Desmin and BrdU and counterstained with DAPI. Scale bars represent 50 μm. c, Quantification of the percentage of proliferating myogenic cells (Desmin+ and BrdU+). Data represent mean ± SEM (n=6 YV, n=3 OV, n=3 YOT, n=3 OOT, n=5 YOTA). d and e, Myogenic fusion index. Muscle fiber associated activated satellite cells were isolated 3 days after injury from mice injected with OT, OTA, or vehicle (HBSS), and plated in media containing their mouse’s respective sera for 24 hours. Cells were then induced to differentiate in mitogen-low fusion medium for 48 hours, fixed and immunostained for eMyHC using DAPI to label all nuclei. d, Representative micrographs. Scale bar represents 50 μm. e, Quantification of the percentage of nuclei in eMyHC+ myotubes. Data represent mean ± SEM (n=8 YV, n=5 OV, n=6 YOT, n=6 OOT, n=5 YOTA). In b-e YOTA: Young injected with OTA; YOT: Young injected with OT; YV: Young injected with vehicle, OV: Old injected with vehicle; OOT: Old injected with OT. One-way ANOVA with post-hoc Newman-Keuls test *: p value < 0.05, **: p value < 0.01, ***: p value < 0.001, NS: Not Significant.
Figure 5
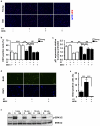
Figure 5. Oxytocin improves myogenic progenitor cell proliferation via activation of the MAPK/ERK pathway
a and b, Activated satellite cells were isolated 3 days after injury from young or old mice, cultured for 24 hours in media containing their own mouse’s respective sera supplemented with OT (30 nM), PD98059 MEK inhibitor (50 μM), or OT plus MEK inhibitor, fixed and stained for Ki67 and counterstained for DAPI. a, Representative micrographs. Scale bars represent 200 μm. b, Quantification of the percentage of proliferating (Ki67+) satellite cells. Data represent mean ± SEM (n=4 mice per group). Two-way ANOVA with post-hoc Bonferroni test **: p value < 0.01, ***: p value < 0.001, NS: Not Significant. c, p21 mRNA relative expression analyzed by qRT-PCR. RNA was extracted from satellite cells isolated and cultured as in a. GAPDH was used as reference gene (n=3 mice per group). Two-way ANOVA with post-hoc Bonferroni test **: p value < 0.01, ***: p value < 0.001, NS: Not Significant. d and e, Primary myogenic progenitors were cultured in the presence or absence of OT (30 nM), and UO126 MEK inhibitor (10 μM) for 48 hours. BrdU was added to the culture medium during the last hour. Cells were then fixed, immunostained for BrdU and counterstained with DAPI. d, Representative micrographs. Scale bars represent 50 μm. e, The percentages of BrdU positive cells were scored. Data represent mean ± SEM (n= 8 independent experiment performed on different primary cultures). One-way ANOVA with post-hoc Newman-Keuls test ***: p value < 0.001, NS: Not Significant. f, Primary myogenic progenitors were serum starved overnight then treated with OT (30 nM), or OT (30 nM) plus UO126 MEK inhibitor (10 μM) for up to 20 minutes. ERK1/2 and phospho-ERK1/2 were assayed by western blot analysis. O: OT, OM: OT plus UO126 MEK inhibitor.
Figure 6
Figure 6. Impaired muscle regeneration in mice lacking oxytocin
a, Hematoxylin and eosin staining (H&E) (top) and eMyHC (bottom) of cardiotoxin-injured gastrocnemius muscle cross sections from 12-month-old wild type (WT) and Ot knockout (KO) mice. Scale bars represent 50 μm. b, Muscle regeneration quantification of 3-month-old and 12-month-old WT or Ot KO mice was performed by scoring the number of newly-formed fibers (eMyHC positive fibers with centrally-located nuclei) in the injured area of gastrocnemius cross sections. Data represent mean ± SEM (n=6 WT and n=4 KO for the 3 month old mice, n=4 WT and n=5 KO for the 12 month old). Two-way ANOVA with post-hoc Bonferroni test *: p value < 0.05, NS: Not Significant. c, Quantification of the percentage of proliferating myogenic cells (Desmin+ and BrdU+) of 3-day-injured TA muscle cross sections immunostained for BrdU and Desmin. Data represent mean ± SEM (n=5 WT, n=5 KO). Two-tailed unpaired Student’s t test *: p value < 0.05. d, Fibrosis quantification of gastrocnemius muscle cross sections 5 days after injury. The fibrotic index represents the percentage of the injury area occupied by connective tissue. Data represent mean ± SEM (n=4 WT and n=4 KO). Two-tailed unpaired Student’s t test *: p value < 0.05. e, Representative micrograph of perilipin immunostaining on 5-day-cardiotoxin-injured gastrocnemius muscle cross section. Scale bar represents 50 μm. f and g, Adipocyte numbers (perilipin positive cells) per injured (f) or un-injured (g) area from WT and Ot KO mice. Data represent mean ± SEM (n=3 WT and n=5 KO). Two-tailed unpaired Student’s t test, NS: Not Significant.
Figure 7
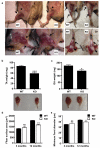
Figure 7. Mice lacking oxytocin develop premature sarcopenia
a, Representative photographs of Ot KO and WT mice hind limb skeletal muscles (right leg) after the skin was carefully removed (WT and KO mice are presented side by side on each photograph). Visualization of perimuscular adipose tissue deposition (arrows) and of exposed intermuscular adipose tissue (arrowheads). (i) Ventral view, arrows indicate the adipose tissue on the internal part of the quadriceps. The star shows that Ot KO mice display increased posterior subcutaneous adipose tissue. (ii) Ventral view showing adipose tissue deposition over the quadriceps (top arrows) and the tibialis anterior (bottom arrows). (iii) Lateral view showing adipose tissue deposition covering the quadriceps (top arrows) and the tibialis anterior and gastrocnemius (bottom arrows). (iv) Dorsal view showing the intermuscular adipose tissue deposition of the hind leg (arrowheads) and the adipose tissue covering the gastrocnemius muscle (arrows). As compared to the WT littermates, the KO mice have an increase in fat tissue in all the studied muscle groups, and visibly reduced muscle, which is studied in more detail and quantified below. b, TA and c, GA muscles from 12-month-old WT or Ot KO mice were weighed. Data represent mean ± SEM (top), representative pictures (bottom). Two-tailed unpaired Student’s t test *: p value < 0.05, ***: p value < 0.001, n=5 WT and n=10 KO mice. d, The surface area and e, The minimum Feret’s diameter were measured using WT and Ot KO muscle cross section stained with Hematoxylin and eosin. Data represent mean ± SEM (n=4 mice per group), two-way ANOVA with post-hoc Bonferroni test *: p value < 0.05, **: p value < 0.01, NS: Not Significant.

Similar articles

Cited by

References

    1. Berger MJ, Doherty TJ. Sarcopenia: prevalence, mechanisms, and functional consequences. Interdiscip Top Gerontol. 2010;37:94–114. - PubMed
    1. Walston JD. Sarcopenia in older adults. Current Opinion in Rheumatology. 2012;24:623–627. - PMC - PubMed
    1. Conboy IM, Rando TA. Heterochronic parabiosis for the study of the effects of aging on stem cells and their niches. Cell Cycle. 2012;11:2260–2267. - PMC - PubMed
    1. Conboy IM, et al. Rejuvenation of aged progenitor cells by exposure to a young systemic environment. Nature. 2005;433:760–764. - PubMed
    1. Brack AS, et al. Increased Wnt signaling during aging alters muscle stem cell fate and increases fibrosis. Science. 2007;317:807–810. - PubMed

Publication types