Salicylate-induced auditory perceptual disorders and plastic changes in nonclassical auditory centers in rats
- PMID: 24891959
- PMCID: PMC4033555
- DOI: 10.1155/2014/658741
Salicylate-induced auditory perceptual disorders and plastic changes in nonclassical auditory centers in rats
Abstract
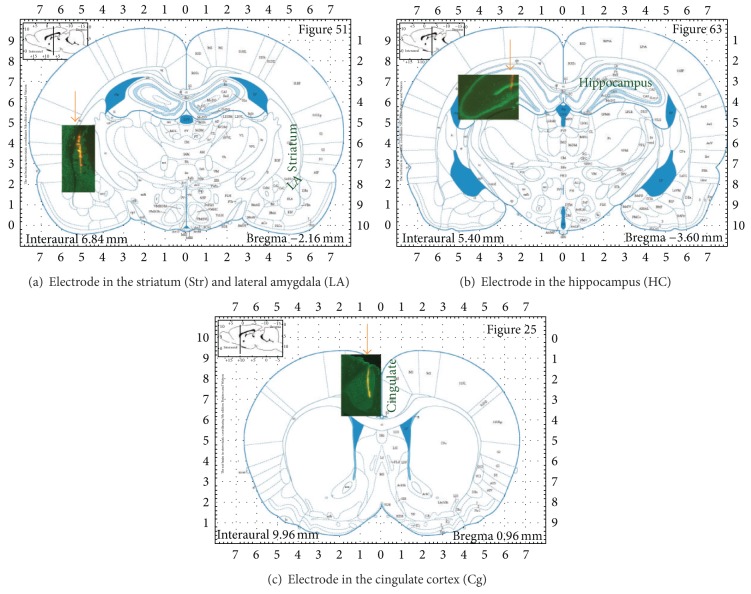
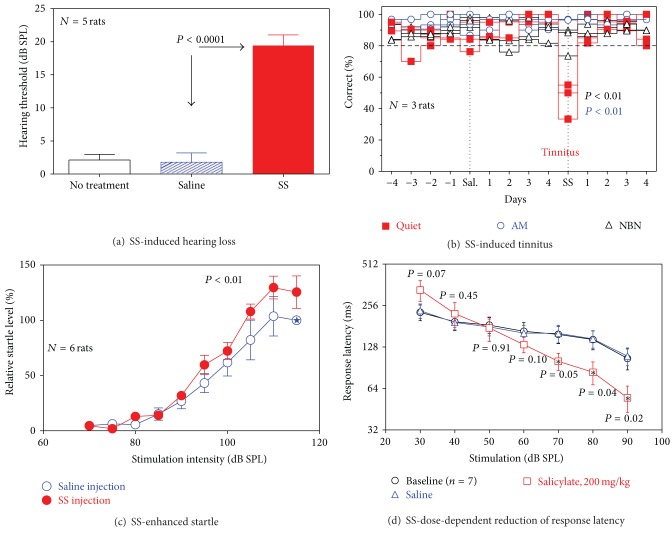
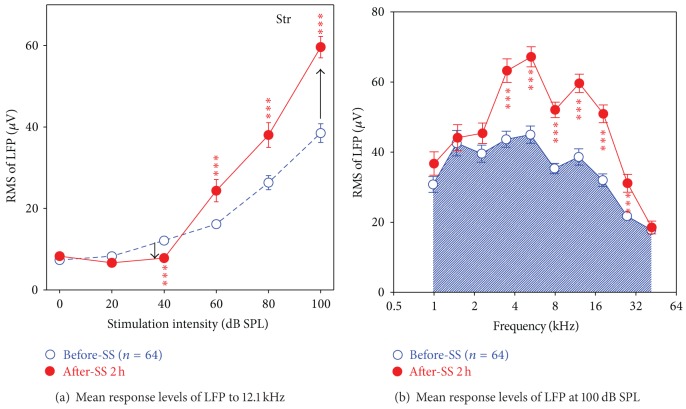
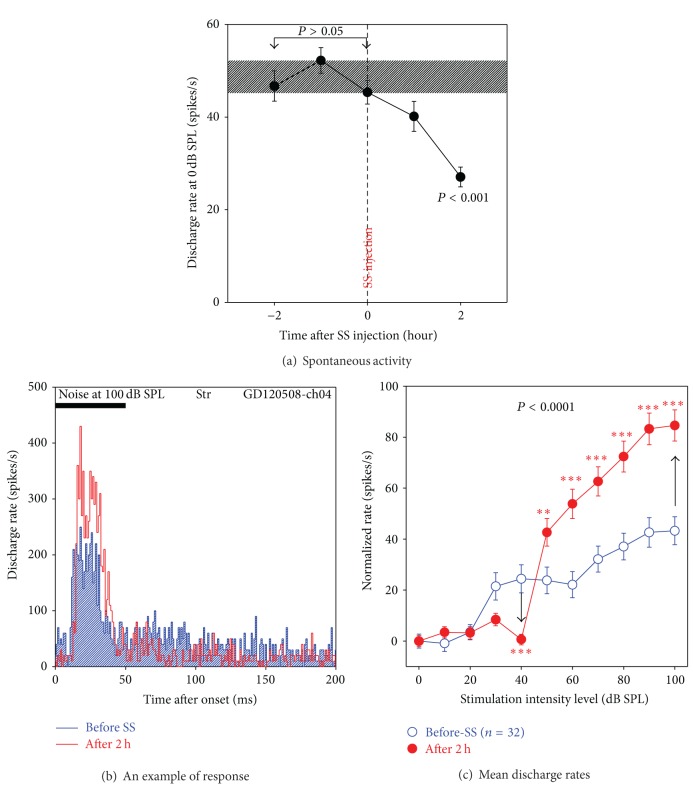
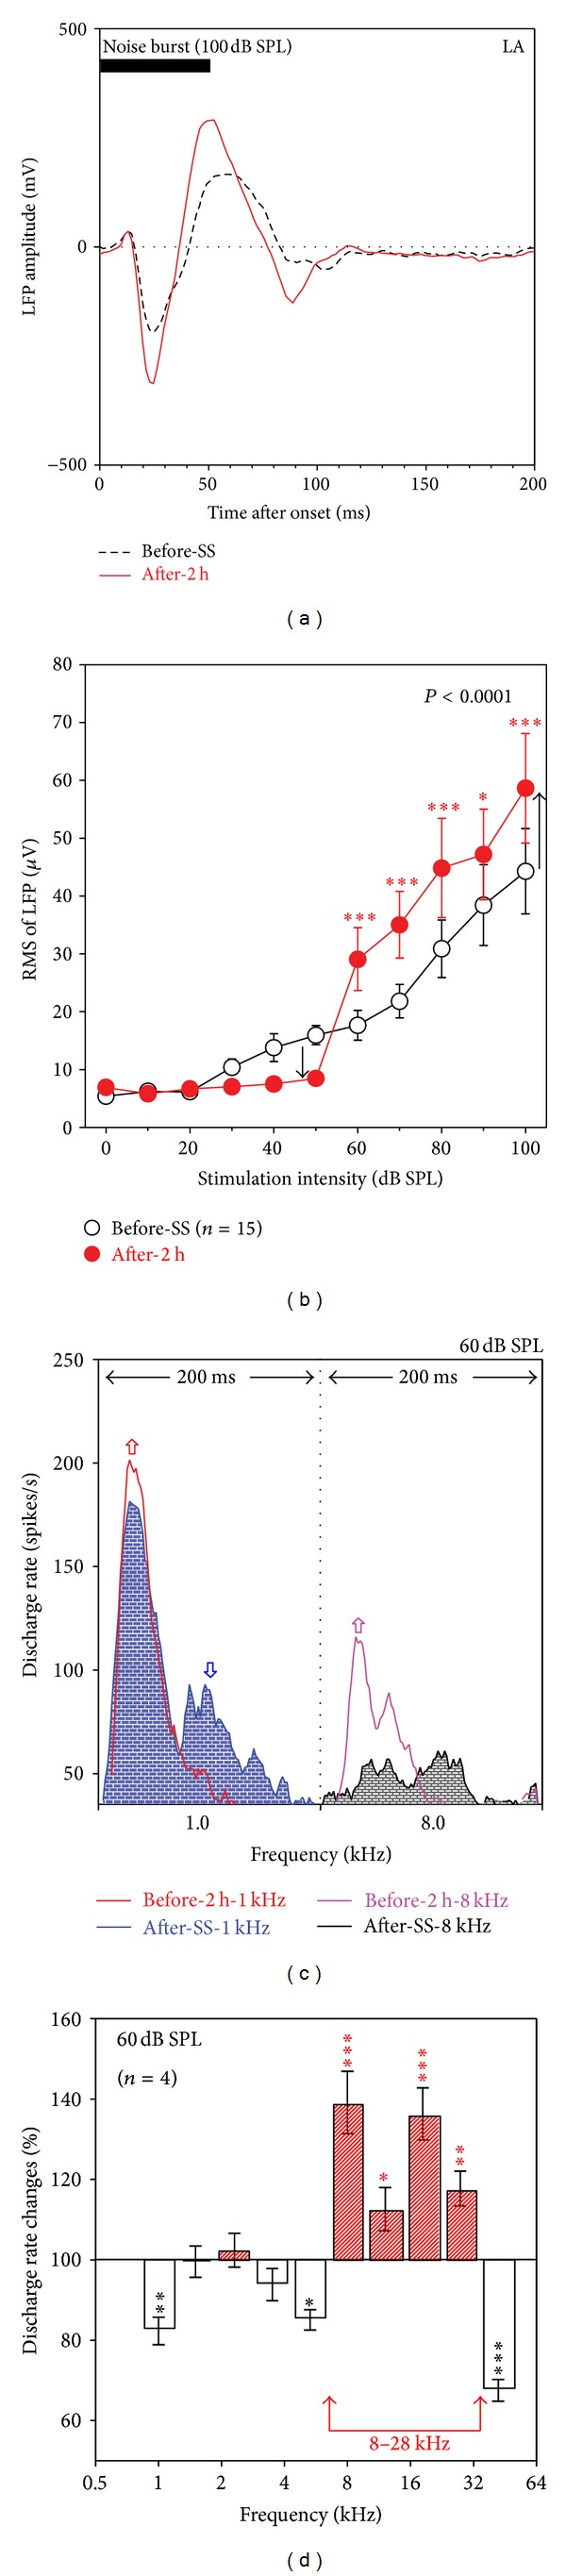
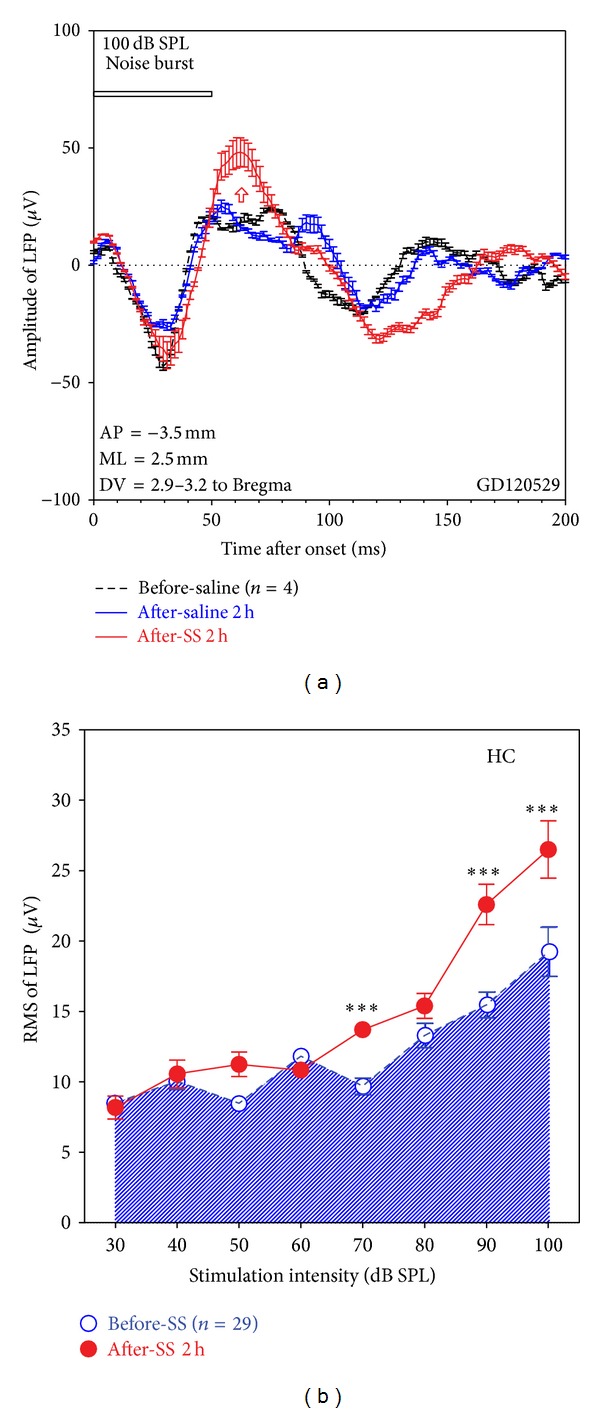
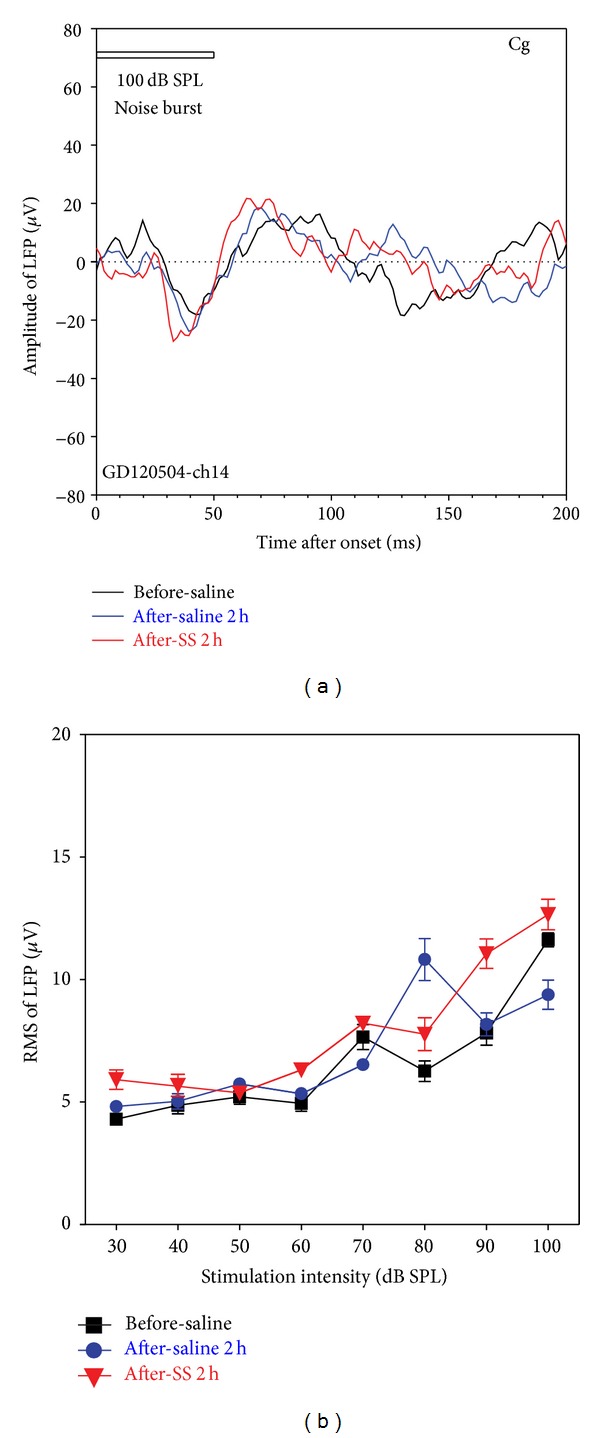
Previous studies have shown that sodium salicylate (SS) activates not only central auditory structures, but also nonauditory regions associated with emotion and memory. To identify electrophysiological changes in the nonauditory regions, we recorded sound-evoked local field potentials and multiunit discharges from the striatum, amygdala, hippocampus, and cingulate cortex after SS-treatment. The SS-treatment produced behavioral evidence of tinnitus and hyperacusis. Physiologically, the treatment significantly enhanced sound-evoked neural activity in the striatum, amygdala, and hippocampus, but not in the cingulate. The enhanced sound evoked response could be linked to the hyperacusis-like behavior. Further analysis showed that the enhancement of sound-evoked activity occurred predominantly at the midfrequencies, likely reflecting shifts of neurons towards the midfrequency range after SS-treatment as observed in our previous studies in the auditory cortex and amygdala. The increased number of midfrequency neurons would lead to a relative higher number of total spontaneous discharges in the midfrequency region, even though the mean discharge rate of each neuron may not increase. The tonotopical overactivity in the midfrequency region in quiet may potentially lead to tonal sensation of midfrequency (the tinnitus). The neural changes in the amygdala and hippocampus may also contribute to the negative effect that patients associate with their tinnitus.
Figures


Similar articles
-
Functional Neuroanatomy of Salicylate- and Noise-Induced Tinnitus and Hyperacusis.Curr Top Behav Neurosci. 2021;51:133-160. doi: 10.1007/7854_2020_156. Curr Top Behav Neurosci. 2021. PMID: 32653998
-
Testing the Central Gain Model: Loudness Growth Correlates with Central Auditory Gain Enhancement in a Rodent Model of Hyperacusis.Neuroscience. 2019 May 21;407:93-107. doi: 10.1016/j.neuroscience.2018.09.036. Epub 2018 Oct 5. Neuroscience. 2019. PMID: 30292765 Free PMC article.
-
Salicylate-induced cochlear impairments, cortical hyperactivity and re-tuning, and tinnitus.Hear Res. 2013 Jan;295:100-13. doi: 10.1016/j.heares.2012.11.016. Epub 2012 Nov 27. Hear Res. 2013. PMID: 23201030 Free PMC article. Review.
-
Amygdala hyperactivity and tonotopic shift after salicylate exposure.Brain Res. 2012 Nov 16;1485:63-76. doi: 10.1016/j.brainres.2012.03.016. Epub 2012 Mar 13. Brain Res. 2012. PMID: 22464181 Free PMC article.
-
Auditory sensori-neural alterations induced by salicylate.Prog Neurobiol. 2000 Dec;62(6):583-631. doi: 10.1016/s0301-0082(00)00027-7. Prog Neurobiol. 2000. PMID: 10880852 Review.
Cited by
-
Alterations in peripheral and central components of the auditory brainstem response: a neural assay of tinnitus.PLoS One. 2015 Feb 19;10(2):e0117228. doi: 10.1371/journal.pone.0117228. eCollection 2015. PLoS One. 2015. PMID: 25695496 Free PMC article.
-
Aberrant thalamocortical coherence in an animal model of tinnitus.J Neurophysiol. 2019 Mar 1;121(3):893-907. doi: 10.1152/jn.00053.2018. Epub 2019 Jan 9. J Neurophysiol. 2019. PMID: 30625004 Free PMC article.
-
Plasticity in Limbic Regions at Early Time Points in Experimental Models of Tinnitus.Front Syst Neurosci. 2020 Jan 24;13:88. doi: 10.3389/fnsys.2019.00088. eCollection 2019. Front Syst Neurosci. 2020. PMID: 32038184 Free PMC article.
-
Unexpected Consequences of Noise-Induced Hearing Loss: Impaired Hippocampal Neurogenesis, Memory, and Stress.Front Integr Neurosci. 2022 May 10;16:871223. doi: 10.3389/fnint.2022.871223. eCollection 2022. Front Integr Neurosci. 2022. PMID: 35619926 Free PMC article. Review.
-
The hearing hippocampus.Prog Neurobiol. 2022 Nov;218:102326. doi: 10.1016/j.pneurobio.2022.102326. Epub 2022 Jul 21. Prog Neurobiol. 2022. PMID: 35870677 Free PMC article. Review.
References
-
- Bobbin RP, May JG, Lemoine RL. Effects of pentobarbital and ketamine on brain stem auditory potentials. Latency and amplitude intensity functions after intraperitoneal administration. Archives of Otolaryngology. 1979;105(8):467–470. - PubMed
-
- Cazals Y. Auditory sensori-neural alterations induced by salicylate. Progress in Neurobiology. 2000;62(6):583–631. - PubMed
-
- Jastreboff PJ, Brennan JF, Coleman JK, Sasaki CT. Phantom auditory sensation in rats: an animal model for tinnitus. Behavioral Neuroscience. 1988;102(6):811–822. - PubMed
-
- Lobarinas E, Sun W, Cushing R, Salvi R. A novel behavioral paradigm for assessing tinnitus using schedule-induced polydipsia avoidance conditioning (SIP-AC) Hearing Research. 2004;190(1-2):109–114. - PubMed
-
- Kizawa K, Kitahara T, Horii A, et al. Behavioral assessment and identification of a molecular marker in a salicylate-induced tinnitus in rats. Neuroscience. 2010;165(4):1323–1332. - PubMed
Publication types
MeSH terms
Substances
Grants and funding
LinkOut - more resources
Full Text Sources
Other Literature Sources