. 2014 Jun 9;205(5):707-20.
doi: 10.1083/jcb.201403026. Epub 2014 Jun 2.

Rab18 and a Rab18 GEF complex are required for normal ER structure

Affiliations

Rab18 and a Rab18 GEF complex are required for normal ER structure

Andreas Gerondopoulos et al. J Cell Biol. .

Abstract

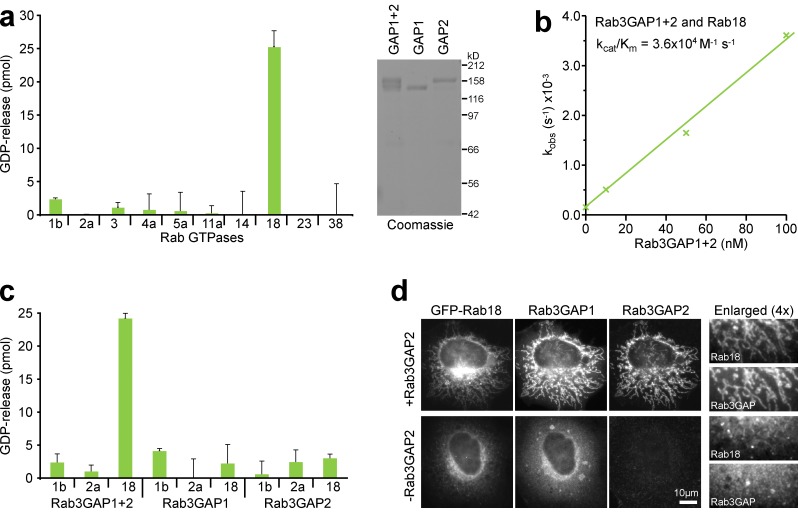
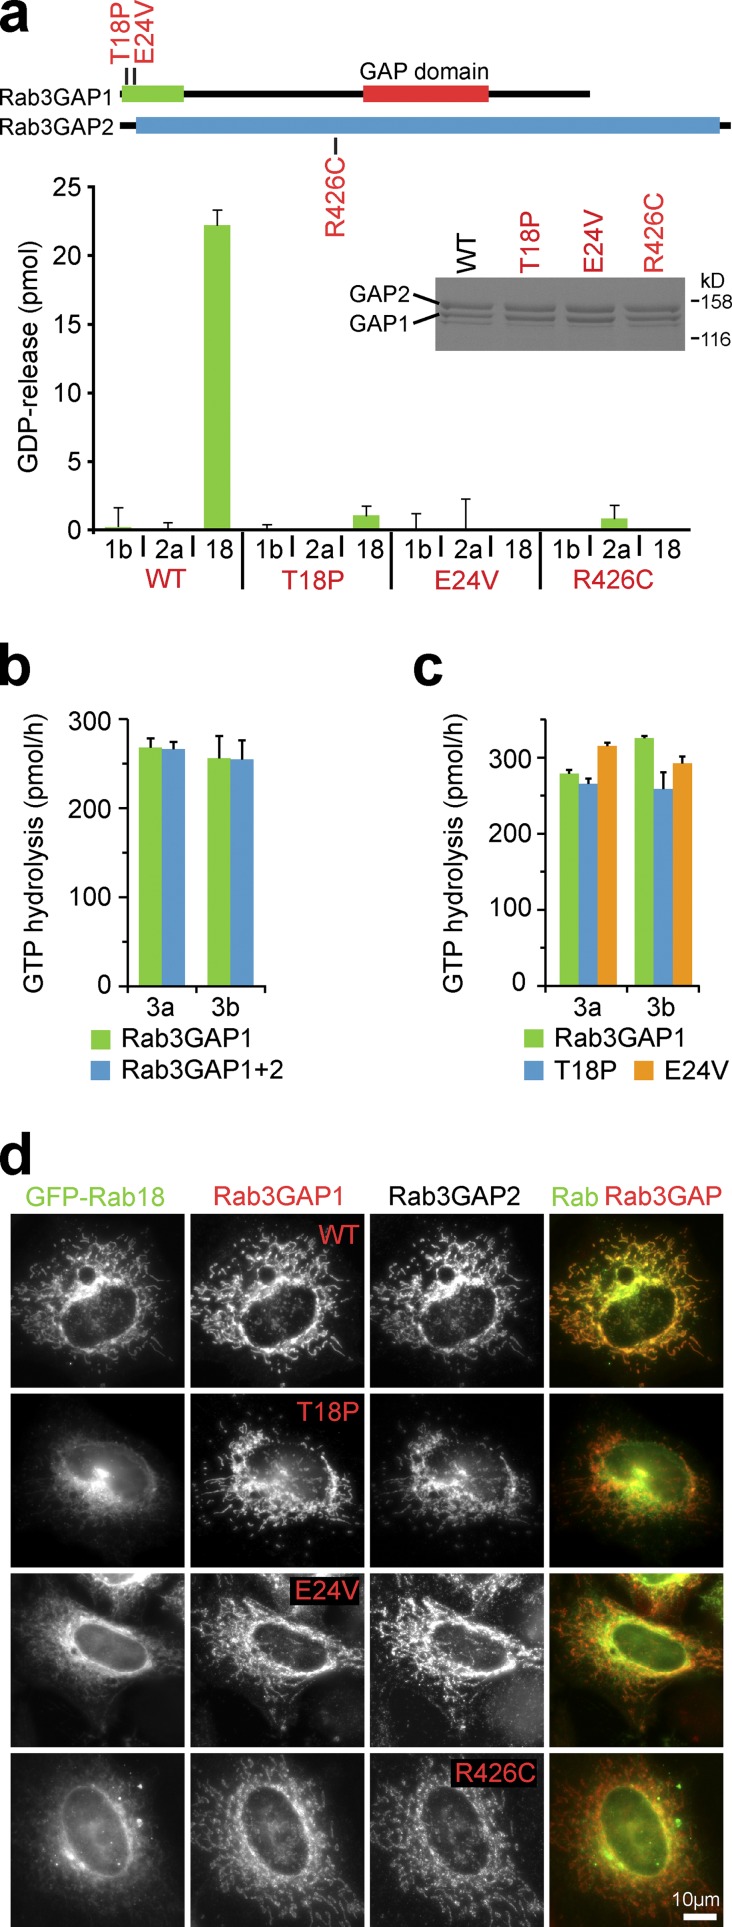
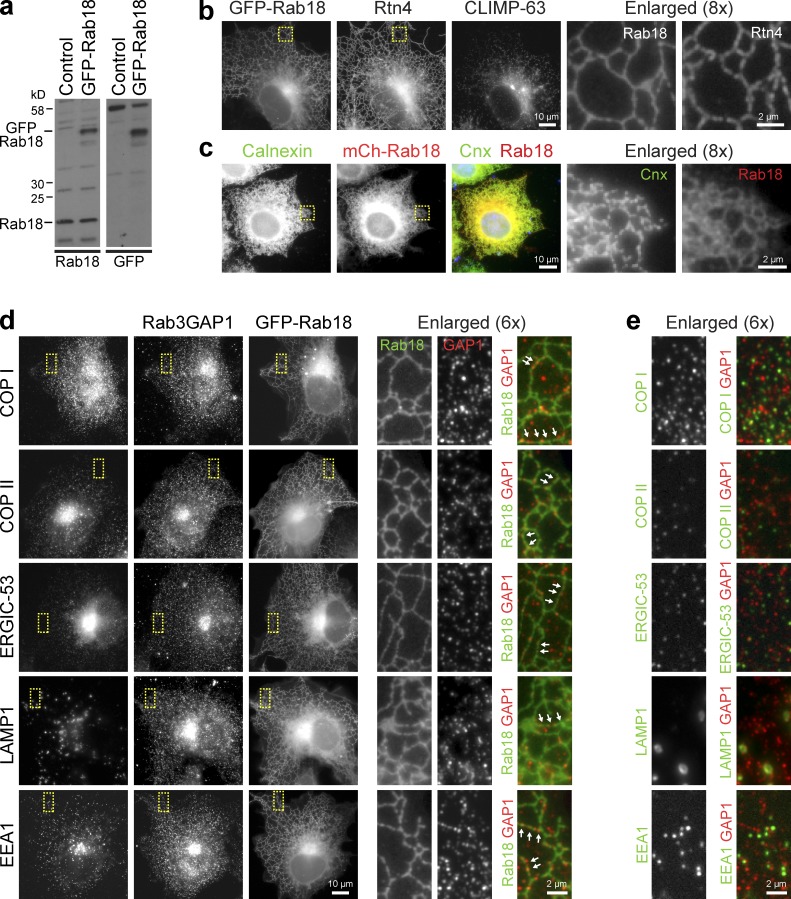
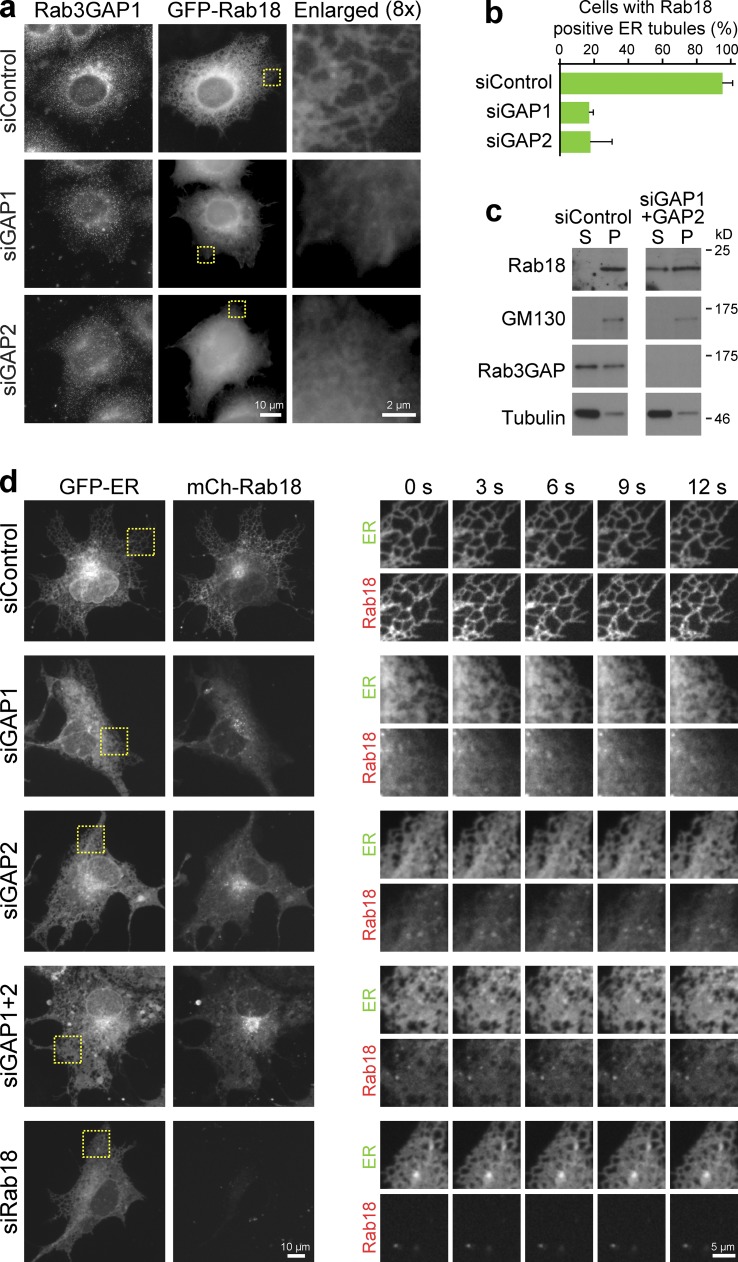
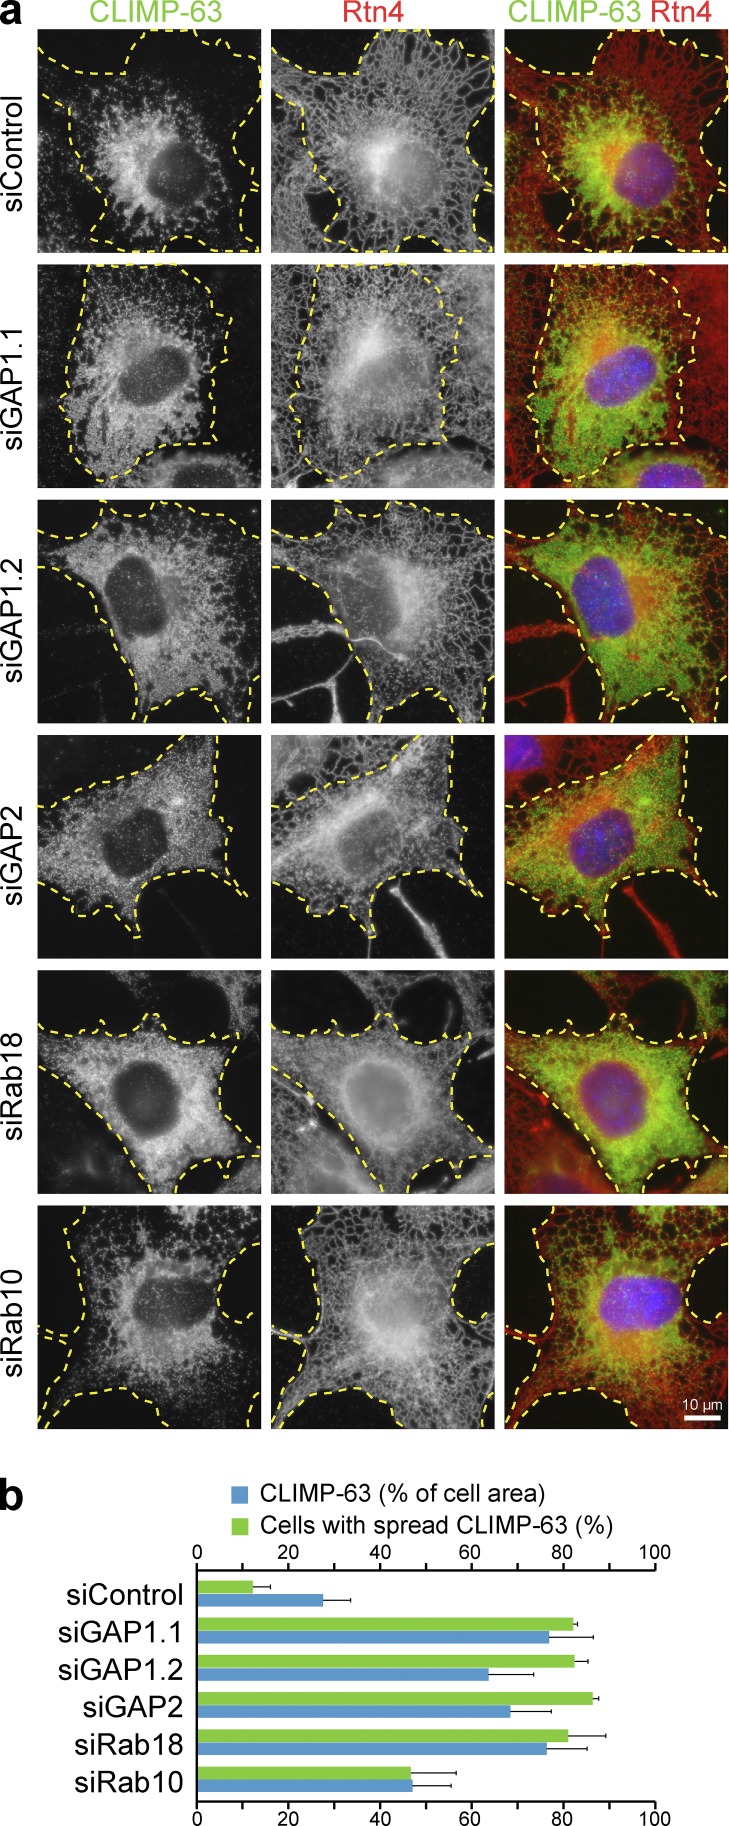
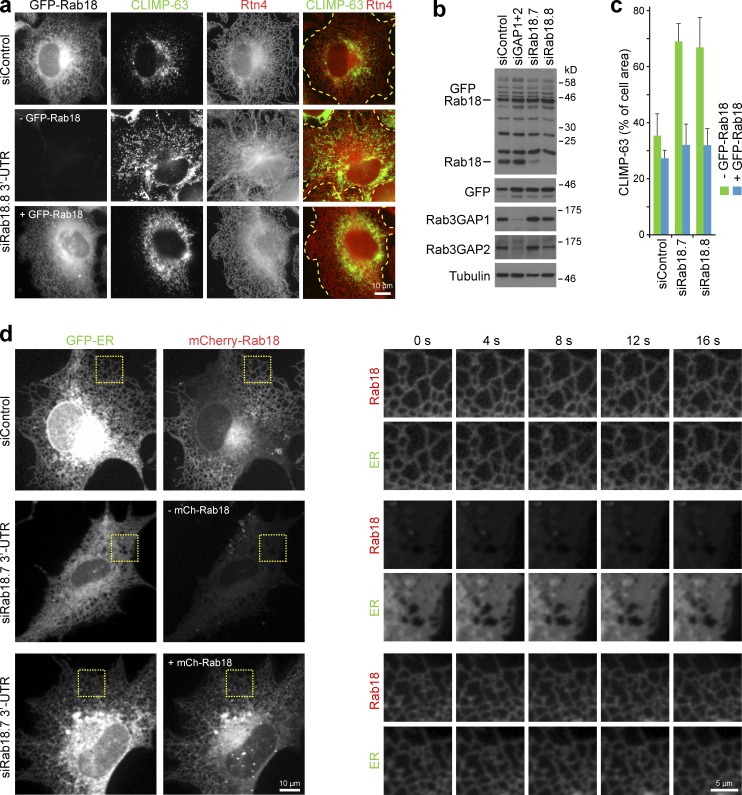
The ancestral Rab GTPase Rab18 and both subunits of the Rab3GAP complex are mutated in the human neurological and developmental disorder Warburg Micro syndrome. Here, we demonstrate that the Rab3GAP complex is a specific Rab18 guanine nucleotide exchange factor (GEF). The Rab3GAP complex localizes to the endoplasmic reticulum (ER) and is necessary for ER targeting of Rab18. It is also sufficient to promote membrane recruitment of Rab18. Disease-associated point mutations of conserved residues in either the Rab3GAP1 (T18P and E24V) or Rab3GAP2 (R426C) subunits result in loss of the Rab18 GEF and membrane-targeting activities. Supporting the view that Rab18 activity is important for ER structure, in the absence of either Rab3GAP subunit or Rab18 function, ER tubular networks marked by reticulon 4 were disrupted, and ER sheets defined by CLIMP-63 spread out into the cell periphery. Micro syndrome is therefore a disease characterized by direct loss of Rab18 function or loss of Rab18 activation at the ER by its GEF Rab3GAP.


Figures

Figure 1.
Figure 1.
Rab3GAP is a Rab18 GEF. (a) Rab3GAP complexes were used for GEF assays toward a representative group of Rab GTPases. Error bars indicate the standard deviation of the mean (n = 3). Rab3GAP complexes and individual subunits (GAP1 and GAP2) were analyzed on protein gels stained with colloidal Coomassie brilliant blue stain. (b) Mant-GDP kinetic GEF assays were performed using the Rab3GAP complex and Rab18 as a substrate to derive catalytic efficiency (kcat/Km). Initial rates of nucleotide exchange were derived from three independent experiments and are plotted as a function of Rab3GAP concentration. (c) Rab3GAP complexes and individual subunits were used for GEF assays toward Rab1b, Rab2a, and Rab18. Error bars indicate the standard deviation of the mean (n = 3). (d) HeLa cells were cotransfected for 20 h with GFP-Rabs and Myc-tagged Rab3GAP1 in the presence and absence of the Tom70-FLAG-Rab3GAP2 mitochondrial-targeting fusion. The cells were fixed and then stained with FLAG and Myc antibodies; Rabs were visualized using GFP fluorescence. Bars are marked in the figure.
Figure 2.
Figure 2.
Disease-associated mutations in Rab3GAP1 and Rab3GAP2 result in loss of Rab18 GEF activity. (a) A schematic of the Rab3GAP complex showing the Rab3 GAP domain and the conserved N-terminal region of Rab3GAP1. Pathological missense mutations in Rab3GAP1 and Rab3GAP2 are marked. Wild-type and disease mutant Rab3GAP complexes were used for GEF assays toward Rab1b, Rab2a, and Rab18. Error bars indicate the standard deviation of the mean (n = 3). (b) Wild-type Rab3GAP1, Rab3GAP1 and Rab3GAP2, or (c) wild-type and disease mutant Rab3GAP1 were used for GTPase assays with Rab3a or Rab3b. Error bars indicate the range (n = 2). This is a subset of the full screening data presented in the inset bar graph panel of Fig. S1 a. (d) HeLa cells were cotransfected for 20 h with GFP-Rabs, wild-type and disease mutant Myc-tagged Rab3GAP1, and the Tom70-FLAG-Rab3GAP2 mitochondrial-targeting fusion as indicated in the figure. The cells were fixed and then stained with FLAG and Myc antibodies; Rabs were visualized using GFP fluorescence. Bars are marked in the figure.
Figure 3.
Figure 3.
Analysis of Rab18 and Rab3GAP localization to the ER. (a) Western blot of COS7 control cells and COS7 cells expressing GFP-Rab18 with antibodies to endogenous Rab18 and GFP. (b) GFP-Rab18, reticulon 4 (Rtn4), and CLIMP-63 staining is shown in COS7 cells. (c) Calnexin staining and mCherry (mCh)-tagged Rab18 are shown in HeLa cells. (d) COS7 cells expressing GFP-Rab18 were stained for Rab3GAP1 and markers for COP I (β-COP), COP II (Sec31), ERGIC-53, and LAMP1. Arrowheads in the enlarged region show details of Rab3GAP1 localization to ER tubules marked by GFP-Rab18. (e) The enlarged region corresponding to the yellow boxed area in d shows details of the Rab3GAP1 and different compartment markers. Bars are marked in the figure.
Figure 4.
Figure 4.
Rab3GAP is required for ER localization of Rab18. (a) HeLa cells expressing GFP-Rab18 were depleted of Rab3GAP subunits (siGAP1 and siGAP2) for 72 h and then stained with a Rab3GAP1 antibody. The enlarged region from the yellow boxed area shows details of Rab18 localization. (b) The presence of GFP-Rab18 on ER tubules was scored for all conditions and plotted in the bar graph. Error bars indicate the standard deviation of the mean (n = 3 independent experiments). (c) HeLa cells were depleted of Rab3GAP subunits (GAP1 and GAP2) for 72 h. Western blots show the distribution of endogenous Rab18 to the membrane pellet (P) and soluble (S) cytosol fractions marked by the Golgi membrane protein GM130 and tubulin, respectively. Rab3GAP1 depletion was confirmed by Western blotting. (d) COS7 cells expressing a GFP-tagged ER marker and mCherry-tagged Rab18 were depleted of Rab3GAP subunits alone or in combination or Rab18 for 72 h then imaged at 1.5-s intervals using a spinning-disk confocal microscope. The entire cell is shown for t = 0, and a time series from the yellow boxed area is depicted in the enlarged regions. Bars are marked in the figure.
Figure 5.
Figure 5.
ER sheets spread into the cell periphery when Rab18 or its GEF complex is depleted. (a) COS7 cells were depleted of Rab3GAP subunits (GAP1 and GAP2), Rab18, or Rab10 for 72 h. Two different siRNA duplexes to Rab3GAP1 (GAP1.1 and GAP1.2) were used. The cells were fixed and then stained with antibodies to CLIMP-63 and reticulon 4 (Rtn4). DNA was stained with DAPI (blue in the merged panel). Dotted yellow lines mark the cell boundaries. The bar is marked in the figure. (b) The area of CLIMP-63 as a function of total cell area was measured using ImageJ (National Institutes of Health) for 50–70 cells per experiment, for three independent experiments (blue bars). Additionally, the percentage of cells showing spread CLIMP-63 was also counted (green bars). In both cases the mean values are plotted in the bar graph, with error bars indicating the standard deviation of the mean.
Figure 6.
Figure 6.
Loss of dynamic ER tubules in Rab18-depleted cells. (a) COS7 cells were treated with control or Rab18.8 3′-UTR siRNA for 52 h, then transfected with empty vector or GFP-Rab18 for 20 h. Cells were fixed and then stained with antibodies to CLIMP-63 and Rtn4. Dotted yellow lines mark the cell boundaries. (b) COS7 cells were treated with control, Rab3GAP (siGAP1+2), Rab18.7, or Rab18.8 3′-UTR siRNA for 52 h, then transfected with empty vector or GFP-Rab18 for 20 h. Cell lysates were Western blotted with antibodies to Rab18, GFP, Rab3GAP subunits, and tubulin as a loading control. Rab18 antibodies see multiple nonspecific bands; lines in the figure indicate endogenous Rab18 and GFP-Rab18. (c) The area of CLIMP-63 as a function of total cell area was measured using ImageJ for 40–60 cells per experiment, for three independent experiments. This was performed for cells expressing (blue bars) or not expressing (green bars) GFP-Rab18. Mean values are plotted in the bar graph, with error bars indicating the standard deviation of the mean. (d) COS7 cells expressing a GFP-ER marker were treated with control or Rab18.7 3′-UTR siRNA for 52 h, then transfected with empty vector or mCherry-Rab18 for 20 h. The cells were then imaged at 2-s intervals using a spinning-disk confocal microscope. The entire cell is shown for t = 0, and a time series showing images every 4 s from the yellow boxed area is depicted in the enlarged regions. Bars are marked in the figure.
Figure 7.
Figure 7.
Warburg Micro syndrome patient cell lines show altered ER morphology. (a) Control and patient fibroblasts were fixed and then stained with antibodies to CLIMP-63 and reticulon 4 (Rtn4). DNA was stained with DAPI (blue in the merged panel). (b) The area of CLIMP-63 as a function of total cell area was measured using ImageJ for 50–70 cells per experiment, for three independent experiments. The mean values are plotted in the bar graph, with error bars indicating the standard deviation of the mean. (c) COS7 cells expressing GFP-Rab18 were treated with control, Rab3GAP (siGAP1+GAP2), or TBC1D20 siRNA duplexes for 72 h. The cells were fixed and then stained with antibodies to CLIMP-63 and Rtn4. DNA was stained with DAPI (blue in the merged panel). The merged panel shows a comparison of GFP-Rab18 and Rtn4 localization to ER tubular networks. Bars are marked in the figure.

Similar articles

Cited by

References

    1. Aligianis I.A., Johnson C.A., Gissen P., Chen D., Hampshire D., Hoffmann K., Maina E.N., Morgan N.V., Tee L., Morton J., et al. 2005. Mutations of the catalytic subunit of RAB3GAP cause Warburg Micro syndrome. Nat. Genet. 37:221–223 10.1038/ng1517 - DOI - PubMed
    1. Aligianis I.A., Morgan N.V., Mione M., Johnson C.A., Rosser E., Hennekam R.C., Adams G., Trembath R.C., Pilz D.T., Stoodley N., et al. 2006. Mutation in Rab3 GTPase-activating protein (RAB3GAP) noncatalytic subunit in a kindred with Martsolf syndrome. Am. J. Hum. Genet. 78:702–707 10.1086/502681 - DOI - PMC - PubMed
    1. Barr F.A. 2013. Review series: Rab GTPases and membrane identity: causal or inconsequential? J. Cell Biol. 202:191–199 10.1083/jcb.201306010 - DOI - PMC - PubMed
    1. Bem D., Yoshimura S., Nunes-Bastos R., Bond F.C., Kurian M.A., Rahman F., Handley M.T., Hadzhiev Y., Masood I., Straatman-Iwanowska A.A., et al. 2011. Loss-of-function mutations in RAB18 cause Warburg Micro syndrome. Am. J. Hum. Genet. 88:499–507 10.1016/j.ajhg.2011.03.012 - DOI - PMC - PubMed
    1. Blackstone C. 2012. Cellular pathways of hereditary spastic paraplegia. Annu. Rev. Neurosci. 35:25–47 10.1146/annurev-neuro-062111-150400 - DOI - PMC - PubMed

Publication types