

Amerindian-specific regions under positive selection harbour new lipid variants in Latinos
- PMID: 24886709
- PMCID: PMC4062071
- DOI: 10.1038/ncomms4983
Amerindian-specific regions under positive selection harbour new lipid variants in Latinos
Abstract
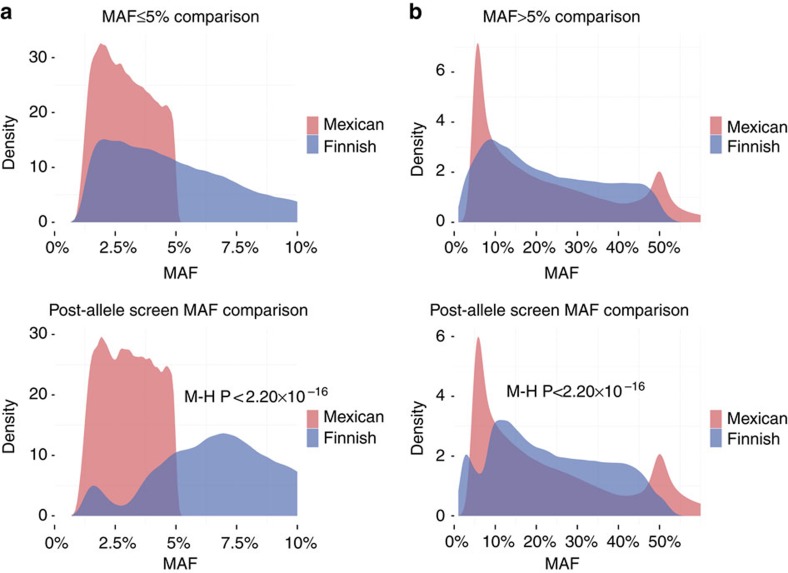
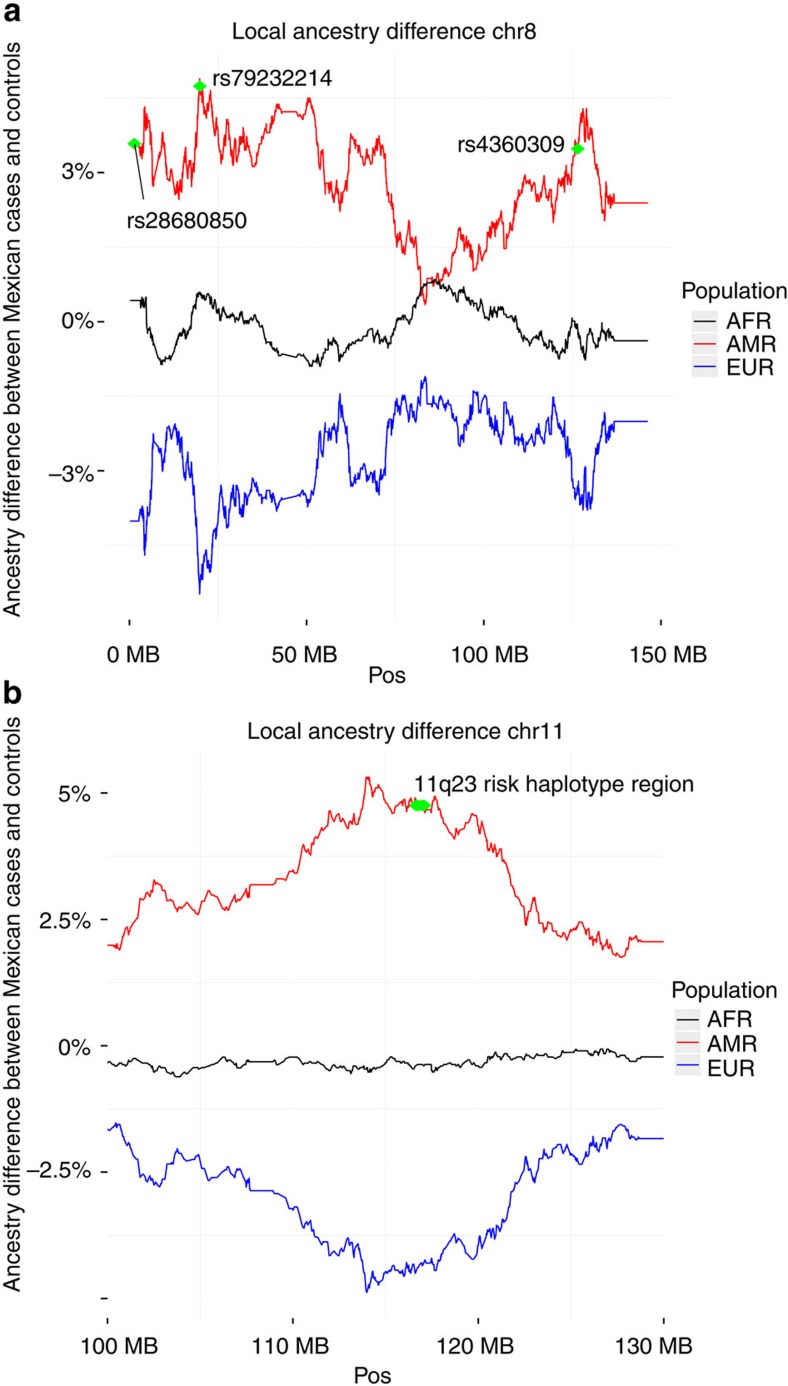
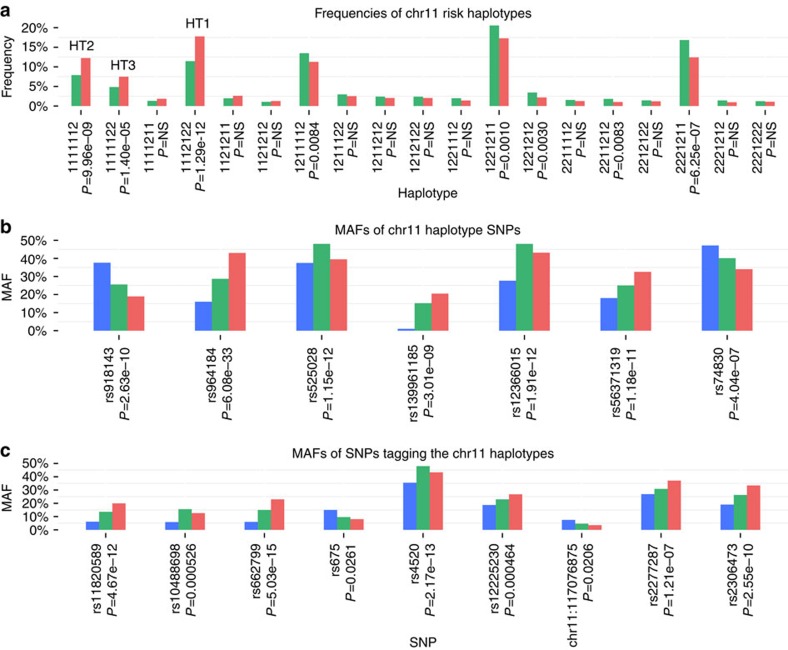
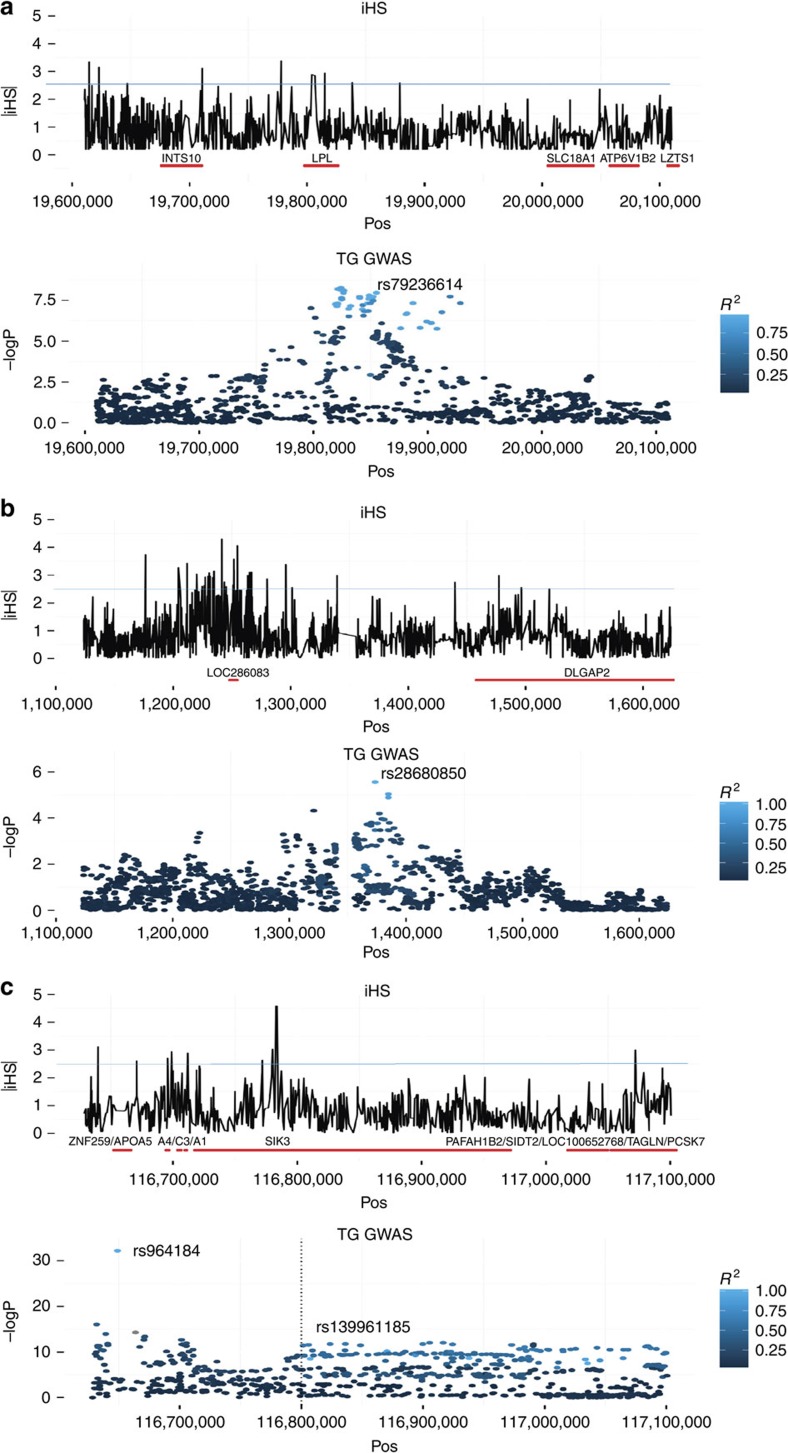
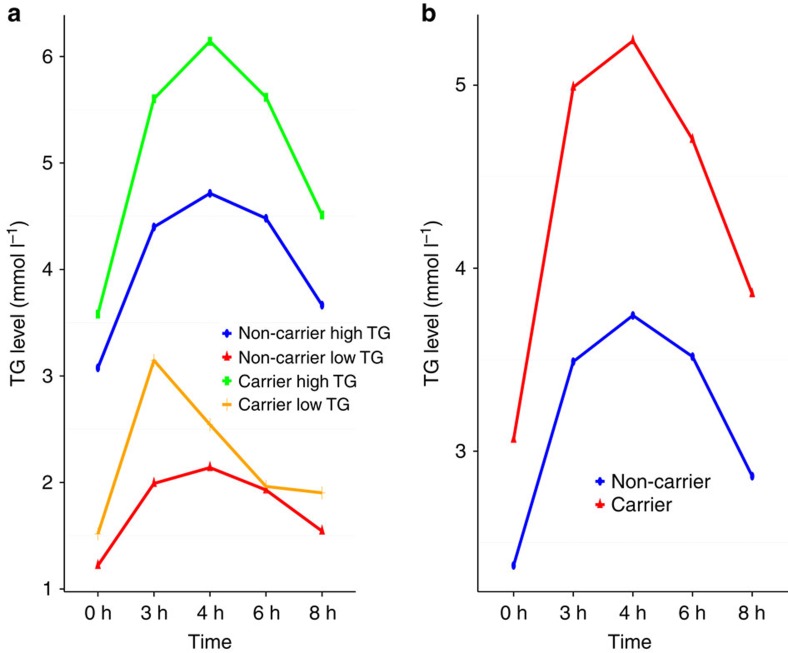
Dyslipidemia and obesity are especially prevalent in populations with Amerindian backgrounds, such as Mexican-Americans, which predispose these populations to cardiovascular disease. Here we design an approach, known as the cross-population allele screen (CPAS), which we conduct prior to a genome-wide association study (GWAS) in 19,273 Europeans and Mexicans, in order to identify Amerindian risk genes in Mexicans. Utilizing CPAS to restrict the GWAS input variants to only those differing in frequency between the two populations, we identify novel Amerindian lipid genes, receptor-related orphan receptor alpha (RORA) and salt-inducible kinase 3 (SIK3), and three loci previously unassociated with dyslipidemia or obesity. We also detect lipoprotein lipase (LPL) and apolipoprotein A5 (APOA5) harbouring specific Amerindian signatures of risk variants and haplotypes. Notably, we observe that SIK3 and one novel lipid locus underwent positive selection in Mexicans. Furthermore, after a high-fat meal, the SIK3 risk variant carriers display high triglyceride levels. These findings suggest that Amerindian-specific genetic architecture leads to a higher incidence of dyslipidemia and obesity in modern Mexicans.
Figures
Similar articles
-
Genomic study in Mexicans identifies a new locus for triglycerides and refines European lipid loci.J Med Genet. 2013 May;50(5):298-308. doi: 10.1136/jmedgenet-2012-101461. Epub 2013 Mar 15. J Med Genet. 2013. PMID: 23505323 Free PMC article.
-
Investigation of variants identified in caucasian genome-wide association studies for plasma high-density lipoprotein cholesterol and triglycerides levels in Mexican dyslipidemic study samples.Circ Cardiovasc Genet. 2010 Feb;3(1):31-8. doi: 10.1161/CIRCGENETICS.109.908004. Epub 2009 Dec 11. Circ Cardiovasc Genet. 2010. PMID: 20160193 Free PMC article.
-
Genetic and environmental determinants of the susceptibility of Amerindian derived populations for having hypertriglyceridemia.Metabolism. 2014 Jul;63(7):887-94. doi: 10.1016/j.metabol.2014.03.012. Epub 2014 Mar 30. Metabolism. 2014. PMID: 24768220 Free PMC article. Review.
-
Apolipoprotein A5 and lipoprotein lipase interact to modulate anthropometric measures in Hispanics of Caribbean origin.Obesity (Silver Spring). 2010 Feb;18(2):327-32. doi: 10.1038/oby.2009.216. Epub 2009 Jul 23. Obesity (Silver Spring). 2010. PMID: 19629056 Free PMC article.
-
Genetic determinants of plasma triglycerides.J Lipid Res. 2011 Feb;52(2):189-206. doi: 10.1194/jlr.R009720. Epub 2010 Nov 1. J Lipid Res. 2011. PMID: 21041806 Free PMC article. Review.
Cited by
-
Differential distribution of gene polymorphisms associated with hypercholesterolemia, hypertriglyceridemia, and hypoalphalipoproteinemia among Native American and Mestizo Mexicans.World J Hepatol. 2022 Jul 27;14(7):1408-1420. doi: 10.4254/wjh.v14.i7.1408. World J Hepatol. 2022. PMID: 36158920 Free PMC article.
-
The Legacy of Infectious Disease Exposure on the Genomic Diversity of Indigenous Southern Mexicans.Genome Biol Evol. 2023 Mar 3;15(3):evad015. doi: 10.1093/gbe/evad015. Genome Biol Evol. 2023. PMID: 36726304 Free PMC article.
-
Dysregulation of long non-coding RNA gene expression pathways in monocytes of type 2 diabetes patients with cardiovascular disease.Cardiovasc Diabetol. 2024 Jun 7;23(1):196. doi: 10.1186/s12933-024-02292-1. Cardiovasc Diabetol. 2024. PMID: 38849833 Free PMC article.
-
Identity-by-Descent Mapping Identifies Major Locus for Serum Triglycerides in Amerindians Largely Explained by an APOC3 Founder Mutation.Circ Cardiovasc Genet. 2017 Dec;10(6):e001809. doi: 10.1161/CIRCGENETICS.117.001809. Circ Cardiovasc Genet. 2017. PMID: 29237685 Free PMC article.
-
Familial hypertriglyceridemia: an entity with distinguishable features from other causes of hypertriglyceridemia.Lipids Health Dis. 2021 Feb 15;20(1):14. doi: 10.1186/s12944-021-01436-6. Lipids Health Dis. 2021. PMID: 33588820 Free PMC article.
References
-
- Tóth P. P., Potter D. & Ming E. E. Prevalence of lipid abnormalities in the United States: The National Health and Nutrition Examination Survey 2003–2006. J. Clin. Lipidol. 6, 325–330 (2012). - PubMed
-
- LaRosa J. C. & Brown C. D. Cardiovascular risk factors in minorities. Am. J. Med. 118, 1314–1322 (2005). - PubMed
-
- Aguilar-Salinas C. A. et al.. Hypoalphalipoproteinemia in populations of Native American ancestry: an opportunity to assess the interaction of genes and the environment. Curr. Opin. Lipidol. 20, 92–97 (2009). - PubMed
Publication types
MeSH terms
Substances
Associated data
Grants and funding
- T32 HG002536/HG/NHGRI NIH HHS/United States
- R25 GM055052/GM/NIGMS NIH HHS/United States
- AA15416/AA/NIAAA NIH HHS/United States
- WT089062/WT_/Wellcome Trust/United Kingdom
- HL-28481/HL/NHLBI NIH HHS/United States
- K02 AA018755/AA/NIAAA NIH HHS/United States
- K05 AA000145/AA/NIAAA NIH HHS/United States
- AA-12502/AA/NIAAA NIH HHS/United States
- R01 AA012502/AA/NIAAA NIH HHS/United States
- R01 AA015416/AA/NIAAA NIH HHS/United States
- R25GM055052/GM/NIGMS NIH HHS/United States
- R37 AA012502/AA/NIAAA NIH HHS/United States
- K02AA018755/AA/NIAAA NIH HHS/United States
- GM-053275/GM/NIGMS NIH HHS/United States
- P01 HL028481/HL/NHLBI NIH HHS/United States
- R01 AA009203/AA/NIAAA NIH HHS/United States
- T32HG002536/HG/NHGRI NIH HHS/United States
- HL-095056/HL/NHLBI NIH HHS/United States
- R01 HL095056/HL/NHLBI NIH HHS/United States
- R01 GM053275/GM/NIGMS NIH HHS/United States
LinkOut - more resources
Full Text Sources
Other Literature Sources
Medical
Miscellaneous
