. 2014 May 28;34(22):7704-14.
doi: 10.1523/JNEUROSCI.4694-13.2014.

Achieving high-frequency optical control of synaptic transmission

Affiliations

Achieving high-frequency optical control of synaptic transmission

Skyler L Jackman et al. J Neurosci. .

Abstract

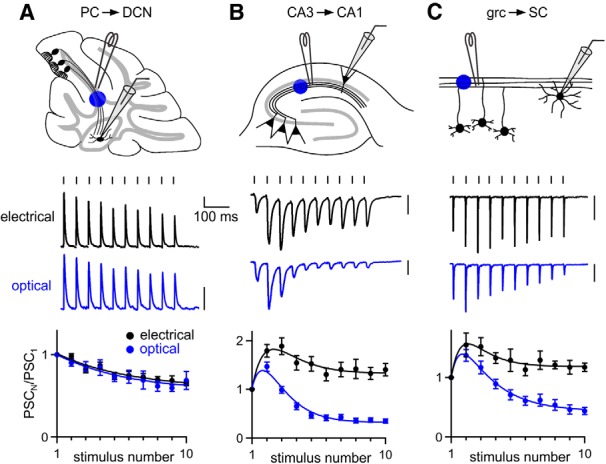
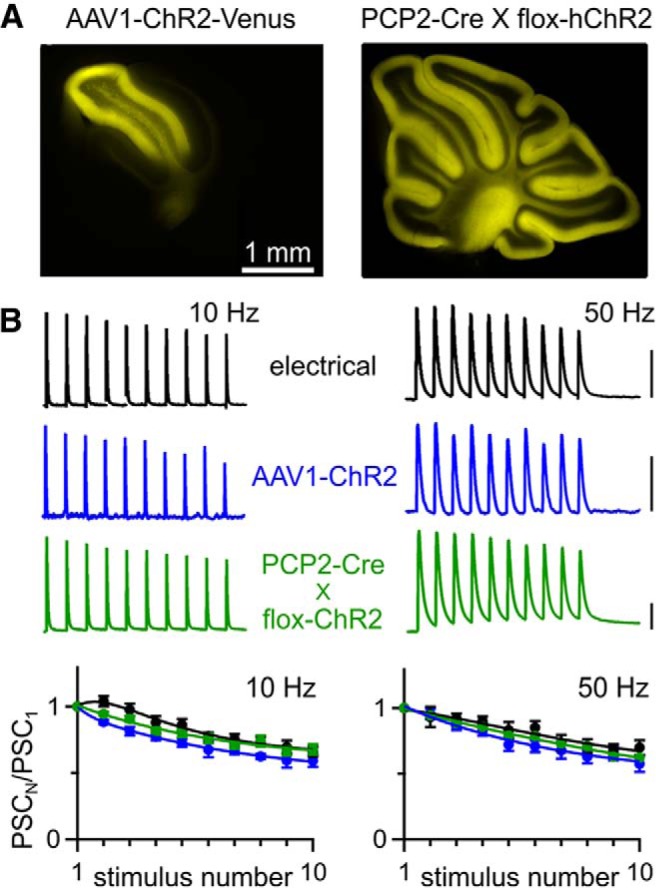
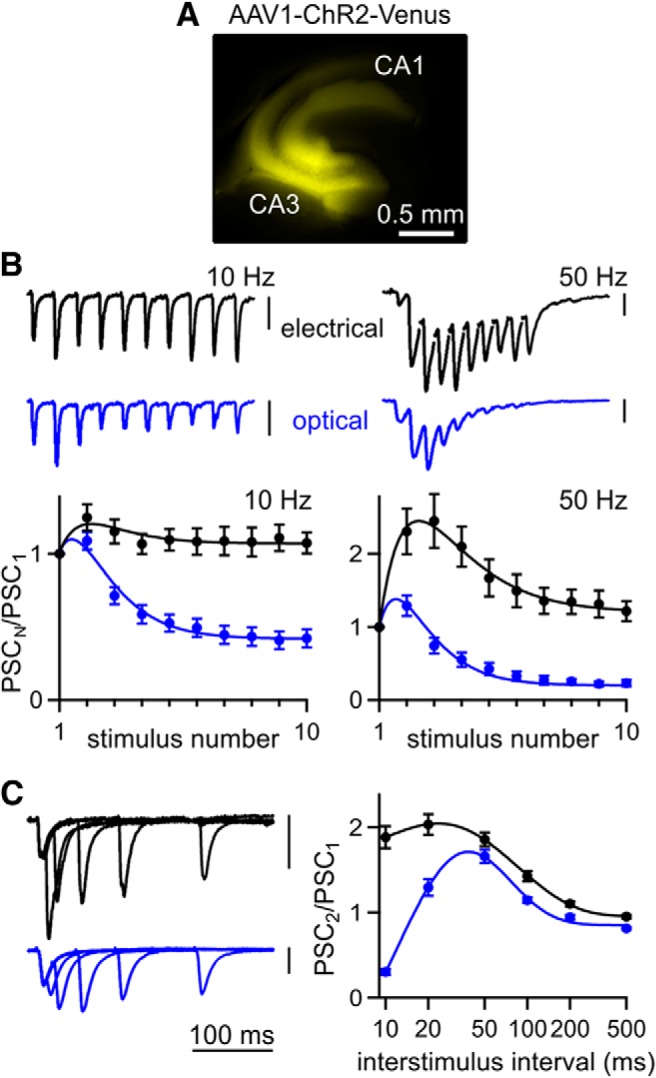
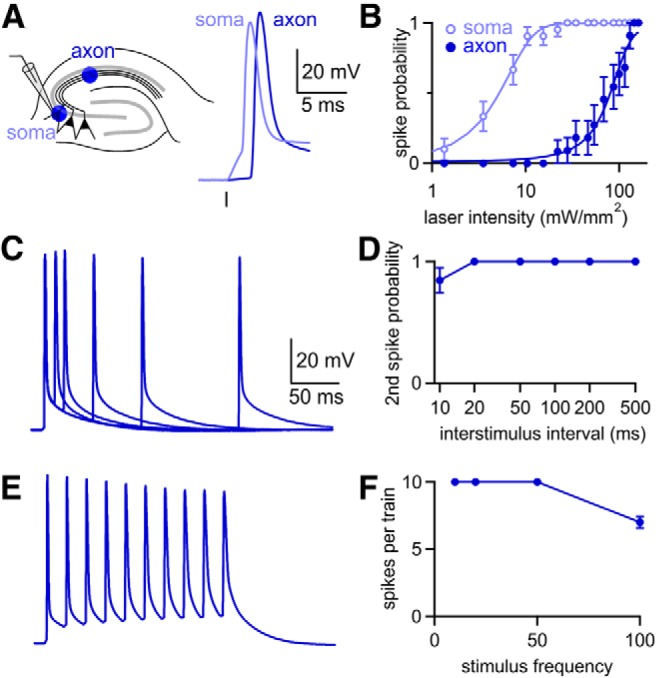
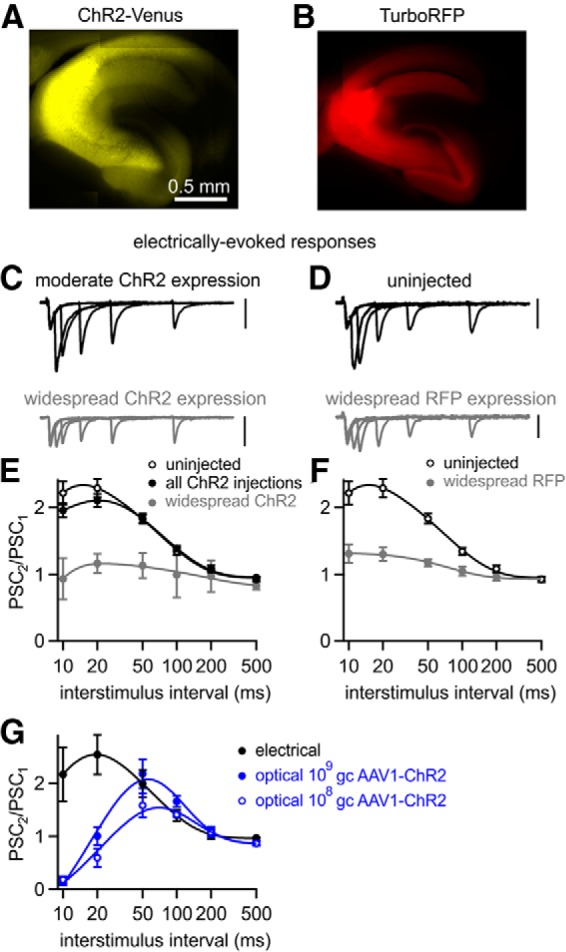
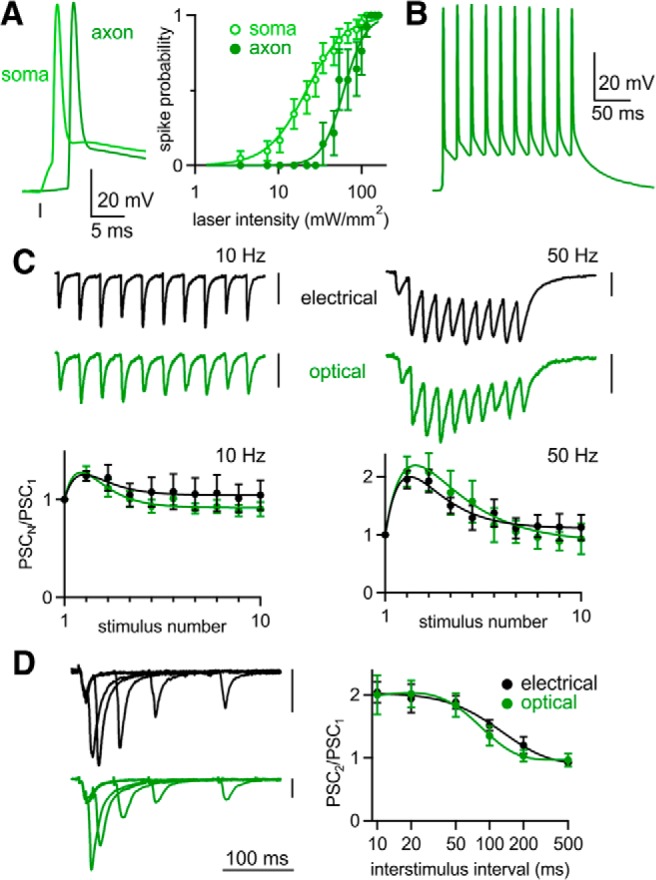
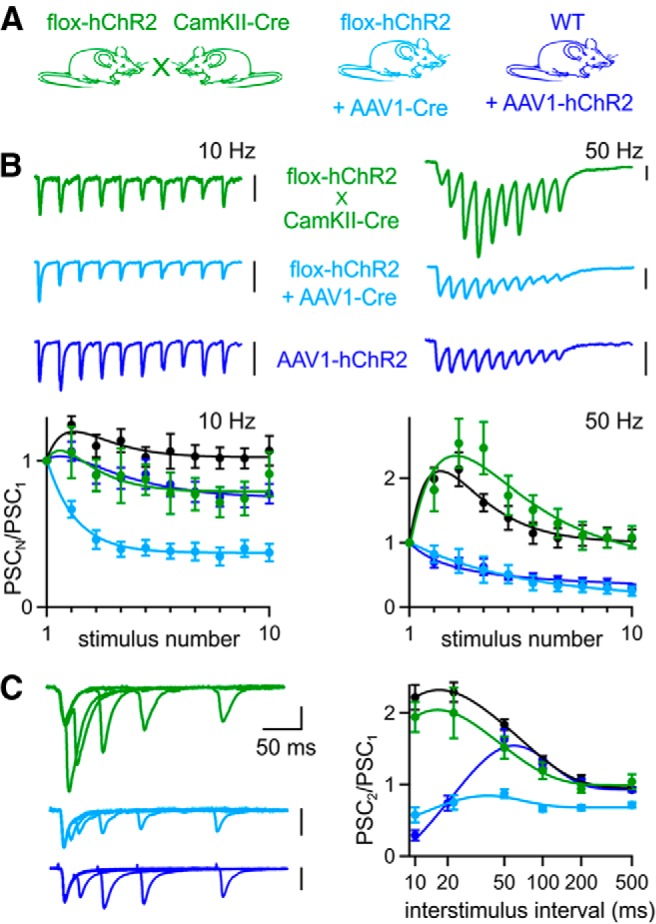
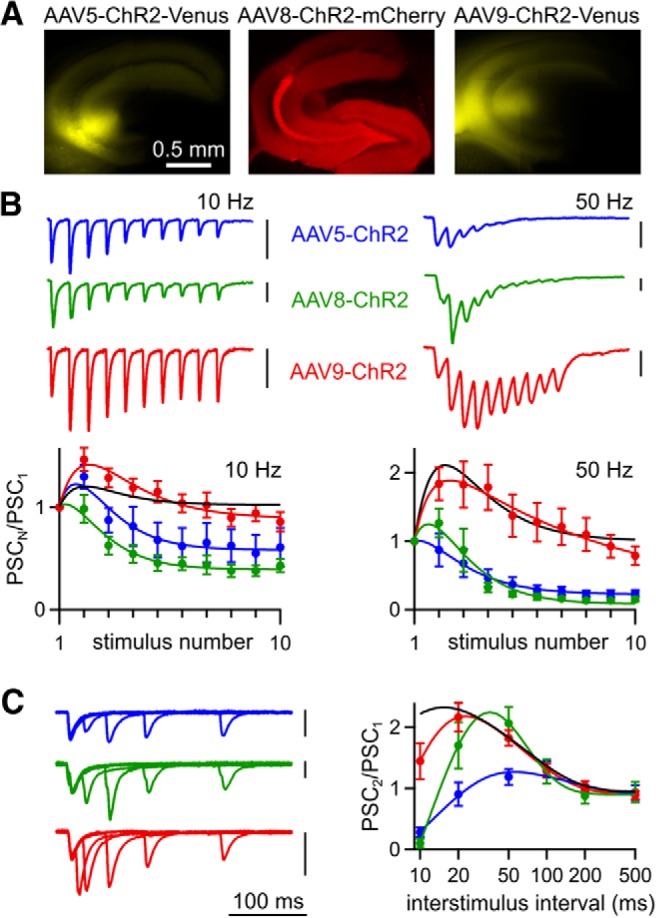
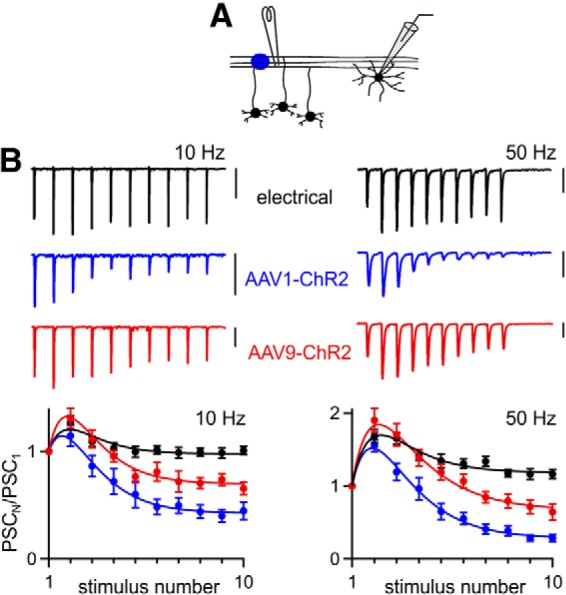
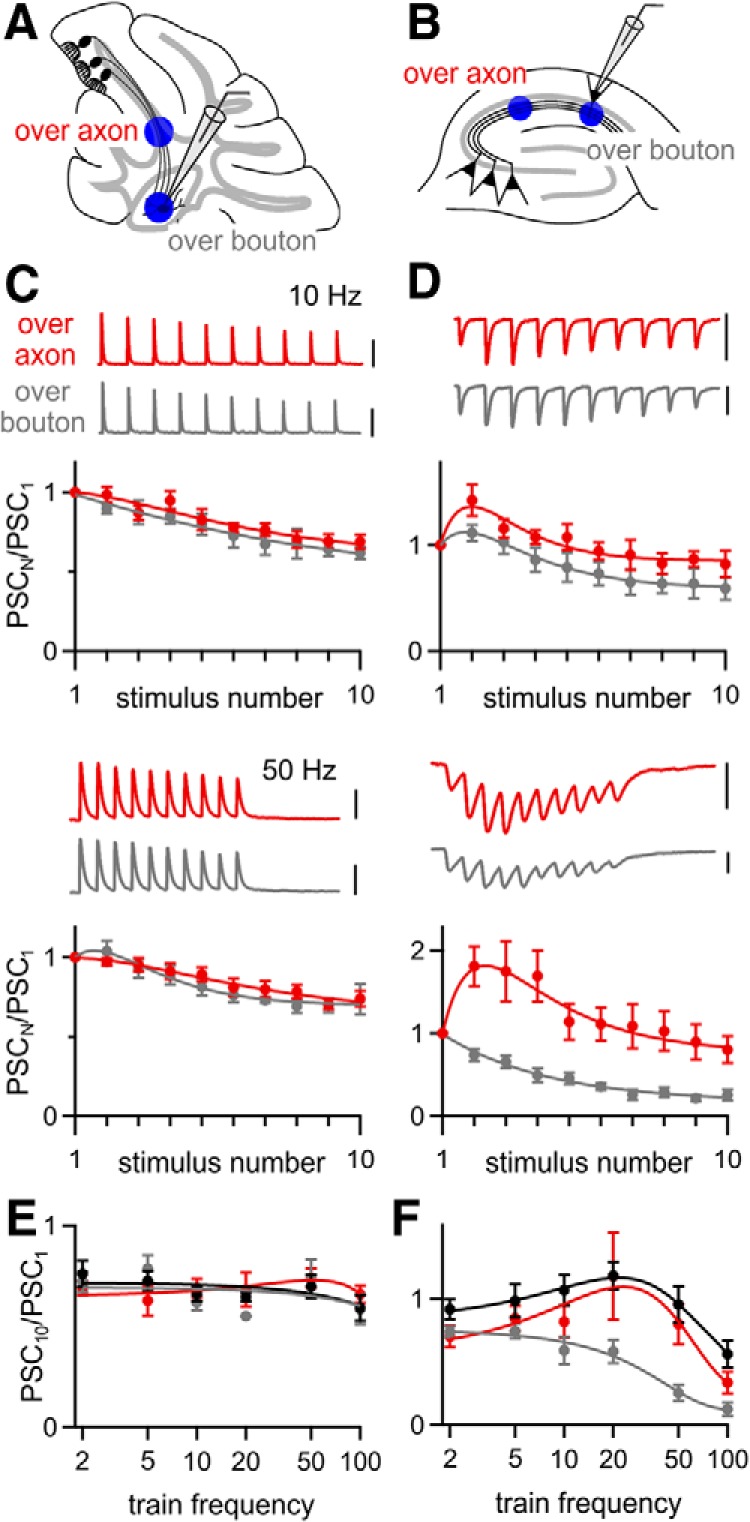
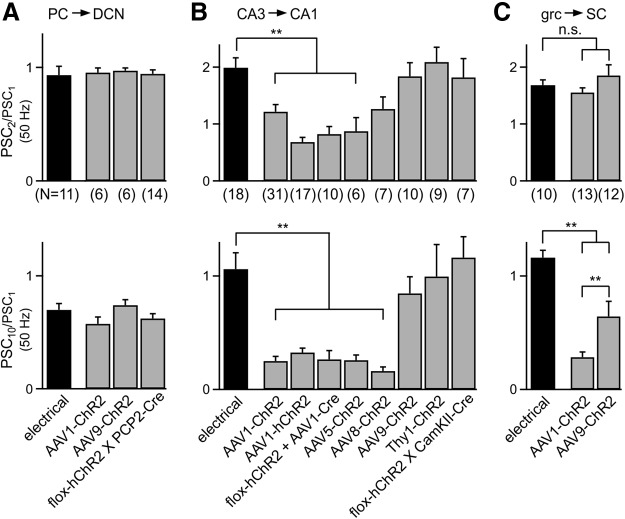
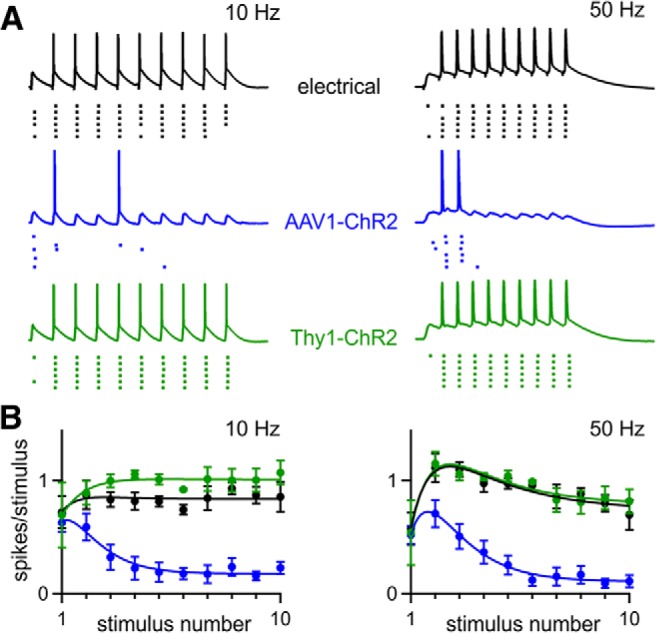
The optogenetic tool channelrhodopsin-2 (ChR2) is widely used to excite neurons to study neural circuits. Previous optogenetic studies of synapses suggest that light-evoked synaptic responses often exhibit artificial synaptic depression, which has been attributed to either the inability of ChR2 to reliably fire presynaptic axons or to ChR2 elevating the probability of release by depolarizing presynaptic boutons. Here, we compare light-evoked and electrically evoked synaptic responses for high-frequency stimulation at three synapses in the mouse brain. At synapses from Purkinje cells to deep cerebellar nuclei neurons (PC→DCN), light- and electrically evoked synaptic currents were remarkably similar for ChR2 expressed transgenically or with adeno-associated virus (AAV) expression vectors. For hippocampal CA3→CA1 synapses, AAV expression vectors of serotype 1, 5, and 8 led to light-evoked synaptic currents that depressed much more than electrically evoked currents, even though ChR2 could fire axons reliably at up to 50 Hz. The disparity between optical and electrical stimulation was eliminated when ChR2 was expressed transgenically or with AAV9. For cerebellar granule cell to stellate cell (grc→SC) synapses, AAV1 also led to artificial synaptic depression and AAV9 provided superior performance. Artificial synaptic depression also occurred when stimulating over presynaptic boutons, rather than axons, at CA3→CA1 synapses, but not at PC→DCN synapses. These findings indicate that ChR2 expression methods and light stimulation techniques influence synaptic responses in a neuron-specific manner. They also identify pitfalls associated with using ChR2 to study synapses and suggest an approach that allows optogenetics to be applied in a manner that helps to avoid potential complications.

Keywords: AAV; channelrhodopsin; optogenetics; short-term plasticity; synapse.


Figures

Figure 1.
Figure 1.
Comparing optically and electrically evoked synaptic plasticity at three central synapses. ChR2 was expressed in presynaptic cells using AAV1-ChR2. Axons were stimulated at 20 Hz 200–500 μm from the postsynaptic cell, either electrically with an extracellular electrode or optically with blue light. Postsynaptic currents (PSCs) were measured in voltage clamp for the PC→DCN (A), CA3→CA1 (B), and grc→SC synapses (C). Shown are the experimental configurations (AC, top), representative electrical and optical responses recorded in the same neurons (AC, middle), and averaged normalized PSC amplitudes evoked electrically and optically (AC, bottom). The numbers of neurons contributing to the summaries (electrical, optical) are as follows: 11, 6 for A, 25, 31 for B, and 10, 13 for C. Vertical scale bars, 100 pA. Data are expressed as average ± SEM.
Figure 2.
Figure 2.
Optically evoked plasticity is normal at the PC→DCN synapse. A, Fluorescence images in sagittal cerebellar slices of ChR2-Venus expression after AAV1-ChR2 injection (left) and hChR2-YFP expression from a PCP2-Cre X flox-hChR2 mouse (right). B, Top, Representative IPSCs evoked by electrical and optical stimulation of presynaptic axons, for AAV1- and transgenic-driven ChR2 expression. Scale bars, 1 nA for electrical and PCP2-Cre X flox-hChR2, 100 pA for AAV1-ChR2. Bottom, Averaged normalized PSC amplitudes from 10 and 50 Hz trains evoked electrically (n = 11) and optically (AAV1-ChR2, n = 6; PCP2-Cre × flox-hChR2, n = 14). Data are expressed as average ± SEM.
Figure 3.
Figure 3.
Optically evoked responses exhibit abnormal depression at the hippocampal CA3→CA1 synapse. A, Fluorescence image of ChR2-Venus expression in a transverse hippocampal slice after injection of AAV1-ChR2. B, Top, Representative EPSCs evoked by 10 and 50 Hz trains recorded from the same CA1 pyramidal neuron for both electrical and optical stimulation of Schaffer collateral axons. Bottom, Averaged normalized EPSC amplitudes during trains evoked electrically (n = 25) and optically (n = 31). C, Left, Representative EPSCs evoked optically and electrically by pairs of stimuli at 10–200 ms ISI recorded from the same neuron. Right, Averaged paired-pulse ratios evoked electrically (n = 89) and optically (n = 126). Vertical scale bars, 100 pA. Data are expressed as average ± SEM.
Figure 4.
Figure 4.
Axonal illumination reliably elicits action potentials. A, Experimental configuration. Whole-cell current clamp recordings were made from CA3 hippocampal pyramidal cells with ChR2-Venus expression driven by AAV1-ChR2. Cells were stimulated optically with light focused either over the cell soma or ∼500 μm away over the stratum radiatum. B, Less light was required to generate action potentials when the cell soma was illuminated (n = 21), but illumination over axons produced action potentials in all cells at the brightest intensities (n = 11). C, Representative spikes evoked by pairs of flashes delivered at 10–200 ms intervals. D, At the brightest laser intensity, the second flash generated a spike for all ISIs except 10 ms (n = 13). E, Representative spike train elicited by flashes delivered at 50 Hz. Same scale as in C. F, Average number of spikes elicited by 10 flashes at frequencies from 10 to 100 Hz (n = 7). Data are expressed as average ± SEM.
Figure 5.
Figure 5.
AAV1-driven expression of either ChR2 or a fluorescent protein can alter plasticity at the CA3→CA1 synapse. Fluorescence images of widespread ChR2-Venus (A) and TurboRFP expression (B) after AAV1 injections. C, D, EPSCs evoked electrically by pairs of stimuli at 10–200 ms ISI recorded from CA1 pyramidal cells in slices with the indicated properties. All scale bars, 100 pA. E, Averaged electrically evoked paired-pulse ratios from uninjected animals (n = 25), all AAV1-ChR2 injected animals (n = 89), and AAV1-ChR2 injected animals with widespread expression (n = 8). F, Averaged electrically evoked paired-pulse ratios, from uninjected animals (from E) and AAV1-TurboRFP-injected animals with widespread expression (n = 19). G, When the viral load of AAV1-ChR2 injections was lowered to 109 gc (n = 13) and 108 gc (n = 4), optically stimulating axons evoked responses, which still exhibited deficits compared with electrically evoked responses recorded from the same slices (n = 6). Data are expressed as average ± SEM.
Figure 6.
Figure 6.
Optically evoked plasticity is normal with transgenic ChR2 expression. A, Left, Whole-cell current clamp recordings from CA3 hippocampal pyramidal cells in Thy1-ChR2 mice. Cells were stimulated optically with light focused either over the cell soma (open circle) or 500 μm away over the stratum radiatum (closed circle). Right, The probability of optically evoking a spike in CA3 pyramidal cells for either somatic or axonal illumination (soma, n = 25; axon, n = 10). B, Representative spike train elicited by flashes delivered at 50 Hz. C, Top, Representative EPSCs evoked by 10 and 50 Hz stimulation of Schaffer collateral axons; both stimulation methods were recorded from the same CA1 pyramidal neuron. Bottom, Averaged normalized EPSC amplitudes during trains evoked electrically (n = 6) and optically (n = 9) at 10 and 50 Hz. D, Left, Representative EPSCs evoked optically and electrically by pairs of stimuli at 10–200 ms ISI recorded from the same neuron. Right, Averaged paired-pulse ratios evoked electrically (n = 6) and optically (n = 9). Vertical scale bars, 100 pA. Data are expressed as average ± SEM.
Figure 7.
Figure 7.
Optically evoked synaptic plasticity is normal for Cre-dependent ChR2 expression in the absence of AAV. A, To express ChR2 in CA3 neurons, Cre-dependent flox-hChR2 mice were either crossed with CaMKII-Cre mice or injected with AAV1-Cre. To control for the mutated variant hChR2 expressed by flox-hChR2 mice, WT mice were also injected with AAV1-hChR2. B, Top, Representative EPSCs evoked by optical trains delivered over axons at 10 and 50 Hz. Bottom, Averaged normalized EPSC amplitudes during trains evoked optically (flox-hChR2 × CaMKII-Cre, n = 7; flox-hChR2 + AAV1-Cre, n = 10; WT+AAV1-hChR2, n = 17) and electrically (WT uninjected mice, n = 18). C, Left, Representative EPSCs from pairs of stimuli delivered at 10–200 ms ISIs. Right, Average paired-pulse ratios for optical (flox-hChR2 × CaMKII-Cre, n = 7; flox-hChR2 + AAV-Cre, n = 18; WT+AAV-hChR2, n = 48) and electrical stimulation (WT uninjected mice, n = 25). The 20 ms data point for WT+AAV-hChR2 was offset laterally to be visible. Data are expressed as average ± SEM.
Figure 8.
Figure 8.
Effect of AAV serotype on optically evoked synaptic plasticity. A, ChR2 expression after injection of AAV5-ChR2, AAV8, or AAV9-ChR2 in WT mice. B, Top, Representative EPSCs evoked by optical trains delivered over axons at 10 and 50 Hz. Bottom, Averaged normalized EPSC amplitudes during trains evoked optically (AAV5-ChR2, n = 6; AAV8-ChR2, n = 7; AAV9-ChR2, n = 10). Curve fit to electrical stimulation in uninjected animals (Fig. 7) is also shown for comparison. C, Left, Representative EPSCs from pairs of stimuli delivered at 10–200 ms ISIs. Right, Average paired-pulse ratios for optical stimulation (AAV5-ChR2, n = 6; AAV8-ChR2, n = 7; AAV9-ChR2, n = 14) and curve fit for electrical stimulation (black, WT uninjected mice, Fig. 7). Vertical scale bars, 100 pA. Data are expressed as average ± SEM.
Figure 9.
Figure 9.
Effect of AAV serotype on optically evoked synaptic plasticity at the granule cell→stellate cell synapse. A, Experimental configuration. Parallel fiber axons from cerebellar granule cells were stimulated ∼500 μm from the recorded cell by laser illumination (blue circle) or with extracellular electrode and synaptic responses were monitored in voltage-clamp mode from stellate cells. ChR2 was expressed in granule cells by either AAV1-ChR2 or AAV9-ChR2. B, Top, Representative EPSCs evoked by trains of 10 stimuli delivered by extracellular electrode or laser illumination at 10 Hz and 50 Hz. Bottom, Averaged normalized EPSC amplitudes during trains evoked electrically (n = 10) and optically (AAV1-ChR2, n = 13; AAV9-ChR2, n = 12) at 10 Hz and 50 Hz. Vertical scale bars, 100 pA. Data are expressed as average ± SEM.
Figure 10.
Figure 10.
The performance of over-bouton stimulation is synapse dependent. ChR2 was expressed using AAV9-ChR2 and over-bouton and over-axon optical stimulation were compared for the PC→DCN (A) and the CA3→CA1 synapse (B). C, D, Representative PSCs evoked by 10 and 50 Hz stimulation over-axon and over-bouton recorded from a single DCN (C) or hippocampal CA1 (D) neuron and averaged normalized amplitudes for all cells in which responses to both stimuli were measured are shown for PC→DCN (B, n = 5) and for CA3→CA1 synapses (E, n = 6). E, F, Average normalized amplitude of the tenth PSC during stimulus trains of different frequencies, for electrical stimulation (black) and optical stimulation over-axon (red) and over-bouton (gray) for the PC→DCN (E) and CA3→CA1 synapse (F). Scale bars: C, 1000 pA; D, 100 pA. Data are expressed as average ± SEM.
Figure 11.
Figure 11.
The method of ChR2 expression determines the properties of optically evoked short-term plasticity. AC, Average normalized amplitude of the second response (top) and last response (bottom) to 50 Hz trains for all methods used to express ChR2 at the PC→DCN (A), CA3→CA1 (B), and grc→SC (C) synapses. Trains evoked by electrical stimulation were from uninjected WT animals (B) or from slices expressing ChR2 (A, C). Statistical significance (**) was assessed by one-way ANOVA followed by Tukey's post hoc test (p < 0.01). Data are expressed as average ± SEM.
Figure 12.
Figure 12.
The method of ChR2 expression determines the reliability of synaptically driven circuit activity. A, Current-clamp recordings from CA1 neurons. Action potentials were evoked by synaptic input from CA3 axons stimulated electrically (uninjected WT mice) and optically when ChR2 was expressed with AAV1-ChR2 or in Thy1-ChR2 mice. The stimulus intensity was adjusted to produce an action potential at the beginning of the train in ∼60% of trials. Spike raster plots below the current-clamp traces show firing during six trials. Examples are shown for 10 and 50 Hz stimulation. B, Average number of spikes elicited by each stimulus in the train is shown for 10 and 50 Hz stimulation (electrical, n = 9; AAV1-ChR2, n = 11, Thy1-ChR2; n = 10). Data are expressed as average ± SEM.

Similar articles

Cited by

References

    1. Aller MI, Jones A, Merlo D, Paterlini M, Meyer AH, Amtmann U, Brickley S, Jolin HE, McKenzie AN, Monyer H, Farrant M, Wisden W. Cerebellar granule cell Cre recombinase expression. Genesis. 2003;36:97–103. doi: 10.1002/gene.10204. - DOI - PubMed
    1. Arenkiel BR, Peca J, Davison IG, Feliciano C, Deisseroth K, Augustine GJ, Ehlers MD, Feng G. In vivo light-induced activation of neural circuitry in transgenic mice expressing channelrhodopsin-2. Neuron. 2007;54:205–218. doi: 10.1016/j.neuron.2007.03.005. - DOI - PMC - PubMed
    1. Boyden ES, Zhang F, Bamberg E, Nagel G, Deisseroth K. Millisecond-timescale, genetically targeted optical control of neural activity. Nat Neurosci. 2005;8:1263–1268. doi: 10.1038/nn1525. - DOI - PubMed
    1. Creager R, Dunwiddie T, Lynch G. Paired-pulse and frequency facilitation in the CA1 region of the in vitro rat hippocampus. J Physiol. 1980;299:409–424. - PMC - PubMed
    1. Cruikshank SJ, Urabe H, Nurmikko AV, Connors BW. Pathway-specific feedforward circuits between thalamus and neocortex revealed by selective optical stimulation of axons. Neuron. 2010;65:230–245. doi: 10.1016/j.neuron.2009.12.025. - DOI - PMC - PubMed

Publication types

Substances

LinkOut - more resources