

Activation of sodium-dependent glutamate transporters regulates the morphological aspects of oligodendrocyte maturation via signaling through calcium/calmodulin-dependent kinase IIβ's actin-binding/-stabilizing domain
- PMID: 24866099
- PMCID: PMC4107011
- DOI: 10.1002/glia.22699
Activation of sodium-dependent glutamate transporters regulates the morphological aspects of oligodendrocyte maturation via signaling through calcium/calmodulin-dependent kinase IIβ's actin-binding/-stabilizing domain
Abstract
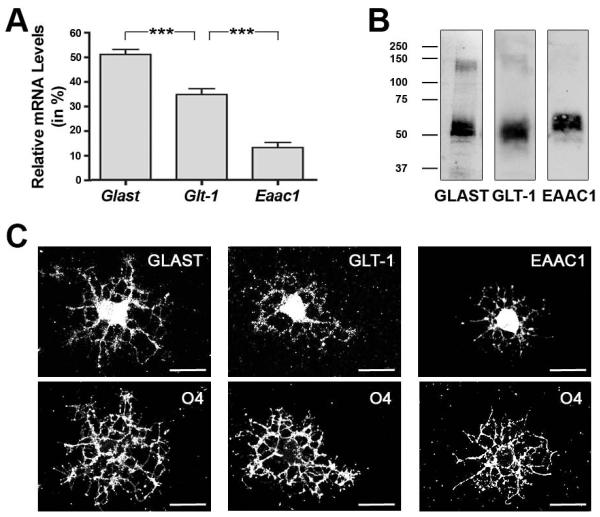
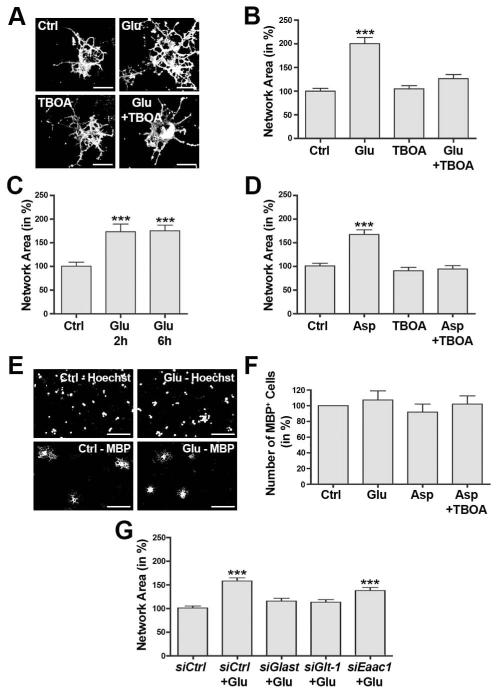
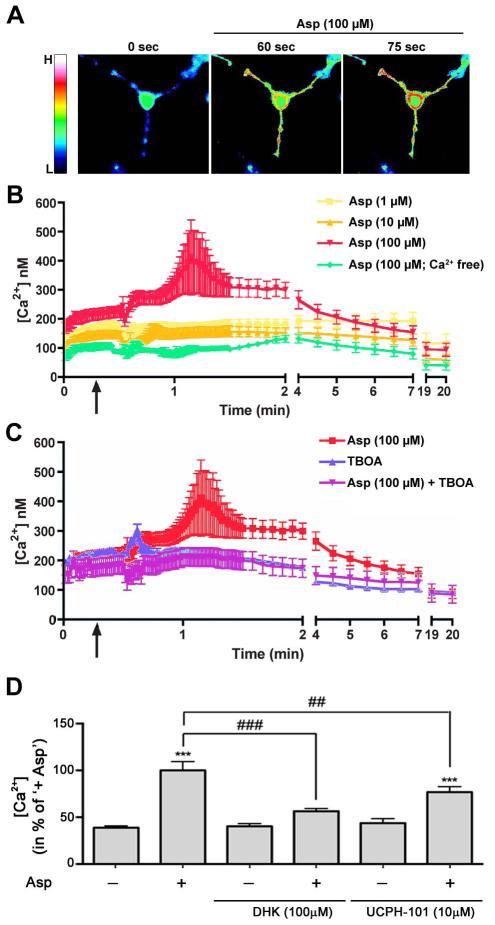
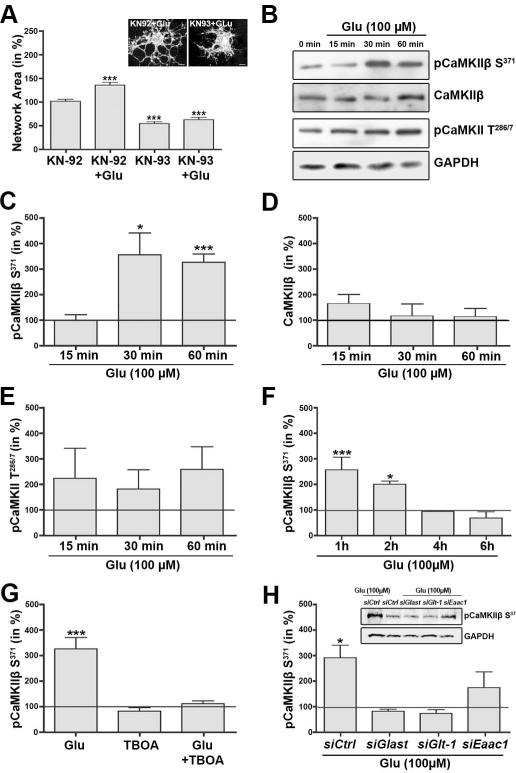
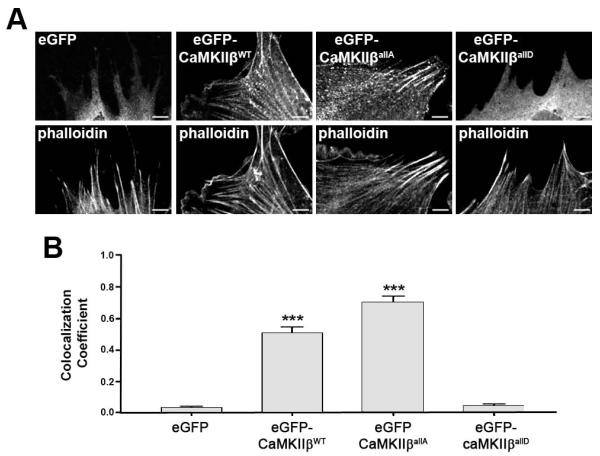
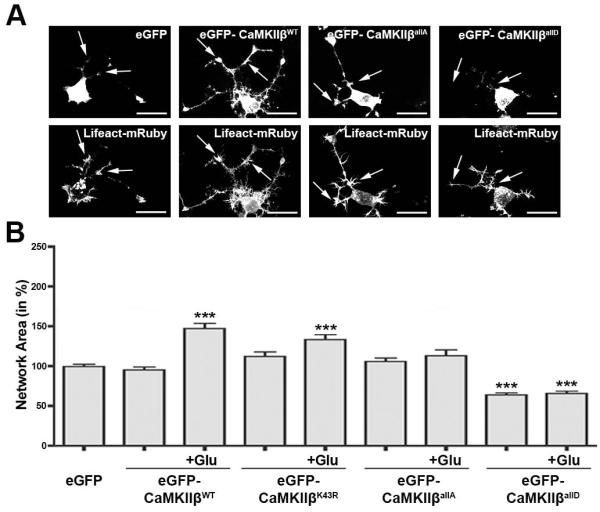
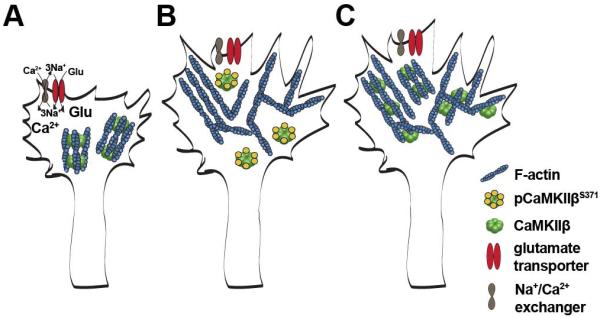
Signaling via the major excitatory amino acid glutamate has been implicated in the regulation of various aspects of the biology of oligodendrocytes, the myelinating cells of the central nervous system (CNS). In this respect, cells of the oligodendrocyte lineage have been described to express a variety of glutamate-responsive transmembrane proteins including sodium-dependent glutamate transporters. The latter have been well characterized to mediate glutamate clearance from the extracellular space. However, there is increasing evidence that they also mediate glutamate-induced intracellular signaling events. Our data presented here show that the activation of oligodendrocyte expressed sodium-dependent glutamate transporters, in particular GLT-1 and GLAST, promotes the morphological aspects of oligodendrocyte maturation. This effect was found to be associated with a transient increase in intracellular calcium levels and a transient phosphorylation event at the serine (S)(371) site of the calcium sensor calcium/calmodulin-dependent kinase type IIβ (CaMKIIβ). The potential regulatory S(371) site is located within CaMKIIβ's previously defined actin-binding/-stabilizing domain, and phosphorylation events within this domain were identified in our studies as a requirement for sodium-dependent glutamate transporter-mediated promotion of oligodendrocyte maturation. Furthermore, our data provide good evidence for a role of these phosphorylation events in mediating detachment of CaMKIIβ from filamentous (F)-actin, and hence allowing a remodeling of the oligodendrocyte's actin cytoskeleton. Taken together with our recent findings, which demonstrated a crucial role of CaMKIIβ in regulating CNS myelination in vivo, our data strongly suggest that a sodium-dependent glutamate transporter-CaMKIIβ-actin cytoskeleton axis plays an important role in the regulation of oligodendrocyte maturation and CNS myelination.
Keywords: actin cytoskeleton; calcium signaling; central nervous system; differentiation; myelin.
© 2014 Wiley Periodicals, Inc.
Figures
Similar articles
-
CaMKIIβ regulates oligodendrocyte maturation and CNS myelination.J Neurosci. 2013 Jun 19;33(25):10453-8. doi: 10.1523/JNEUROSCI.5875-12.2013. J Neurosci. 2013. PMID: 23785157 Free PMC article.
-
Primary cultures of rat cortical microglia treated with nicotine increases in the expression of excitatory amino acid transporter 1 (GLAST) via the activation of the α7 nicotinic acetylcholine receptor.Neuroscience. 2014 Jan 31;258:374-84. doi: 10.1016/j.neuroscience.2013.11.044. Epub 2013 Dec 1. Neuroscience. 2014. PMID: 24300109
-
Constitutive regulation of the glutamate/aspartate transporter EAAT1 by Calcium-Calmodulin-Dependent Protein Kinase II.J Neurochem. 2017 Feb;140(3):421-434. doi: 10.1111/jnc.13913. Epub 2017 Jan 12. J Neurochem. 2017. PMID: 27889915 Free PMC article.
-
Acute regulation of sodium-dependent glutamate transporters: a focus on constitutive and regulated trafficking.Handb Exp Pharmacol. 2006;(175):251-75. doi: 10.1007/3-540-29784-7_13. Handb Exp Pharmacol. 2006. PMID: 16722240 Review.
-
The role of astrocytic glutamate transporters GLT-1 and GLAST in neurological disorders: Potential targets for neurotherapeutics.Neuropharmacology. 2019 Dec 15;161:107559. doi: 10.1016/j.neuropharm.2019.03.002. Epub 2019 Mar 6. Neuropharmacology. 2019. PMID: 30851309 Free PMC article. Review.
Cited by
-
Glutamate Transporters and Mitochondria: Signaling, Co-compartmentalization, Functional Coupling, and Future Directions.Neurochem Res. 2020 Mar;45(3):526-540. doi: 10.1007/s11064-020-02974-8. Epub 2020 Jan 30. Neurochem Res. 2020. PMID: 32002773 Free PMC article. Review.
-
Sodium-Calcium Exchangers of the SLC8 Family in Oligodendrocytes: Functional Properties in Health and Disease.Neurochem Res. 2020 Jun;45(6):1287-1297. doi: 10.1007/s11064-019-02949-4. Epub 2020 Jan 11. Neurochem Res. 2020. PMID: 31927687 Free PMC article. Review.
-
Cytoskeletal Regulation of Oligodendrocyte Differentiation and Myelination.J Neurosci. 2017 Aug 16;37(33):7797-7799. doi: 10.1523/JNEUROSCI.1398-17.2017. J Neurosci. 2017. PMID: 28821599 Free PMC article. No abstract available.
-
Regulating Axonal Responses to Injury: The Intersection between Signaling Pathways Involved in Axon Myelination and The Inhibition of Axon Regeneration.Front Mol Neurosci. 2016 Jun 8;9:33. doi: 10.3389/fnmol.2016.00033. eCollection 2016. Front Mol Neurosci. 2016. PMID: 27375427 Free PMC article. Review.
-
Glutamatergic Transmission: A Matter of Three.Neural Plast. 2015;2015:787396. doi: 10.1155/2015/787396. Epub 2015 Aug 4. Neural Plast. 2015. PMID: 26345375 Free PMC article. Review.
References
-
- Abrahamsen B, Schneider N, Erichsen MN, Huynh TH, Fahlke C, Bunch L, Jensen AA. Allosteric modulation of an excitatory amino acid transporter: the subtype-selective inhibitor UCPH-101 exerts sustained inhibition of EAAT1 through an intramonomeric site in the trimerization domain. J Neurosci. 2013;33:1068–87. - PMC - PubMed
-
- Abramoff MD, Magelhaes PJ, Ram SJ. Image Processing with Image J. Biophotonics International. 2004;11:36–42.
-
- Arranz AM, Hussein A, Alix JJ, Perez-Cerda F, Allcock N, Matute C, Fern R. Functional glutamate transport in rodent optic nerve axons and glia. Glia. 2008;56:1353–67. - PubMed
-
- Barres BA, Hart IK, Coles HS, Burne JF, Voyvodic JT, Richardson WD, Raff MC. Cell death and control of cell survival in the oligodendrocyte lineage. Cell. 1992;70:31–46. - PubMed
Publication types
MeSH terms
Substances
Grants and funding
LinkOut - more resources
Full Text Sources
Other Literature Sources
Molecular Biology Databases
