. 2014 Jun 5;54(5):777-90.
doi: 10.1016/j.molcel.2014.04.025. Epub 2014 May 22.

LincRNA-p21 activates p21 in cis to promote Polycomb target gene expression and to enforce the G1/S checkpoint

Affiliations

LincRNA-p21 activates p21 in cis to promote Polycomb target gene expression and to enforce the G1/S checkpoint

Nadya Dimitrova et al. Mol Cell. .

Abstract

The p53-regulated long noncoding RNA lincRNA-p21 has been proposed to act in trans via several mechanisms ranging from repressing genes in the p53 transcriptional network to regulating mRNA translation and protein stability. To further examine lincRNA-p21 function, we generated a conditional knockout mouse model. We find that lincRNA-p21 predominantly functions in cis to activate expression of its neighboring gene, p21. Mechanistically, we show that lincRNA-p21 acts in concert with hnRNP-K as a coactivator for p53-dependent p21 transcription. Additional phenotypes of lincRNA-p21 deficiency could be attributed to diminished p21 levels, including deregulated expression and altered chromatin state of some Polycomb target genes, a defective G1/S checkpoint, increased proliferation rates, and enhanced reprogramming efficiency. These findings indicate that lincRNA-p21 affects global gene expression and influences the p53 tumor suppressor pathway by acting in cis as a locus-restricted coactivator for p53-mediated p21 expression.


Figures

Figure 1
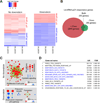
Figure 1. Loss of lincRNA-p21 affects gene expression globally
(A) Heatmaps of differentially expressed genes (Table S1) in untreated (left) and doxorubicin (Doxo)-treated (right) pairs of littermate lincRNA-p21-proficient (WT) and – deficient (KO) MEFs, FDR<0.05, |Log2 Fold change KO/WT| >0.43 in all three biological replicates. (B) Venn diagram of the overlap of the lincRNA-p21-reponsive genes in the presence and absence of doxorubicin (Doxo). (C) Connectivity maps of gene sets based on GSEA of differentially expressed genes in (A) (Table S2, FDR<0.0001). Red nodes represent enrichment with loss of lincRNA-p21 and blue represents enrichment in wild-type cells. Node size reflects the number of genes in each set and edge thickness reflects the overlap between the sets. (D) Top 12 categories of GSEA of 649 lincRNA-p21-responsive, doxorubicin-regulated genes using the CGP Collection of MSigDB. Gene sets related to the PRC2 pathway are highlighted in blue. k indicates the number of lincRNA-p21-responsive genes; K represents the number of genes included in a given gene set. See also Figures S1 and S2 and Tables 1 and 2.
Figure 2
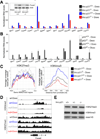
Figure 2. LincRNA-p21 promotes the expression and influences the chromatin state of a set of DNA damage-inducible, PRC2-target genes
(A–B) qRT-PCR analysis of selected lincRNA-p21-responsive, PRC2 target genes in indicated MEFs and treatments. Data, replicated in >3 independent experiments, are represented mean±SEM of technical replicates. (Inset) Immunoblot analysis of Foxa2. (C) Meta plots of the genic H3K27me3 (left) and promoter-associated H3K4me3 (right) ChIP-seq enrichment levels at lincRNA-p21-responsive, PRC2 target genes in indicated MEFs and treatments. (D) Genome browser snapshot of Foxa2 locus, related to ChIP-seq in (C). (E) Immunoblot analysis of H3K4me3 and H3K27me3 protein levels in whole cell extracts of doxorubicin-treated MEFs. Total H3 was used as a loading control. See also Figures S3, S4 and Table S4.
Figure 3
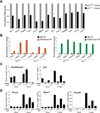
Figure 3. LincRNA-p21 regulates PRC2 target genes through p21
(A) Bar plot of normalized RNA levels of selected lincRNA-p21-regulated, PRC2 target genes in indicated cells, analyzed by qRT-PCR. Data are represented as mean±SEM, n=3. (B) ChIP-qPCR analysis of the enrichment of H3K4me3 (left) and H3K27me3 (right) at the promoters of the indicated genes in doxorubicin-treated MEFs. Data, replicated in 2 independent experiments, are represented as mean±SEM of technical replicates. (C) qRT-PCR analysis of lincRNA-p21 (left) and p21 (right) in a lincRNA-p21f/f; CreERT2 MEF line, infected with p21- or control luciferase (L)-specific shRNAs, harvested at 96 hours following mock treatment or tamoxifen (Tam)-mediated deletion of lincRNA-p21 and at 24 hours following mock treatment or doxorubicin (Doxo)-induced DNA damage. Data are represented as mean±SEM of technical replicates. (D) qRT-PCR analysis of the effects of the treatments described in (C) on the expression levels of indicated lincRNA-p21-regulated, PRC2 target genes. Data were confirmed with an independent p21-targeting shRNA (not shown). See also Figure S5 and Table S4.
Figure 4
Figure 4. LincRNA-p21 RNA activates p21
(A) Schematic of the lincRNA-p21/p21 locus, the targeting strategy, the positions of p53REs (*) in the promoters of lincRNA-p21 and p21, and the target sequences of lincRNA-p21-specific ASO1 and ASO3. (B) qRT-PCR analysis of lincRNA-p21, p21, and Srsf3 RNA levels in indicated MEFs at indicated time-points after tamoxifen (Tam) treatment. Data, replicated in 2 independent experiments, are represented as mean±SEM of technical replicates. (C) Immunoblot analysis of p21 protein levels in MEFs described in (B). β-tubulin was used as a loading control. (D–E) qRT-PCR and immunoblot analysis of p21 in MEFs of indicated genotypes, harvested 8 hours following treatment with the indicated doses of γ-irradiation (IR). Data, replicated in 2 independent experiments, are represented as mean±SEM of technical replicates. (F–G) qRT-PCR and immunoblot analysis of p21 in MEFs of indicated genotypes, harvested untreated or 8 hours following doxorubicin (Doxo) treatment. Data are represented as mean±SEM, n=8, p<0.0001, paired t-test. (H) qRT-PCR analysis of lincRNA-p21 RNA levels at indicated time-points following transfection with the indicated control non-targeting or lincRNA-p21-specific ASOs. (I) qRT-PCR analysis of p21 RNA levels at 96 h following two consecutive ASO transfections, performed at a 48 h interval, in MEFs of indicated genotypes. Data are represented as mean±SEM, n=4, p=0.0318, paired t-test. (J) qRT-PCR analysis of p21 RNA levels in ASO-treated wild-type MEFs, harvested 20 h post 5 Gy irradiation. Data are represented as mean±SEM of technical replicates. See also Figure S6 and Table S4.
Figure 5
Figure 5. LincRNA-p21 regulates p21in cis
(A) Single molecule RNA FISH detection of lincRNA-p21 with exon-specific probes in indicated MEFs (white arrows). DNA was counterstained with DAPI. % represents the fraction of cells with indicated number of signals per cell (n=150). (B) Co-localization of exon- and intron-specific lincRNA-p21 signals using single molecule RNA FISH. (C) (Top) Schematic. (Bottom) qRT-PCR analysis of lincRNA-p21 and p21 RNA levels in MEFs of indicated genotypes and treatments. Data are represented as mean±SEM, n=3, p<0.0001, paired t-test. (D) qRT-PCR analysis of lincRNA-p21 (top) and p21 (bottom) RNA levels in MEFs of indicated genotypes, expressing TRE-lincRNA-p21, in the presence or absence of doxorubicin (Doxo) and doxycycline (Doxy). Data, replicated in 2 independent experiments, are represented as mean±SEM of technical replicates. (E) Single molecule RNA-FISH detection of exogenously expressed lincRNA-p21 in (D).See also Table S4.
Figure 6
Figure 6. LincRNA-p21 acts with hnRNP-K as a transcriptional co-activator of p53-mediated expression of p21
(A) Schematic of the positions of qPCR primers used for ChIP analysis, indicating the distance (base pairs) relative to the p21 transcription start site (TSS). (B) A representative hnRNP-K ChIP-qPCR analysis in indicated MEF lines, harvested 8 hours following doxorubicin treatment. Data, replicated in 4 independent experiments, are represented as mean±SEM of technical replicates (n=4, p=0.0020, paired t-test). (C) A representative p53 ChIP-qPCR analysis using the −2990 (p53RE) primer set in indicated MEF lines, harvested 8 hours following doxorubicin treatment. Data, replicated in 3 independent experiments, are represented as mean±SEM of technical replicates (n=3, p=0.043, paired t-test). (D) ChIP-qPCR analysis of the relative p53 binding at the −2990 (p53RE) site of the p21 promoter in ASO-treated wild type MEFs. Data are represented as mean±SEM of technical replicates. (E–G) qRT-PCR analysis of (E) hnRNP-K, (F) p21 (mean±SEM , n=4, p=0.0326, paired t-test), and (G) lincRNA-p21 (mean±SEM , n=3, p=0.0030, paired t-test) levels in indicated MEFs, expressing luciferase (luci) or hnRNP-K (K)-specific shRNAs, harvested at 8 hours following doxorubicin treatment. See also Figure S7A and Table S4.
Figure 7
Figure 7. LincRNA-p21 controls the G1/S checkpoint, proliferation, and the induction of pluripotency
(A) (Top) Schematic of the G1/S checkpoint assay. (Bottom, left) FACS analysis of the fraction of BrdU-positive cells in irradiated samples relative to untreated cells. Data are represented as mean±SEM, n=4, p=0.0060, paired t-test. (Bottom, right) FACS analysis of the fraction of BrdU-positive cells in wild type samples, transfected with the indicated ASOs. (B) Proliferation of lincRNA-p21+/+ and −/− MEFs isolated from littermates. (C) qRT-PCR analysis of lincRNA-p21, p21, and Nanog levels in RNA harvested from lincRNA-p21-proficient and –deficient cells at 6 days following infection with the reprogramming factors Oct4, Sox2, Klf4, and Myc (OSKM). Data are represented as mean±SEM, n=3, p=0.0004, paired t-test. (D) Images of alkaline phosphatase-positive colonies stained 6 days following infection of MEFs with indicated genotypes with OSKM. See also Figure S7B–F and Table S4.

Similar articles

Cited by

References

    1. Aldiri I, Vetter ML. PRC2 during vertebrate organogenesis: a complex in transition. Dev Biol. 2012;367(2):91–99. - PMC - PubMed
    1. Brugarolas J, Chandrasekaran C, Gordon JI, Beach D, Jacks T, Hannon GJ. Radiation-induced cell cycle arrest compromised by p21 deficiency. Nature. 1995;377(6549):552–557. - PubMed
    1. Davidovich C, Zheng L, Goodrich KJ, Cech TR. Promiscuous RNA binding by Polycomb repressive complex 2. Nat Struct Mol Biol. 2013;20(11):1250–1257. - PMC - PubMed
    1. Deng C, Zhang P, Harper JW, Elledge SJ, Leder P. Mice lacking p21CIP1/WAF1 undergo normal development, but are defective in G1 checkpoint control. Cell. 1995;82(4):675–684. - PubMed
    1. Engreitz JM, Pandya-Jones A, McDonel P, Shishkin A, Sirokman K, Surka C, Kadri S, Xing J, Goren A, Lander ES, Plath K, Guttman M. The Xist lncRNA exploits three-dimensional genome architecture to spread across the X chromosome. Science. 2013;341(6147):1237973. - PMC - PubMed

Publication types

Substances

Associated data