

Probing the non-native H helix translocation in apomyoglobin folding intermediates
- PMID: 24857522
- PMCID: PMC4067146
- DOI: 10.1021/bi500478m
Probing the non-native H helix translocation in apomyoglobin folding intermediates
Abstract
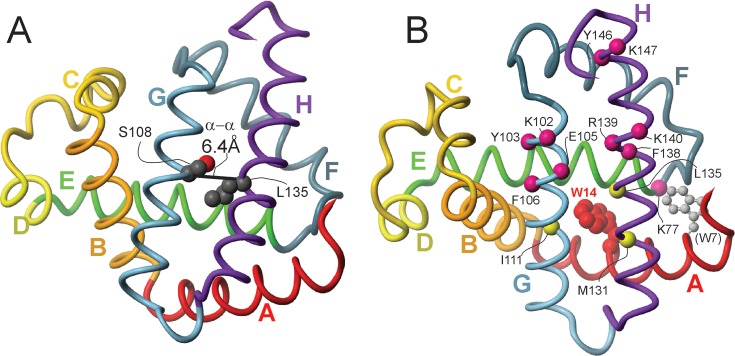
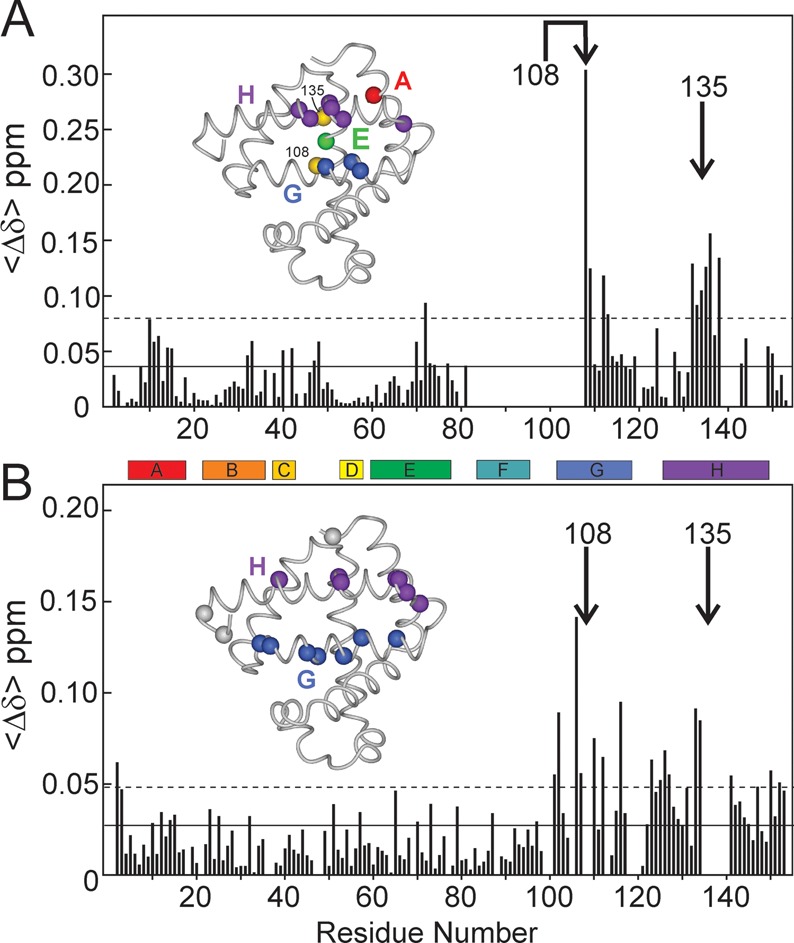
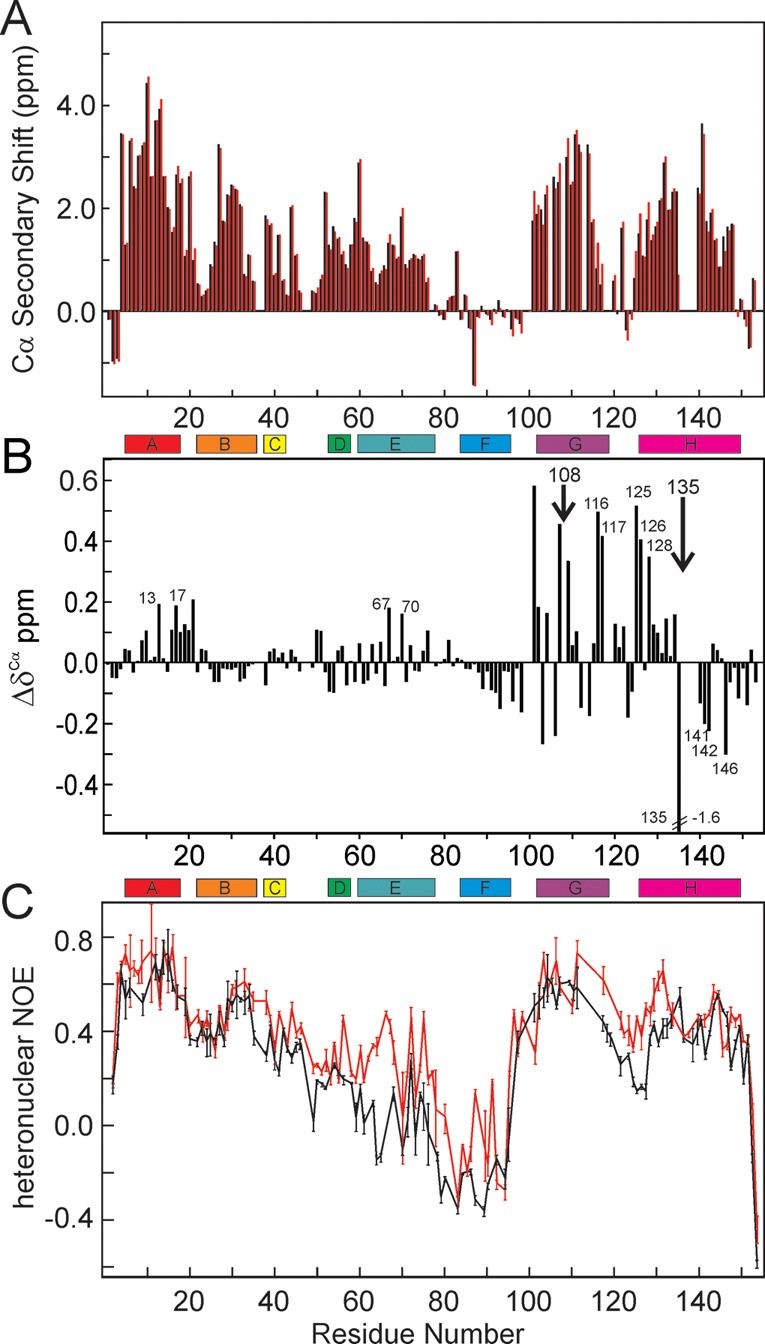
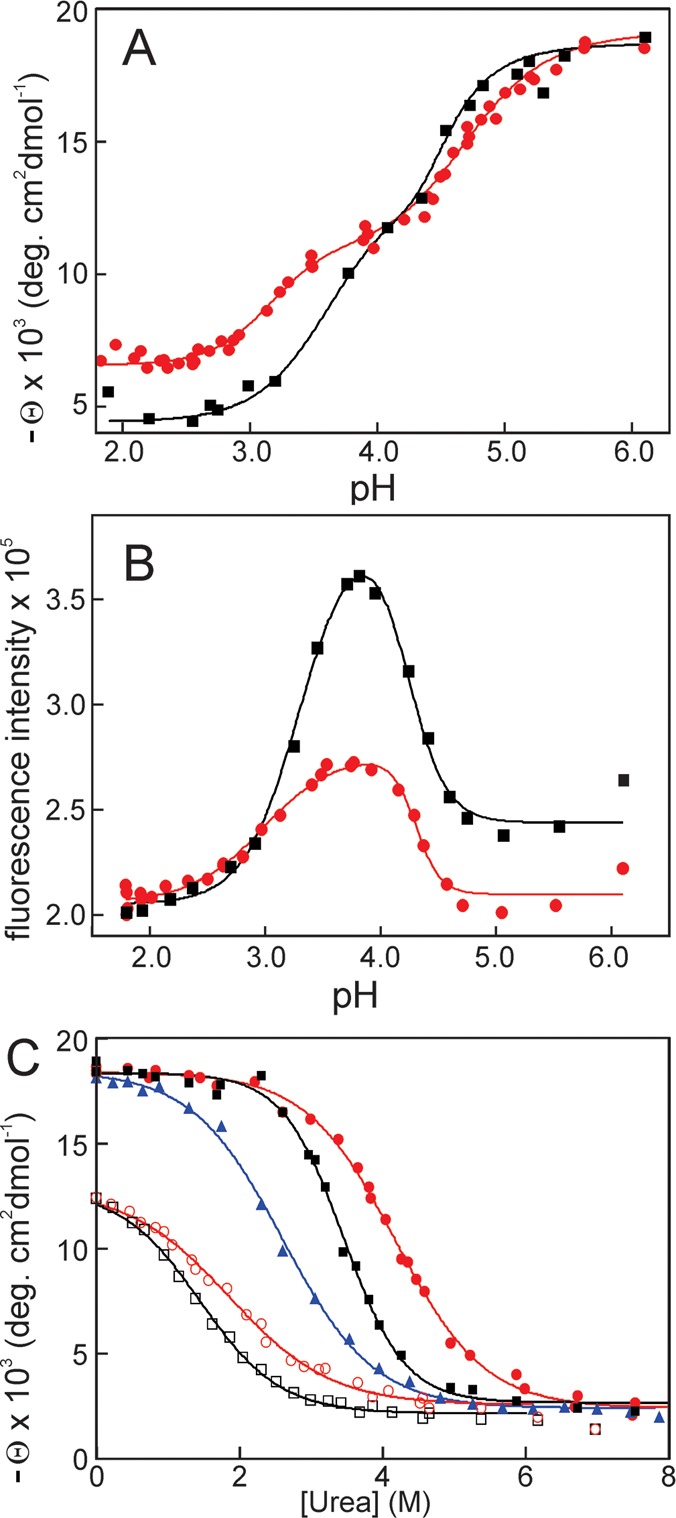
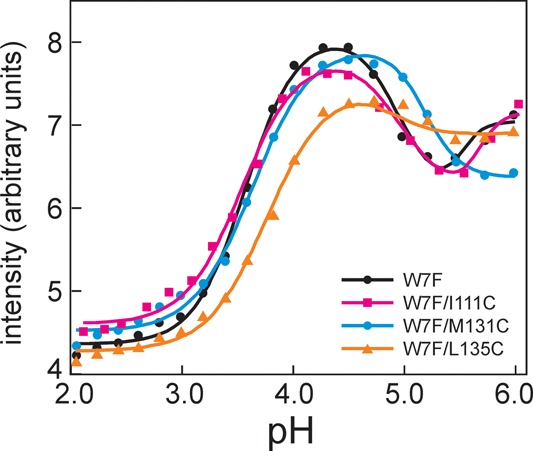
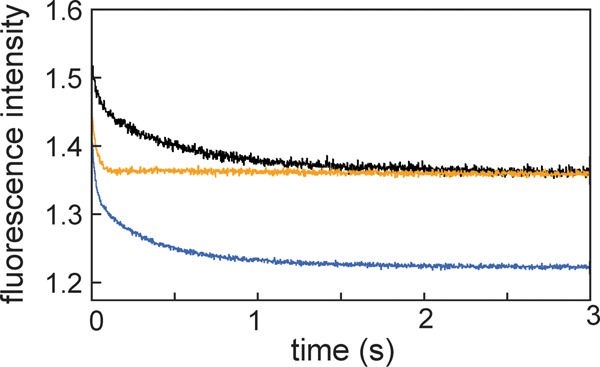
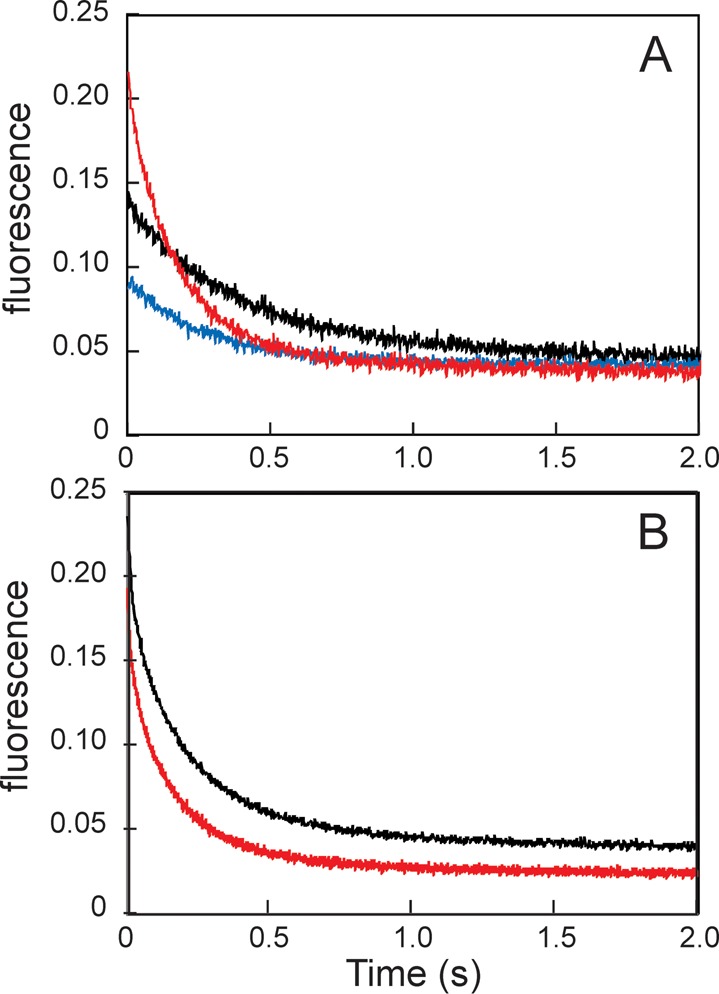
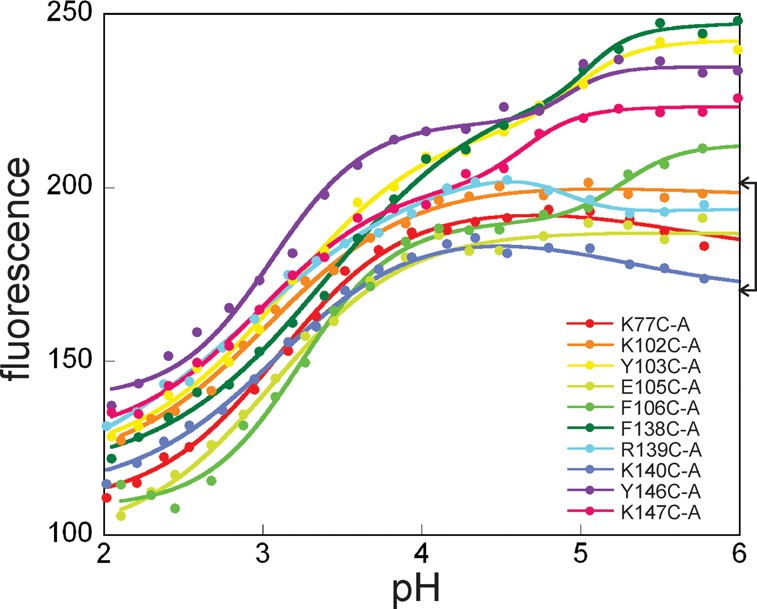
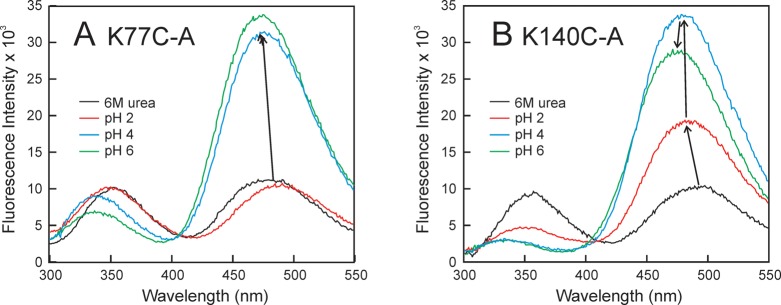
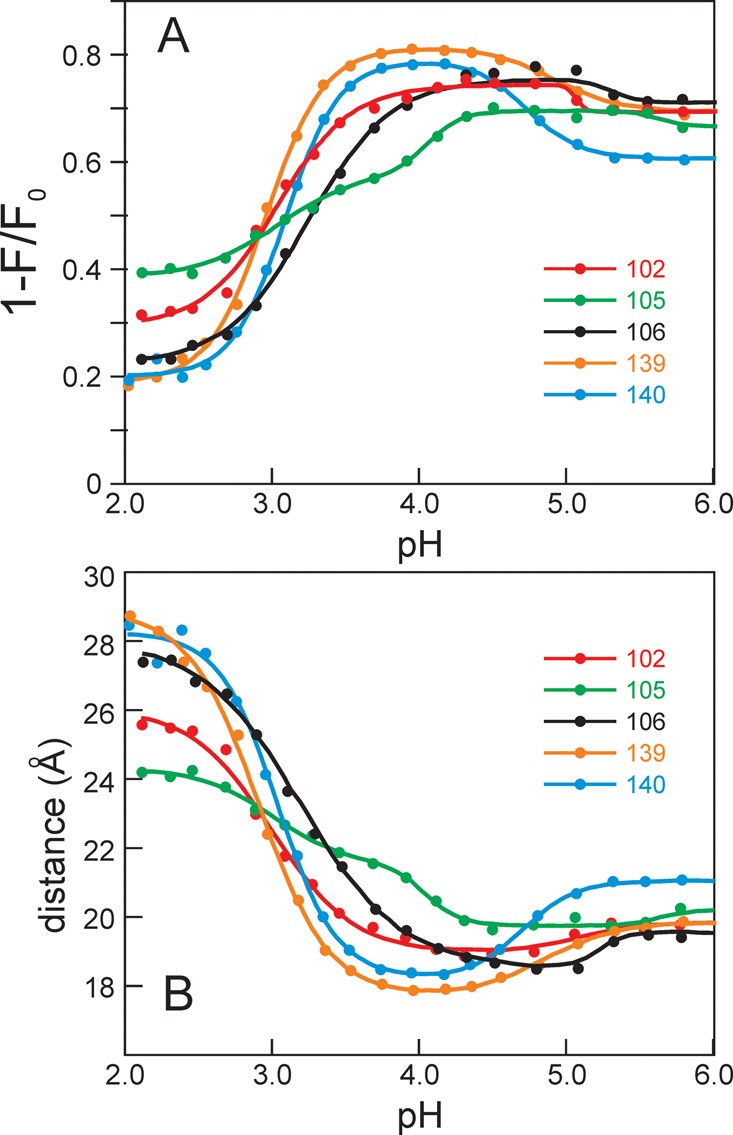
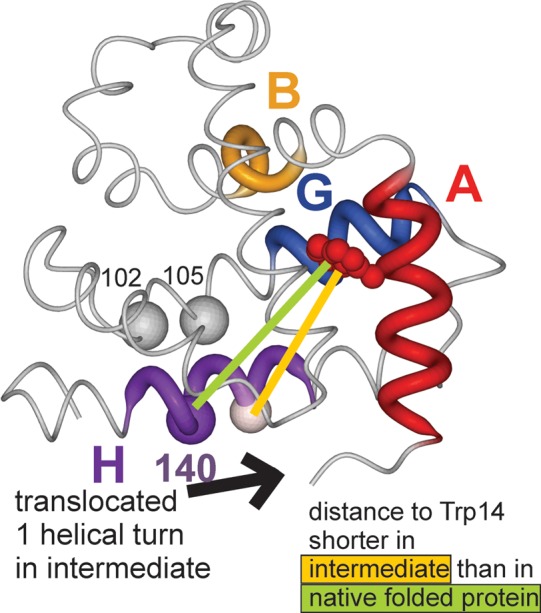
Apomyoglobin folds via sequential helical intermediates that are formed by rapid collapse of the A, B, G, and H helix regions. An equilibrium molten globule with a similar structure is formed near pH 4. Previous studies suggested that the folding intermediates are kinetically trapped states in which folding is impeded by non-native packing of the G and H helices. Fluorescence spectra of mutant proteins in which cysteine residues were introduced at several positions in the G and H helices show differential quenching of W14 fluorescence, providing direct evidence of translocation of the H helix relative to helices A and G in both the kinetic and equilibrium intermediates. Förster resonance energy transfer measurements show that a 5-({2-[(acetyl)amino]ethyl}amino)naphthalene-1-sulfonic acid acceptor coupled to K140C (helix H) is closer to Trp14 (helix A) in the equilibrium molten globule than in the native state, by a distance that is consistent with sliding of the H helix in an N-terminal direction by approximately one helical turn. Formation of an S108C-L135C disulfide prevents H helix translocation in the equilibrium molten globule by locking the G and H helices into their native register. By enforcing nativelike packing of the A, G, and H helices, the disulfide resolves local energetic frustration and facilitates transient docking of the E helix region onto the hydrophobic core but has only a small effect on the refolding rate. The apomyoglobin folding landscape is highly rugged, with several energetic bottlenecks that frustrate folding; relief of any one of the major identified bottlenecks is insufficient to speed progression to the transition state.
Figures
Similar articles
-
Folding of apomyoglobin: Analysis of transient intermediate structure during refolding using quick hydrogen deuterium exchange and NMR.Proc Jpn Acad Ser B Phys Biol Sci. 2017;93(1):10-27. doi: 10.2183/pjab.93.002. Proc Jpn Acad Ser B Phys Biol Sci. 2017. PMID: 28077807 Free PMC article. Review.
-
Energetic frustration of apomyoglobin folding: role of the B helix.J Mol Biol. 2010 Mar 12;396(5):1319-28. doi: 10.1016/j.jmb.2009.12.040. Epub 2010 Jan 4. J Mol Biol. 2010. PMID: 20043917 Free PMC article.
-
Identification of native and non-native structure in kinetic folding intermediates of apomyoglobin.J Mol Biol. 2006 Jan 6;355(1):139-56. doi: 10.1016/j.jmb.2005.10.047. Epub 2005 Nov 8. J Mol Biol. 2006. PMID: 16300787
-
Conformational and dynamic characterization of the molten globule state of an apomyoglobin mutant with an altered folding pathway.Biochemistry. 2001 Dec 4;40(48):14459-67. doi: 10.1021/bi011500n. Biochemistry. 2001. PMID: 11724558
-
The apomyoglobin folding pathway revisited: structural heterogeneity in the kinetic burst phase intermediate.J Mol Biol. 2002 Sep 20;322(3):483-9. doi: 10.1016/s0022-2836(02)00810-0. J Mol Biol. 2002. PMID: 12225742 Review.
Cited by
-
Protein tertiary structure and the myoglobin phase diagram.Sci Rep. 2019 Jul 25;9(1):10819. doi: 10.1038/s41598-019-47317-y. Sci Rep. 2019. PMID: 31346242 Free PMC article.
-
Protein folding in vitro and in the cell: From a solitary journey to a team effort.Biophys Chem. 2022 Aug;287:106821. doi: 10.1016/j.bpc.2022.106821. Epub 2022 Apr 29. Biophys Chem. 2022. PMID: 35667131 Free PMC article. Review.
-
Non-Native Structures of Apomyoglobin and Apoleghemoglobin in Folding Intermediates Related to the Protein Misfolding.Molecules. 2023 May 8;28(9):3970. doi: 10.3390/molecules28093970. Molecules. 2023. PMID: 37175379 Free PMC article. Review.
-
How Does Your Protein Fold? Elucidating the Apomyoglobin Folding Pathway.Acc Chem Res. 2017 Jan 17;50(1):105-111. doi: 10.1021/acs.accounts.6b00511. Epub 2016 Dec 29. Acc Chem Res. 2017. PMID: 28032989 Free PMC article.
-
Folding of apomyoglobin: Analysis of transient intermediate structure during refolding using quick hydrogen deuterium exchange and NMR.Proc Jpn Acad Ser B Phys Biol Sci. 2017;93(1):10-27. doi: 10.2183/pjab.93.002. Proc Jpn Acad Ser B Phys Biol Sci. 2017. PMID: 28077807 Free PMC article. Review.
References
-
- Udgaonkar J. B.; Baldwin R. L. (1988) NMR evidence for an early framework intermediate on the folding pathway of ribonuclease A. Nature 335, 694–699. - PubMed
-
- Lyon C. E.; Suh E. S.; Dobson C. M.; Hore P. J. (2002) Probing the exposure of tyrosine and tryptophan residues in partially folded proteins and folding intermediates by CIDNP pulse-labeling. J. Am. Chem. Soc. 124, 13018–13024. - PubMed
-
- Balbach J.; Forge V.; van Nuland N. A. J.; Winder S. L.; Hore P. J.; Dobson C. M. (1995) Following protein folding in real time using NMR spectroscopy. Nat. Struct. Biol. 2, 865–870. - PubMed
-
- Balbach J. (2000) Compaction during protein folding studied by real-time NMR diffusion experiments. J. Am. Chem. Soc. 122, 5887–5888.
Publication types
MeSH terms
Substances
Grants and funding
LinkOut - more resources
Full Text Sources
Other Literature Sources
