. 2014 Jun 5;157(6):1393-1404.
doi: 10.1016/j.cell.2014.03.064. Epub 2014 May 22.

A monoclonal antibody that targets a NaV1.7 channel voltage sensor for pain and itch relief

Affiliations

A monoclonal antibody that targets a NaV1.7 channel voltage sensor for pain and itch relief

Jun-Ho Lee et al. Cell. .

Retraction in

Abstract

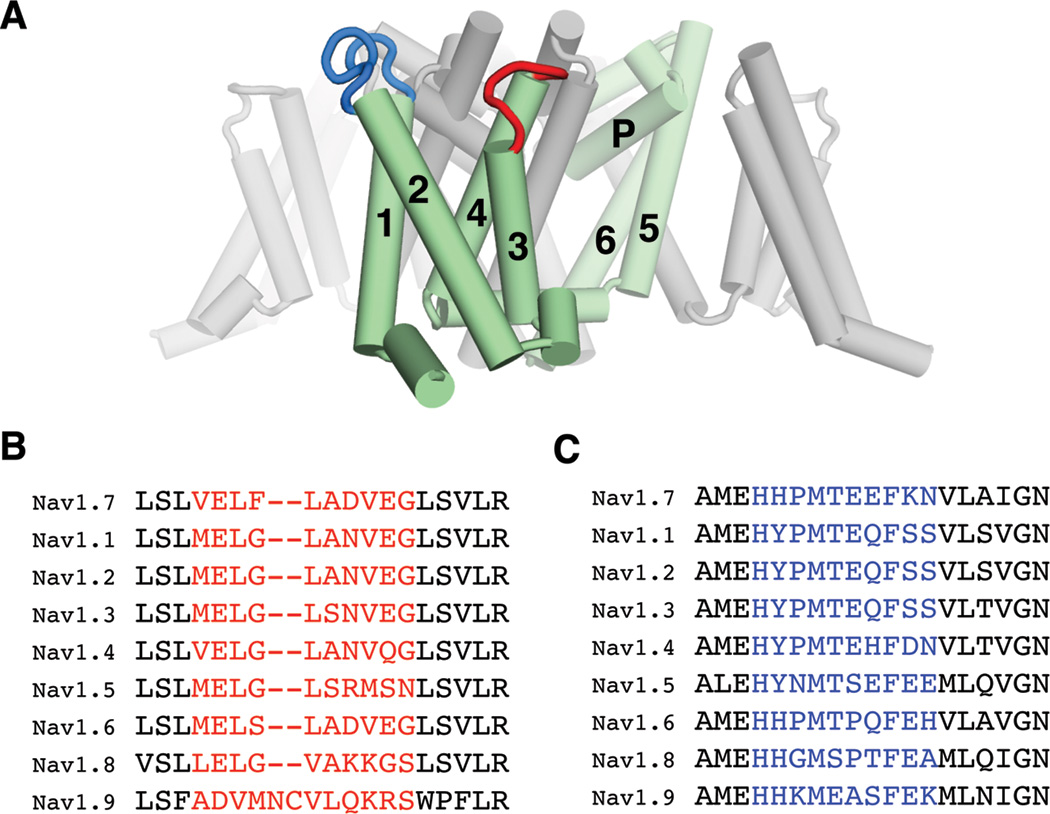
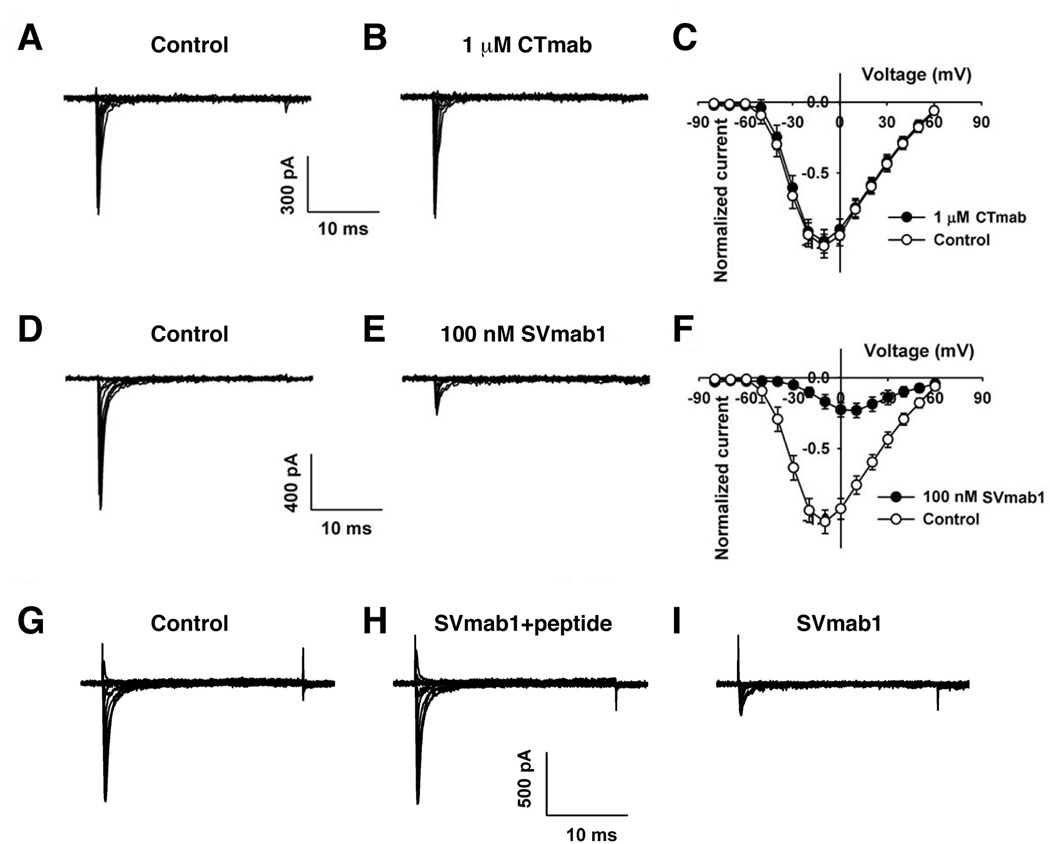
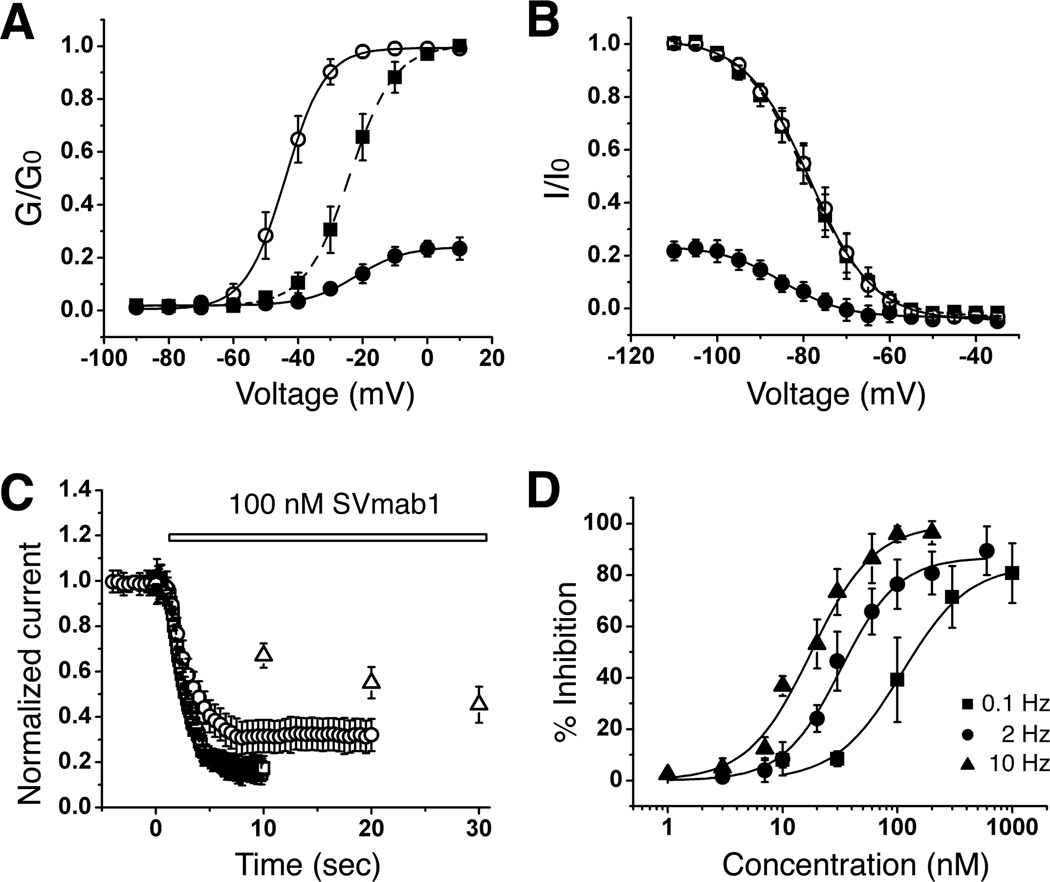
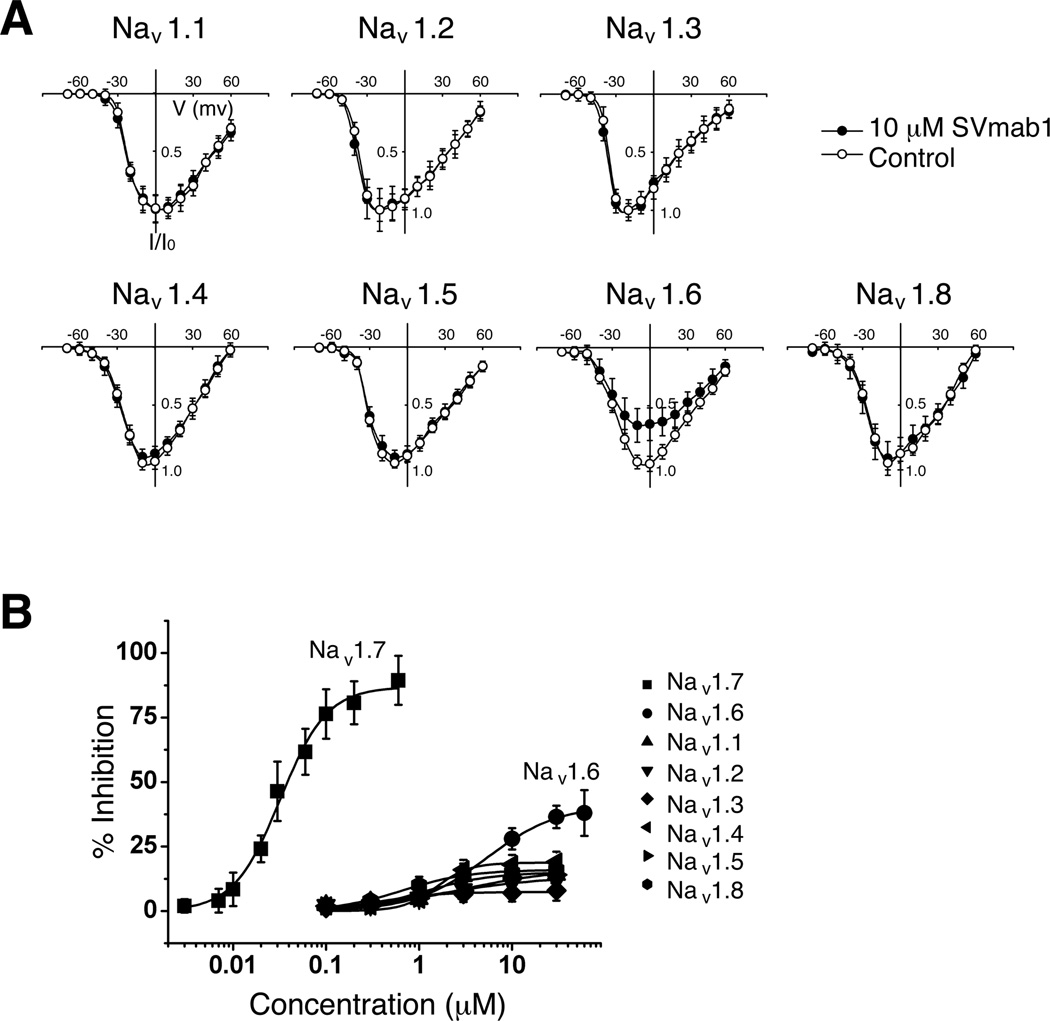
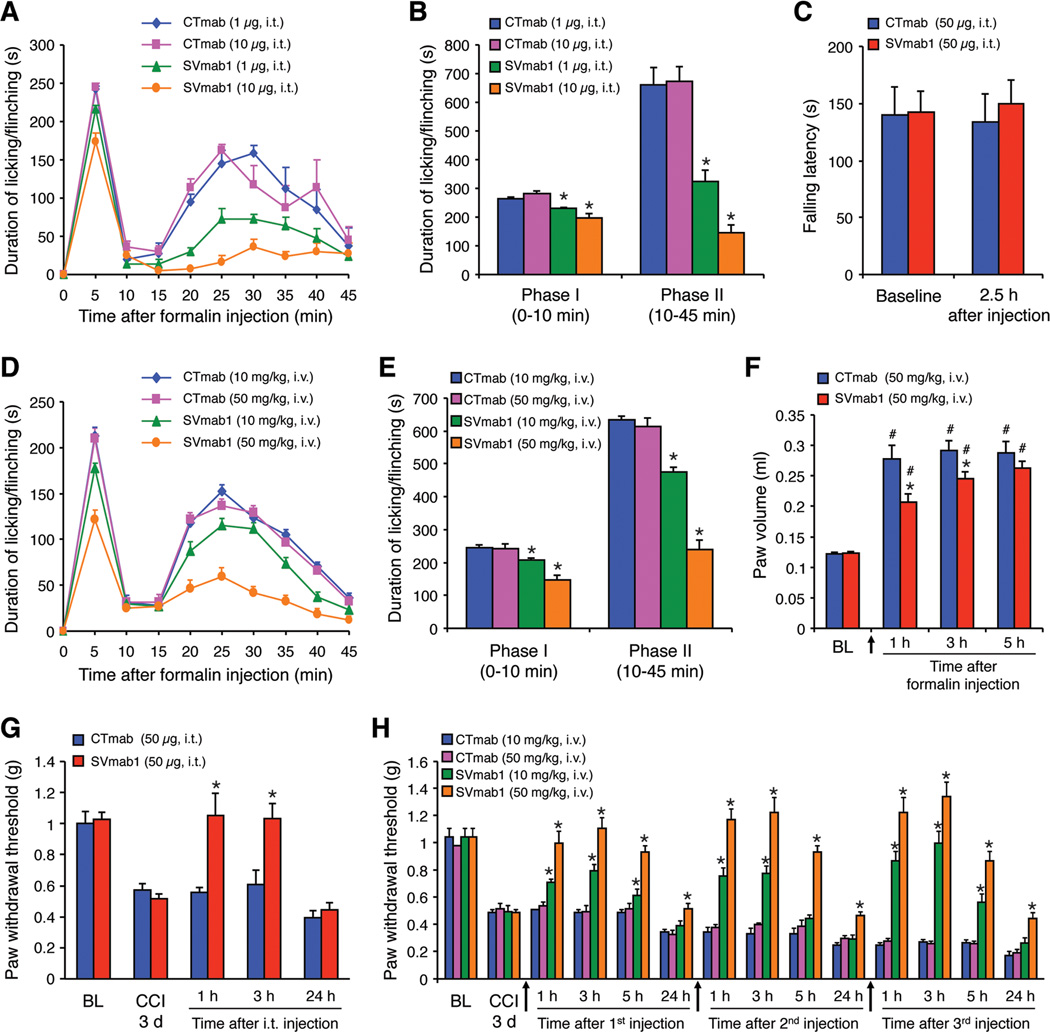
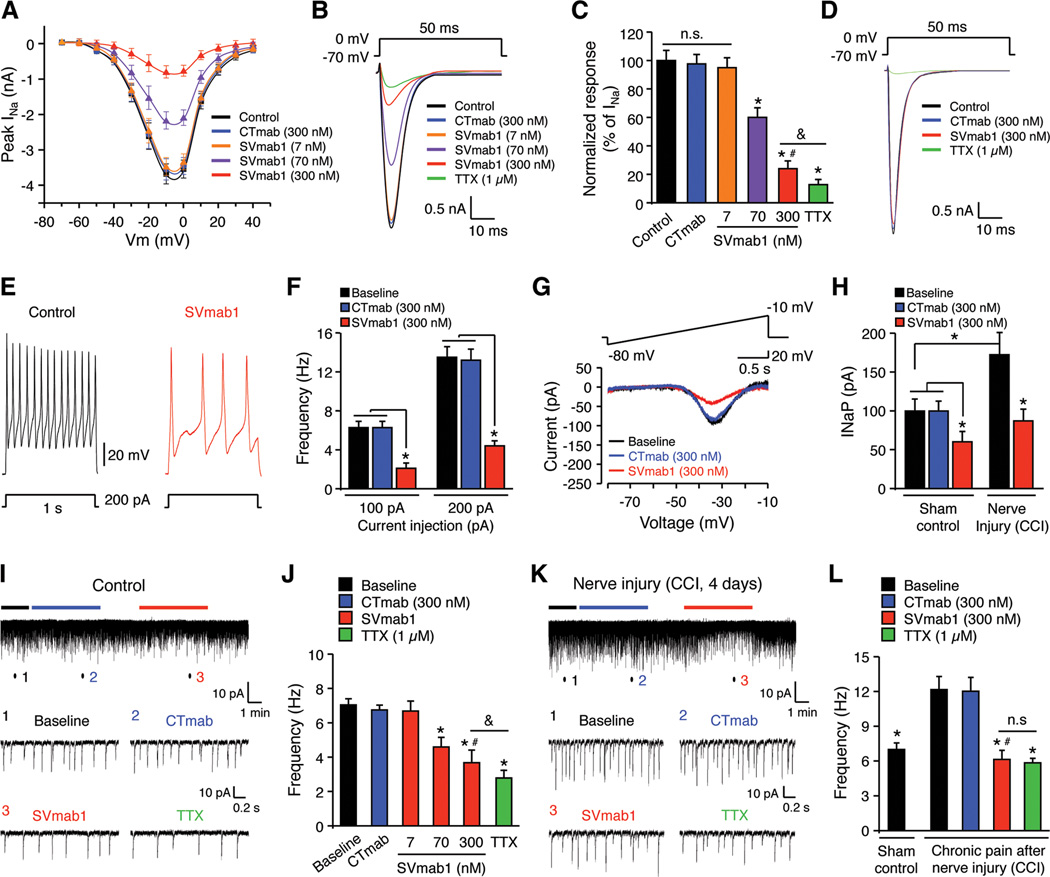
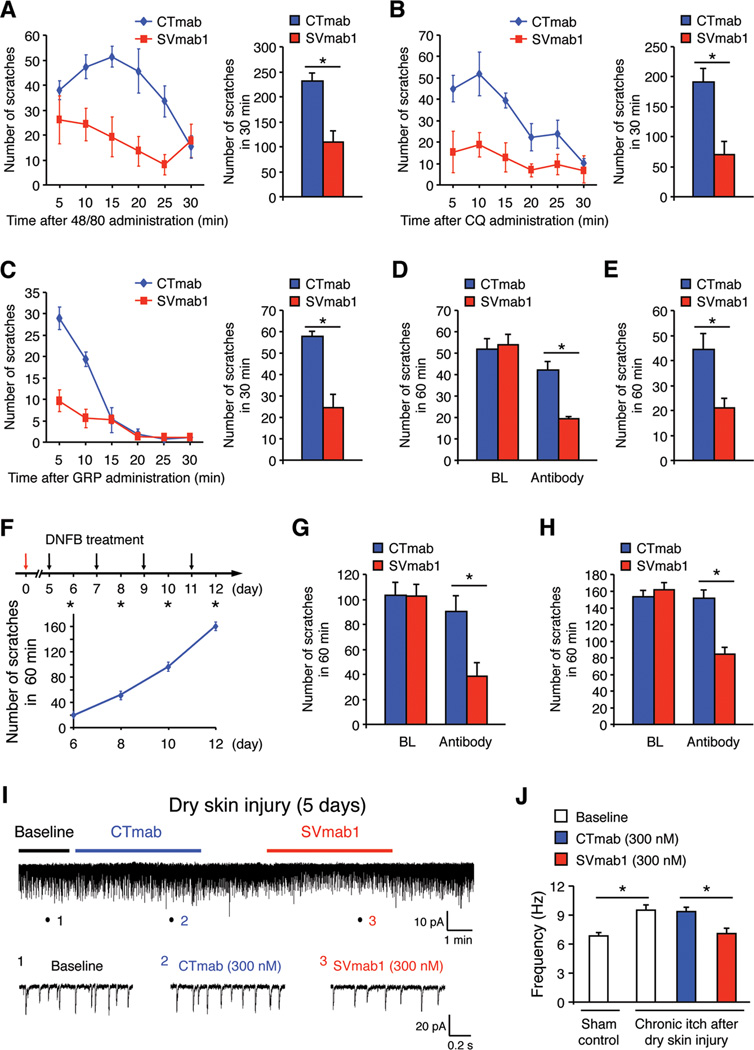
Voltage-gated sodium (NaV) channels control the upstroke of the action potentials in excitable cells. Multiple studies have shown distinct roles of NaV channel subtypes in human physiology and diseases, but subtype-specific therapeutics are lacking and the current efforts have been limited to small molecules. Here, we present a monoclonal antibody that targets the voltage-sensor paddle of NaV1.7, the subtype critical for pain sensation. This antibody not only inhibits NaV1.7 with high selectivity, but also effectively suppresses inflammatory and neuropathic pain in mice. Interestingly, the antibody inhibits acute and chronic itch despite well-documented differences in pain and itch modulation. Using this antibody, we discovered that NaV1.7 plays a key role in spinal cord nociceptive and pruriceptive synaptic transmission. Our studies reveal that NaV1.7 is a target for itch management, and the antibody has therapeutic potential for suppressing pain and itch. Our antibody strategy may have broad applications for voltage-gated cation channels.


Figures

Figure 1
Figure 1. Locations of the epitopes and their sequences among the NaV subtypes
(A) The chosen epitopes are mapped on the crystal structure of a bacterial NaV channel (Payandeh et al., 2011). One of the four repeats, composed of 6 transmembrane helices (S1–S6; 1–6), is colored green. The loops between S3–S4 and between S1–S2 are colored red and blue, respectively. (B) and (C) Sequence alignments corresponding to the S3–S4 (B) and S1–S2 (C) loops of hNaV subtypes. The regions chosen for raising antibodies are colored red and blue, respectively.
Figure 2
Figure 2. SVmab1 inhibits hNaV1.7 through specific interactions between the voltage-sensor paddle and SVmab1
Representative current traces from HEK293 cells expressing hNaV1.7 in the absence (A) or presence (B) of 1 µM CTmab and in the absence (D) or presence (E) of 100 nM SVmab1. Current-voltage relationships in the absence (○) or presence (●) of 1 µM CTmab (C) and 100 nM SVmab1 (F) were generated using 30 ms voltage steps between −80 and +60 mV with 10 mV increments from a holding potential of −120 mV. Representative traces and currentvoltage relationship from HEK293 cells expressing hNaV1.7 channels (G), in the presence of SVmab1 (100 nM) and the peptide (1 µM) (H), and in the presence of SVmab1 (100 nM) only after washout SVmab1 and the peptide (I).
Figure 3
Figure 3. SVmab1 inhibits NaV1.7 by stabilizing a closed state and in a state-dependent manner in HEK293 cells
(A) Voltage dependence of steady-state activation in the absence (○) or presence (●) of 100 nM SVmab1. Activation curves were generated using a 30-ms test pulse in 5 mV increments from −90 to +10 mV from a holding potential of −120 mV. Values from individual cells were normalized to the maximum conductance value (G0) in the absence of SVmab1. Normalized curves were fit using the Boltzmann equation. The solid squares (■) show the same SVmab1-modified activation curve as the solid circles (●) but scaled to the curve in the absence of SVmab1 (○). The half-activation voltage (Vmid) in the presence of SVmab1 (●) was −24.0 ± 0.2 mV compared with −43.9 ± 0.2 mV in the absence of SVmab1 (○). (B) Steady-state inactivation curves in the absence (○) or presence (●) of 100 nM SVmab1 were obtained using 5 mV increments from −110 mV to −30 mV for 500 ms followed by a test pulse to −10 mV for 30 ms. The solid squares (■) show the same SVmab1-modified steady-state inactivation curve as the solid circles (●) but scaled to the curve in the absence of SVmab1 (○). The half-inactivation voltage was unaffected by SVmab1 (−79.3 ± 0.3 mV in the absence of SVmab1 (○) and −78.6 ± 0.2 mV in the presence of SVmab1 (●)). Data are means ± SEM. (n = 10–12/group). (C) State (use)-dependent inhibition of hNaV1.7 by SVmab1. Plot of normalized current amplitudes during 30-ms depolarizing pulses to −10 mV applied from a holding potential of −120 mV at 0.1 (△), 2 (○), and 10 (□) Hz in the presence of 100 nM SVmab1. (D) Concentration–response curves of SVmab1 inhibition of hNaV1.7 currents at different frequencies (0.1, 2, and 10 Hz). IC50 and maximum inhibition values are 106.7 ± 18.0 nM and 83.7 ± 5.6 % for 0.1 Hz, 30.7 ± 1.9 nM and 86.0 ± 2.3 % for 2 Hz, and 16.7 ± 1.6 nM and 98.6 ± 4.1 for 10 Hz.
Figure 4
Figure 4. SVmab1 inhibits hNaV1.7 in a subtype-specific manner in HEK293 cells
(A) Current-voltage relationships of the seven different NaV channel subtypes in the absence (○) and presence (●) of 10 µM SVmab1. Voltage steps were applied from −80 to +60 mV taken in 10-mV increments for 30 ms at a holding potential of −120 mV. (B) Concentration–response curves of the NaV channel subtypes (IC50 = 30.9 ± 1.9 nM for NaV1.7, 6.3 ± 2.2 µM for NaV1.6, and >5 µM for NaV1.1, 1.2, 1.3, 1.4, 1.5, and 1.8). Sodium currents were elicited by stepping to −10 mV from a holding potential of −120 mV for a duration of 30 ms at a frequency of 2 Hz. Data are shown as means ± SEM. (n = 6–10/group).
Figure 5
Figure 5. SVmab1 reduces inflammatory and neuropathic pain without affecting motor coordination and balance
(A, B) Intrathecal injection of SVmab1 reduces the formalin-induced inflammatory pain. (A) Time course of licking and flinching behavior following intraplantar injection of 5% formalin. (B) Formalin-induced Phase-I (1–10 min) and Phase-II (10–45 min) responses. *P < 0.05, compared with the corresponding control (CTmab). (C) Falling latency (time on rota-rod) in the rota-rod test and the effects of SVmab1 and CTmab (50 µg, i.t.). (D–F) Systemic injection of SVmab1 (10 and 50 mg /kg, i.v.) also reduces the formalin-induced inflammatory pain and edema. (D) Time course of formalin-induced pain. (E) Formalin-induced 1st and 2nd phase responses. (F) Formalin-induced paw edema (volume of an affected hindpaw). (G) Intrathecal (i.t.) injection of SVmab1 (50 µg) reduces the CCI-induced neuropathic pain (mechanical allodynia). (H) Systemic injections of SVmab1 (10 and 50 mg/kg, i.v.) dose-dependently reduce the CCI-induced neuropathic pain (mechanical allodynia). Arrows indicate the time at which antibodies were injected. All the data are shown as means ± S.E.M. BL, baseline. *P < 0.05, vs. corresponding CTmab at the same dose (B, E, F, G, H); #P < 0.05, vs. baseline (F). n = 5–6 mice/group.
Figure 6
Figure 6. SVmab1 suppresses transient and persistent sodium currents and action potentials in small-sized DRG neurons and nociceptive synaptic transmission in spinal cord slices
(A–D) SVmab1 suppresses transient sodium currents (INaT) in dissociated DRG neurons. (A) Current-voltage relationship of INaT and the effects of SVmab1 (7, 70, and 300 nM) and CTmab (300 nM), n = 15–20 neurons/group. (B) Traces of INaT and the effects of SVmab1, CTmab (300 nM), and TTX (1 µM). (C) Percentage inhibition of INaT by SVmab1 and TTX (1 µM). *P < 0.05, vs. control (no treatment); #P < 0.05, vs. CTmab (300 nM), &P < 0.05, n = 15–20 neurons/group. Note that TTX (1 µM) further inhibits INaT compared with SVmab1 (300 nM). (D) TTX (1 µM) but not SVmab1 (300 nM) inhibits INaT in large-sized DRG neurons. n = 10 neurons/group. (E, F) SVmab1 inhibits the action potential frequency in dissociated small-sized DRG neurons. (E) Traces of action potentials. (F) Action potential frequencies following current injection (100 and 200 pA). *P < 0.05, n = 15–20 neurons/group. (G, H) SVmab1 inhibits persistent sodium currents (INaP) in small-sized neurons of whole mount DRGs from naïve mice and mice with nerve injury (CCI). (G) Traces of INaP before treatment (control) and after treatment with CTmab (300 nM) and SVmab1 (300 nM). (H) Amplitudes of INaP in DRG neurons, which are increased after CCI. Note that SVmab1 (300 nM) produces a greater inhibition of INaP after CCI. *P < 0.05, n = 6–7 neurons/group. (I, J) SVmab1 inhibits excitatory synaptic transmission in IIo neurons of spinal cord slices of normal mice. (I) Traces of spontaneous EPSCs (sEPSCs). Low panel, enlargements of traces (1,2, 3) before and during the CTmab and SVmab1 treatment (300 nM). (J) Frequency of sEPSCs. *P < 0.05, vs. baseline; #P < 0.05, vs. CTmab (300 nM); &P < 0.05, n = 5–6 neurons/group. (K, L) SVmab1 inhibits chronic pain-potentiated excitatory nociceptive synaptic transmission in lamina IIo neurons of spinal cord slices 4 days after CCI. (K) Traces of sEPSCs. Low panel, enlargements of traces (1, 2, 3) before and during the CTmab and SVmab1 treatment (300 nM). (L) Frequency of sEPSCs. *P < 0.05, vs. no treatment baseline after CCI; #P < 0.05, vs. CTmab (300 nM), n = 5 neurons/group. Note that SVmab1 is as effectively as TTX in suppressing synaptic transmission in chronic pain. n.s., no significance. All the data are shown as means ± SEM.
Figure 7
Figure 7. SVmab1 suppresses acute and chronic itch and chronic itch-potentiated synaptic transmission in spinal cord slices in mice
(A–C) Intrathecal injection of SVmab1 reduces acute itch induced by compound 48/80 (A, intradermal), CQ (B, intradermal), and GRP (C, intrathecal). *P < 0.05, n = 5–8 mice/group. (D, E) Intrathecal (50 µg, D) or i.v. (10 mg/kg, E) injection of SVmab1 reduces dry skin-induced chronic itch following AEW treatment (5 days). *P < 0.05, n = 6 mice/group. (F–H) Intrathecal or systemic injection of SVmab1 reduces DNFB-induced chronic itch. (F) Paradigm and time course of DNFB-induced chronic itch. (G) Intrathecal (50 µg) injection of SVmab1 on day 10 reduces chronic itch. (H) Systemic injection of SVmab1 (50 mg/kg, i.v.) on day 12 reduces chronic itch. *P < 0.05, n = 6 mice/group. (I, J) SVmab1 inhibits chronic itch-enhanced excitatory synaptic transmission in spinal cord slices 5 days after AEW treatment. (I) Traces of spontaneous EPSCs (sEPSCs) in lamina IIo neurons. Low panel, enlargements of traces (1, 2, 3) before and during the CTmab and SVmab1 treatment (300 nM). (J) Frequency of sEPSCs in lamina IIo neurons. Note sEPSCs are potentiated in chronic itch and this potentiation is inhibited by SVmab1. *P < 0.05, n = 5 neurons/group. All the data are shown as means ± SEM.

Comment in

Similar articles

Cited by

References

    1. Akiyama T, Carstens E. Neural processing of itch. Neuroscience. 2013;250:697–714. - PMC - PubMed
    1. Akiyama T, Tominaga M, Takamori K, Carstens MI, Carstens E. Roles of glutamate, substance P, gastrin-releasing peptide as spinal neurotransmitters of histaminergic and nonhistaminergic itch. Pain. 2013 - PMC - PubMed
    1. Alabi AA, Bahamonde MI, Jung HJ, Kim JI, Swartz KJ. Portability of paddle motif function and pharmacology in voltage sensors. Nature. 2007;450:370–375. - PMC - PubMed
    1. Armstrong CM, Bezanilla F. Charge movement associated with the opening and closing of the activation gates of the Na + channels. J Gen Physiol. 1974;63:533–552. - PMC - PubMed
    1. Beck A, Wurch T, Bailly C, Corvaia N. Strategies and challenges for the next generation of therapeutic antibodies. Nature reviews Immunology. 2010;10:345–352. - PubMed

Publication types

MeSH terms

Substances