Compensatory regulation of the size of the inner ear in response to excess induction of otic progenitors by fibroblast growth factor signaling
- PMID: 24847848
- PMCID: PMC4247227
- DOI: 10.1002/dvdy.24148
Compensatory regulation of the size of the inner ear in response to excess induction of otic progenitors by fibroblast growth factor signaling
Abstract
Background: The otic placode comprises the progenitors of the inner ear and the neurons that convey hearing and balance information to the brain. Transplantation studies in birds and amphibians demonstrate that when the otic placode is morphologically visible as a thickened patch of ectoderm, it is first committed to an otic fate. Fibroblast growth factor (FGF) signaling initiates induction of the otic placode, and levels of FGF signaling are fine-tuned by the Sprouty family of antagonists of receptor tyrosine kinase signaling.
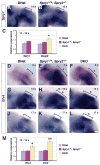
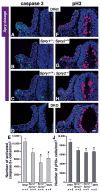
Results: Here, we examined the size of the otic placode and cup by combinatorial inactivation of the Sprouty1 and Sprouty2 genes. Interestingly, in a Sprouty gene dosage series, early enlargement of the otic placode was progressively restored to normal. Restoration of otic size was preceded by normal levels of FGF signaling, reduced cell proliferation and reduced cell death.
Conclusions: Our study demonstrates that excess otic placode cells, which form in response to increased FGF signaling, are not maintained in mammals. This suggests that growth plasticity exists in the mammalian otic placode and cup, and that FGF signaling may not be sufficient to induce the genetic program that maintains otic fate.
Keywords: FGF; Sprouty1; Sprouty2; cell death; cell proliferation; gene dosage; induction; inner ear; otic placode.
Copyright © 2014 Wiley Periodicals, Inc.
Figures


Similar articles
-
Cooperative and independent functions of FGF and Wnt signaling during early inner ear development.BMC Dev Biol. 2015 Oct 6;15:33. doi: 10.1186/s12861-015-0083-8. BMC Dev Biol. 2015. PMID: 26443994 Free PMC article.
-
Sprouty1 and Sprouty2 limit both the size of the otic placode and hindbrain Wnt8a by antagonizing FGF signaling.Dev Biol. 2011 May 1;353(1):94-104. doi: 10.1016/j.ydbio.2011.02.022. Epub 2011 Feb 26. Dev Biol. 2011. PMID: 21362415 Free PMC article.
-
Fgf8 and Fgf3 are required for zebrafish ear placode induction, maintenance and inner ear patterning.Mech Dev. 2002 Nov;119(1):91-108. doi: 10.1016/s0925-4773(02)00343-x. Mech Dev. 2002. PMID: 12385757
-
The first steps towards hearing: mechanisms of otic placode induction.Int J Dev Biol. 2007;51(6-7):463-72. doi: 10.1387/ijdb.072320to. Int J Dev Biol. 2007. PMID: 17891709 Review.
-
Changing shape and shaping change: Inducing the inner ear.Semin Cell Dev Biol. 2017 May;65:39-46. doi: 10.1016/j.semcdb.2016.10.006. Epub 2016 Oct 29. Semin Cell Dev Biol. 2017. PMID: 27989562 Review.
Cited by
-
Cooperative and independent functions of FGF and Wnt signaling during early inner ear development.BMC Dev Biol. 2015 Oct 6;15:33. doi: 10.1186/s12861-015-0083-8. BMC Dev Biol. 2015. PMID: 26443994 Free PMC article.
-
The Fibroblast Growth Factor signaling pathway.Wiley Interdiscip Rev Dev Biol. 2015 May-Jun;4(3):215-66. doi: 10.1002/wdev.176. Epub 2015 Mar 13. Wiley Interdiscip Rev Dev Biol. 2015. PMID: 25772309 Free PMC article. Review.
-
A gene network regulated by FGF signalling during ear development.Sci Rep. 2017 Jul 21;7(1):6162. doi: 10.1038/s41598-017-05472-0. Sci Rep. 2017. PMID: 28733657 Free PMC article.
-
Craniosynostosis, inner ear, and renal anomalies in a child with complete loss of SPRY1 (sprouty homolog 1) function.J Med Genet. 2023 Jul;60(7):712-716. doi: 10.1136/jmg-2022-108946. Epub 2022 Dec 21. J Med Genet. 2023. PMID: 36543535 Free PMC article.
-
MEKK4 Signaling Regulates Sensory Cell Development and Function in the Mouse Inner Ear.J Neurosci. 2016 Jan 27;36(4):1347-61. doi: 10.1523/JNEUROSCI.1853-15.2016. J Neurosci. 2016. PMID: 26818521 Free PMC article.
References
-
- Adamska M, Herbrand H, Adamski M, Kruger M, Braun T, Bober E. FGFs control the patterning of the inner ear but are not able to induce the full ear program. Mech Dev. 2001;109:303–313. - PubMed
-
- Alvarez Y, Alonso MT, Vendrell V, Zelarayan LC, Chamero P, Theil T, Bosl MR, Kato S, Maconochie M, Riethmacher D, Schimmang T. Requirements for FGF3 and FGF10 during inner ear formation. Development. 2003;130:6329–6338. - PubMed
-
- Basson MA, Akbulut S, Watson-Johnson J, Simon R, Carroll TJ, Shakya R, Gross I, Martin GR, Lufkin T, McMahon AP, Wilson PD, Costantini FD, Mason IJ, Licht JD. Sprouty1 Is a Critical Regulator of GDNF/RET-Mediated Kidney Induction. Dev Cell. 2005;8:229–239. - PubMed
-
- Brent AE, Tabin CJ. FGF acts directly on the somitic tendon progenitors through the Ets transcription factors Pea3 and Erm to regulate scleraxis expression. Development. 2004;131:3885–3896. - PubMed
Publication types
MeSH terms
Substances
Grants and funding
LinkOut - more resources
Full Text Sources
Other Literature Sources
Molecular Biology Databases

