. 2014 May 20:5:3889.
doi: 10.1038/ncomms4889.

High-fat maternal diet during pregnancy persistently alters the offspring microbiome in a primate model

Affiliations

High-fat maternal diet during pregnancy persistently alters the offspring microbiome in a primate model

Jun Ma et al. Nat Commun. .

Abstract

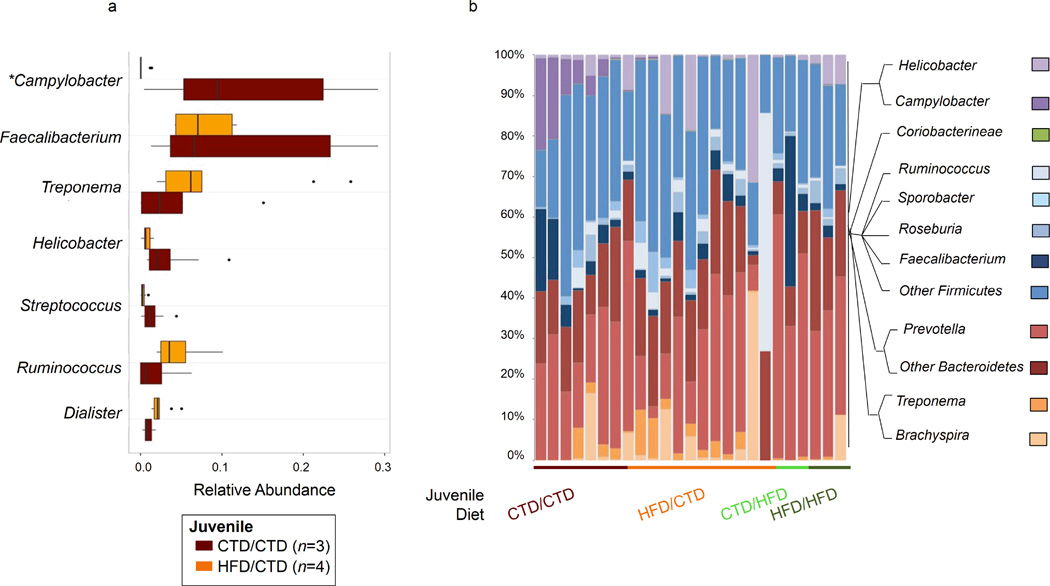
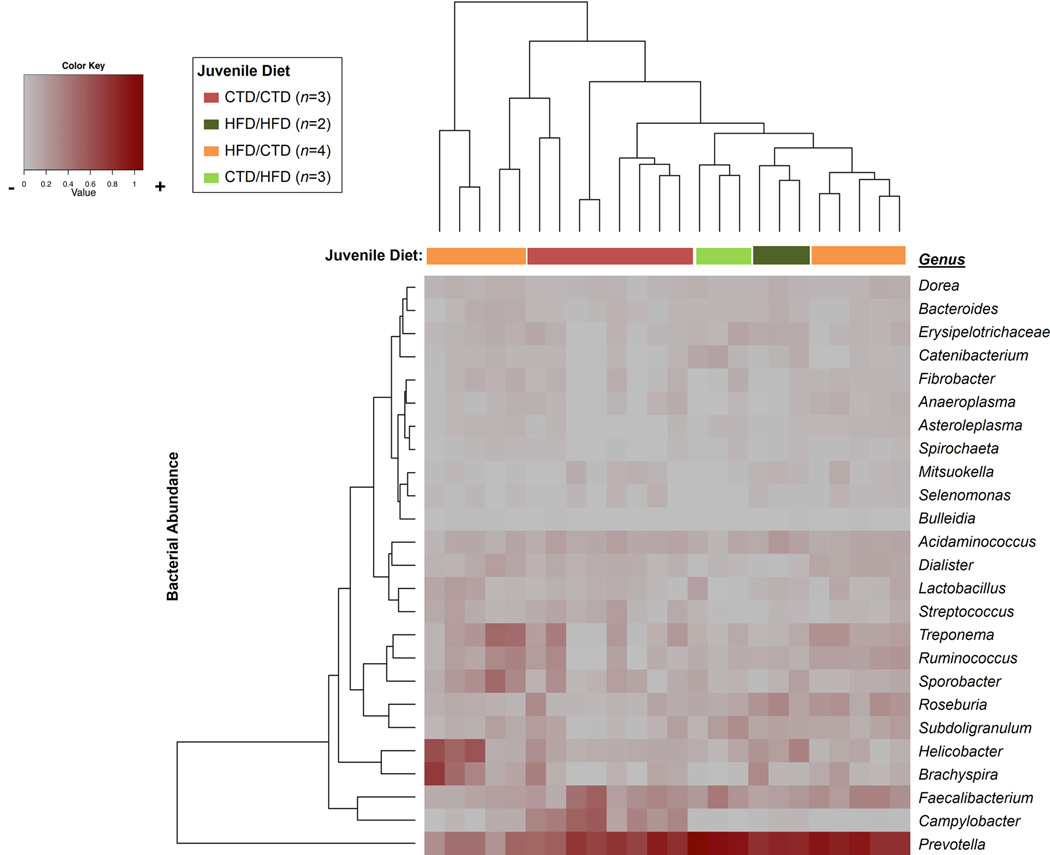
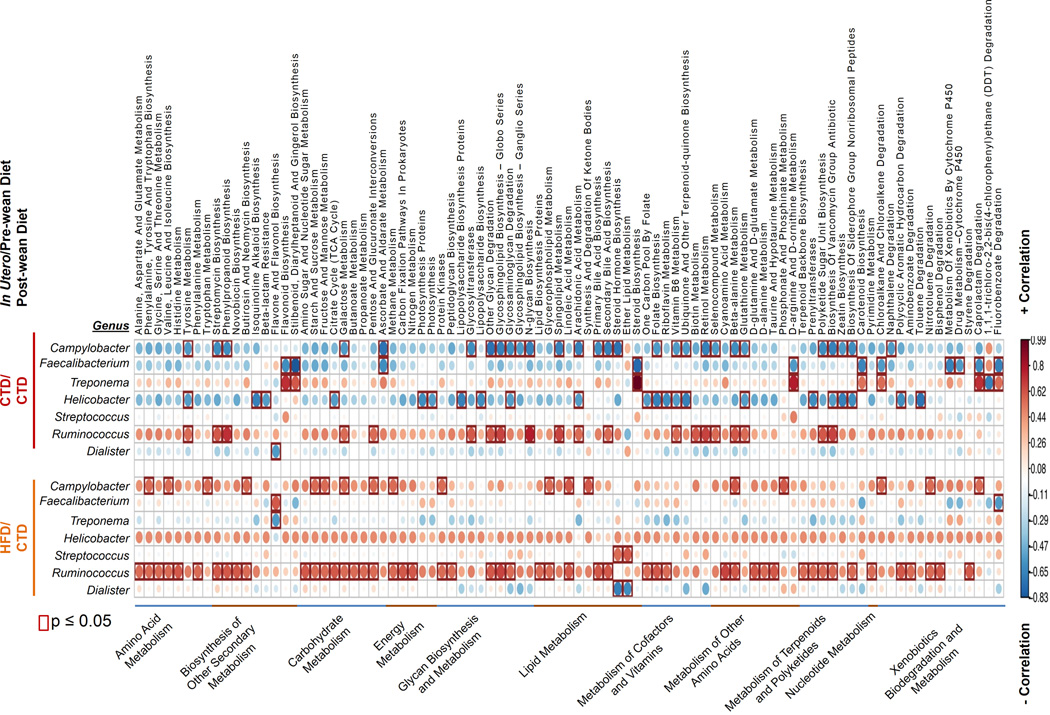
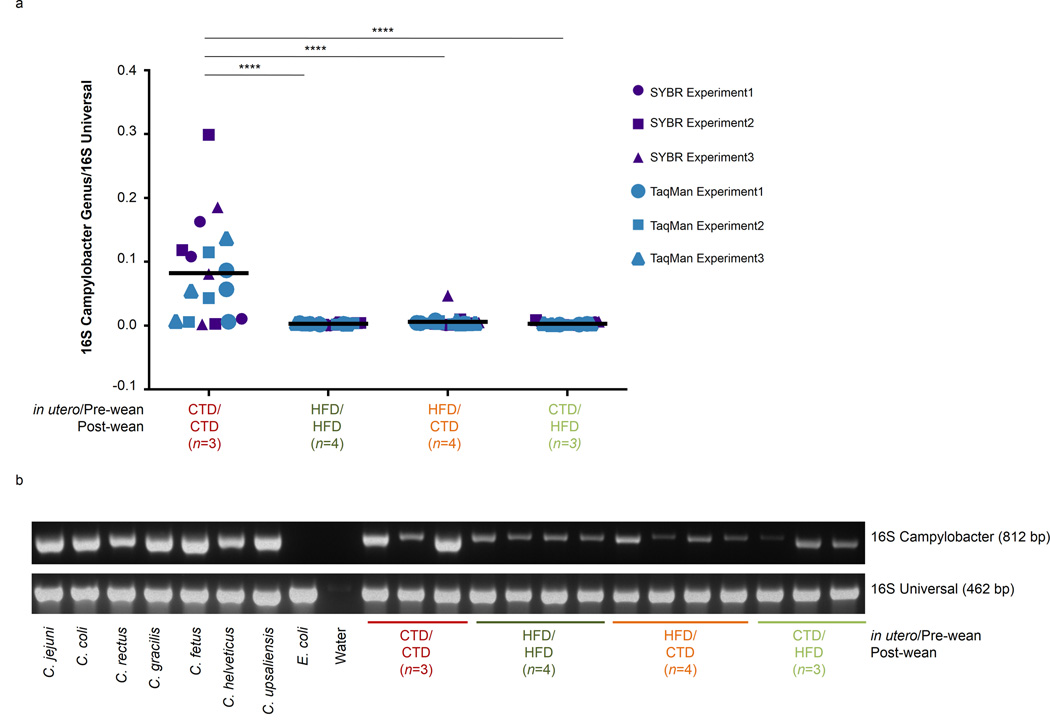
The intestinal microbiome is a unique ecosystem and an essential mediator of metabolism and obesity in mammals. However, studies investigating the impact of the diet on the establishment of the gut microbiome early in life are generally lacking, and most notably so in primate models. Here we report that a high-fat maternal or postnatal diet, but not obesity per se, structures the offspring's intestinal microbiome in Macaca fuscata (Japanese macaque). The resultant microbial dysbiosis is only partially corrected by a low-fat, control diet after weaning. Unexpectedly, early exposure to a high-fat diet diminished the abundance of non-pathogenic Campylobacter in the juvenile gut, suggesting a potential role for dietary fat in shaping commensal microbial communities in primates. Our data challenge the concept of an obesity-causing gut microbiome and rather provide evidence for a contribution of the maternal diet in establishing the microbiota, which in turn affects intestinal maintenance of metabolic health.


Figures

Figure 1
Figure 1. Characterization of theMacaca fuscata microbiome
DNA was isolated from M. fuscata or H. sapiens swabs collected from the intestinal (anus, colorectal, and stool), vaginal, or oral cavity. 16S rDNA sequencing was performed via the 454 FLXtitanium system and sequences were analyzed using QIIME software. (a) PCoA plots showing beta diversity of samples collected from M. fuscata swabs of the intestinal (blue), vaginal (red), or oral cavity (orange). The number of animals (n) used for each body site is indicated in parenthesis in the figure legend. (b) Phylum level abundance of bacteria isolated from the intestinal, vaginal, or oral cavity of M. fuscata (this work) or H. sapiens (leveraged from the HMP, available at http://www.hmpdacc.org/). Each phylum is represented by a different color in the phylogenetic tree. The total number of dams and juveniles from which microbiome characterization was derived was 50 with samples from several body sites.
Figure 2
Figure 2. Diet structures the intestinal microbiome of Macaca fuscata
Intestinal samples were collected from M. fuscata maintained on an isocaloric diet consisting of either 13% fat (control diet) or 36% fat (high fat diet). DNA was isolated from intestinal contents and 16S rDNA pyrosequencing (454 FLXtitanium) was performed. Sequences were analyzed using QIIME software. (a) PCoA plot demonstrating differential clustering of control diet (CTD, green), high fat diet lean(HFDR, dark blue), or high fat diet obese (HFDS, light blue) individuals. Individuals cluster significantly based on diet (p=0.001 by PERMANOVA). The number of animals in each category (n) is indicated in the parenthesis on the legend. (b) Graph demonstrating phylum abundance differences between control diet (CTD), high fat diet lean (HFDR), and high fat diet obese (HFDS) individuals. Legend to the right of the graph indicates the color for each phyla of bacterium represented.
Figure 3
Figure 3. Diet structures the intestinal microbiome of Macaca fuscata at the genus level
Intestinal samples were collected from M. fuscata maintained on an isocaloric diet consisting of either 13% fat (control diet) or 36% fat (high fat diet). DNA was isolated from intestinal contents and 16S rDNA pyrosequencing (454 FLXtitanium) was performed. Sequences were analyzed using QIIME software. (a) Cladogram obtained from LEfSe analysis of 16S sequences. Green shaded areas indicate bacteria with a higher abundance in control diet fed animals (CTD) while blue shaded areas indicate bacteria with a higher abundance in animals fed a high fat diet (HFD). (b) Relative abundance of bacterial genera between animals fed a control diet (CTD, green bars) or a high fat diet (HFD, blue bars). Box plots demonstrate the distribution of data with the line in the middle of the box representing the median. The left of the median is indicative of the third quartile and the right is indicative of the first quartile. Lines to the right of the box are indicative of the 1.5 interquartile range of the lower quartile and lines to the left are indicative of the 1.5 interquartile range of the upper quartile. Dots represent outliers.
Figure 4
Figure 4. Maternal and juvenile dietary manipulations synergistically alter the microbiome
M. fuscata were vaginally delivered to mothers consuming a control (CTD) or high fat diet (HFD). Infants consumed the maternal diet until weaning when they were either maintained on the maternal diet (control cohort) or switched to the opposing diet (crossover cohort). At one year of age, juveniles were sacrificed and DNA was isolated from intestinal samples. DNA was subjected to 16S rDNA pyrosequencing, and sequences were analyzed using QIIME. Mothers consuming a high fat diet are indicated by dark blue (HFD), and control diet mothers are indicated by yellow (CTD). Juveniles are designated based on the maternal/post-wean diets; i.e. CTD/HFD indicates a juvenile that was born to a dam consuming a control diet and switched to a high fat diet post-weaning.. Red represent juveniles on a control diet/control diet (CTD/CTD), dark green indicate juveniles on a high fat diet/high fat diet (HFD/HFD), orange indicate juveniles on a high fat diet/control diet (HFD/CTD), and light green indicate juveniles on a control diet/high fat diet (CTD/HFD). Lines connect maternal-fetal pairs. The number of dams or juveniles in each cohort (n) is indicated in the parenthesis on the legend. (a) PCoA of intestinal samples from maternal-fetal pairs. (b) PCoA of intestinal samples from all juvenile cohorts. Juveniles exposed to a high fat diet post-weaning significantly clustered (p=0.001 by PERMANOVA) when compared to juveniles exposed to a control diet post-weaning. (c) PCoA of intestinal samples from juveniles maintained on a control diet post-weaning. Juveniles exposed to a high fat diet pre-weaning significantly clustered (p=0.016 by PERMANOVA) when compared to juveniles exposed to a control diet post-weaning.
Figure 5
Figure 5. Exposure to a maternal high-fat diet persistently alters the microbiome
M. fuscata were vaginally delivered to mothers consuming a control (CTD) or high fat diet (HFD). Infants consumed the maternal diet until weaning when they were either maintained on the maternal diet (control cohort) or switched to the opposing diet (crossover cohort). At one year of age, juveniles were sacrificed and DNA was isolated from intestinal samples. DNA was subjected to 16S rDNA pyrosequencing, and sequences were analyzed using QIIME. Juveniles are designated based on the maternal/post-wean diets; i.e. CTD/HFD indicates a juvenile that was born to a dam consuming a control diet and switched to a high fat diet post-weaning. Red colour represents juveniles on a control diet/control diet (CTD/CTD), dark green indicates juveniles on a high fat diet/high fat diet (HFD/HFD), orange indicates juveniles on a high fat diet/control diet (HFD/CTD), and light green indicates juveniles on a control diet/high fat diet (CTD/HFD). (a) Relative abundance of bacterial genera in intestinal samples of juveniles maintained on a control diet post-weaning. Juveniles are designated based on the maternal/post-wean diet. Box plots show the distribution of data, with the line in the middle of the box representing the median. The left of the median is indicative of the third quartile and the right is indicative of the first quartile. Lines to the right of the box are indicative of the 1.5 interquartile range of the lower quartile and lines to the left are indicative of the 1.5 interquartile range of the upper quartile. Dots represent outliers.. The asterisk by Campylobacter indicates a statistically significant difference (p<0.05 by t test) between CTD/CTD and HFD/CTD juveniles. (b) Graph representing the most abundant bacterial genera present in intestinal samples of differential juvenile cohorts. Juveniles are grouped based on maternal/post-wean diet as indicated by the line below the chart. Phylogenetic tree designates the genus represented by each color.
Figure 6
Figure 6. A maternal high fat diet alters the offspring gut microbiome persistently
Heat map indicating genus-level changes between M. fuscata consuming either a control or high fat diet. Relative abundance of each genus is indicated by a gradient of color from gray (low abundance) to red (high abundance). Heat map generated using Manhattan distance and hierarchical clustering is based on average linkage. Legend above heat map indicates the maternal and post-wean diet of each juvenile represented. Based on the dendrogram, a cluster of samples from juveniles consuming a control/control diet is observed due to higher Campylobacter abundance. The number of juveniles (n) in each cohort is indicated in parenthesis in the figure legend.
Figure 7
Figure 7. A maternal high fat diet functionally alters the offspring microbiome
Bacterial metabolic pathways of juveniles differ based on maternal gestational diet. Correlations between a PICRUSt-generated functional profile and a QIIME-generated genus level bacterial abundance were calculated and plotted subject to the gestation/lactation diet between juveniles exposed to a maternal control or high fat diet. Only genera identified by Boruta feature selection and LEfSe as significantly different between juveniles exposed to a control versus high-fat gestational/lactational diet are shown in the figure. Metabolic pathway designations are indicated at the bottom of the graph. The upper part of the graph represents juveniles exposed to a control diet gestation/lactation (CTD/CTD, red bar) while the lower part represents juveniles exposed to a high fat diet during gestation/lactation (HFD/CTD, orange bar). The shading intensity of the bubble, along with size, is indicative of the Kendall rank correlation coefficient between matrices. Blue designates a positive correlation while orange/red designates a negative correlation. Red squares surrounding a bubble are indicative of a significant p value ≤ 0.05 by Kendall’s test. n=3 juveniles exposed to control/control diet, and n=4 for juveniles exposed to high fat diet/control diet.
Figure 8
Figure 8. Exposure to a high fat diet diminishes the presence of Campylobacter
M. fuscata were vaginally birthed to mothers consuming a control or high fat diet. Infants consumed the maternal diet until weaning when they were either maintained on the maternal diet (control cohort) or switched to the opposing diet (crossover cohort). At one year of age, animals were sacrificed and DNA was isolated from the stool. DNA was subjected to PCR amplification for both universal 16S rRNA and for Campylobacter 16S rRNA genes. The number of juveniles (n) in each cohort is indicated in parenthesis in the figure legend. (a) Quantitative real-time PCR (qPCR) analysis of stool isolated from juvenile cohorts designated by maternal/post-wean diet. DNA was amplified for universal and Campylobacter 16S rRNA genes using both TaqMan and SYBR qPCR assays. The presence of Campylobacter 16S rRNA was normalized to total universal 16S rRNA presence to provide relative abundance. Each qPCR assay (TaqMan or SYBR) was repeated in three individual assays. Results were pooled and statistical analysis was performed using a one-way ANOVA (**p<0.05). Line represents the mean. (b) PCR amplification of Campylobacter 16S rDNA (top, 812 bp) or universal 16S rDNA (bottom, 462 bp). PCR products were run on a 3% agarose gel containing ethidium bromide. Full gel can be seen in Supplementary Figure 3.

Similar articles

Cited by

References

    1. Turnbaugh PJ, et al. An obesity-associated gut microbiome with increased capacity for energy harvest. Nature. 2006;444:1027–1031. - PubMed
    1. Human Microbiome Project Consortium. Structure, function and diversity of the healthy human microbiome. Nature. 2012;486:207–214. - PMC - PubMed
    1. Koenig JE, et al. Succession of microbial consortia in the developing infant gut microbiome. Proceedings of the National Academy of Sciences. 2011;108(Suppl 1):4578–4585. - PMC - PubMed
    1. Dominguez-Bello MG, et al. Delivery mode shapes the acquisition and structure of the initial microbiota across multiple body habitats in newborns. Proceedings of the National Academy of Sciences. 2010;107:11971–11975. - PMC - PubMed
    1. De Filippo C, et al. Impact of diet in shaping gut microbiota revealed by a comparative study in children from Europe and rural Africa. Proc Natl Acad Sci U S A. 2010;107:14691–14696. - PMC - PubMed

Publication types