. 2014 May 9:3:e01257.
doi: 10.7554/eLife.01257.

Distinct stages of the translation elongation cycle revealed by sequencing ribosome-protected mRNA fragments

Affiliations

Distinct stages of the translation elongation cycle revealed by sequencing ribosome-protected mRNA fragments

Liana F Lareau et al. Elife. .

Abstract

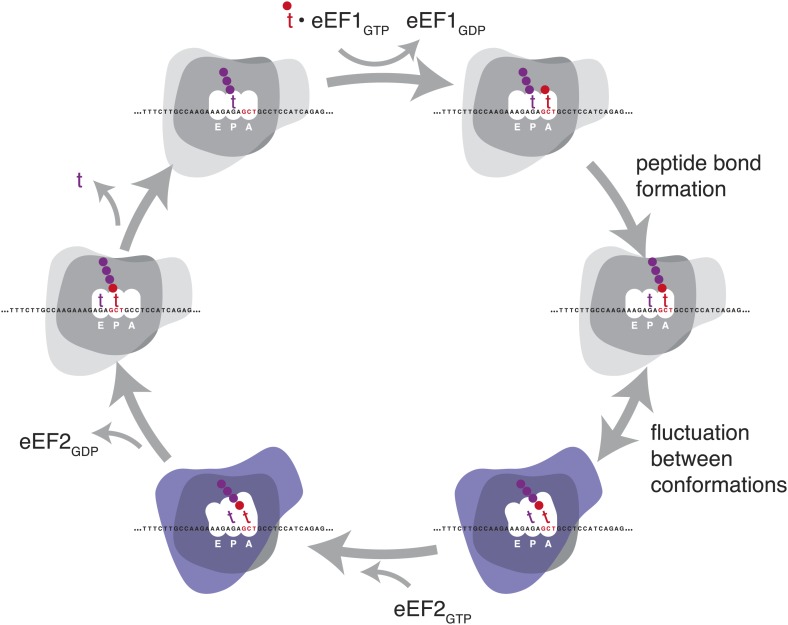
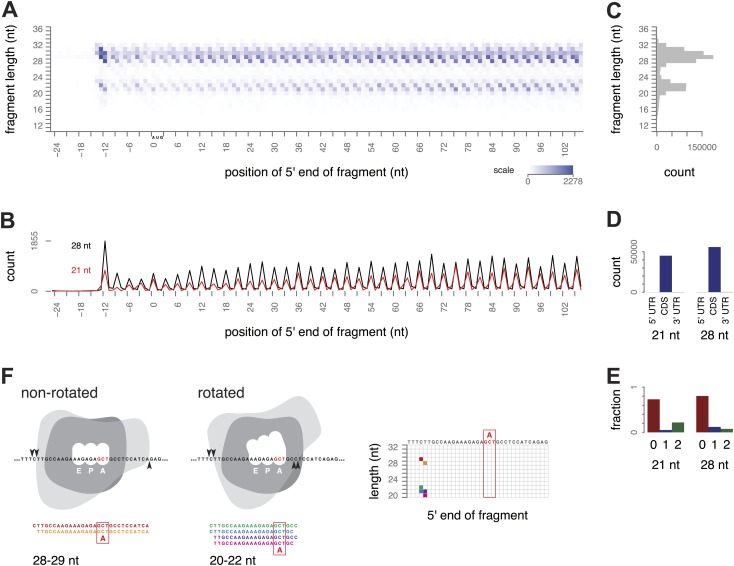
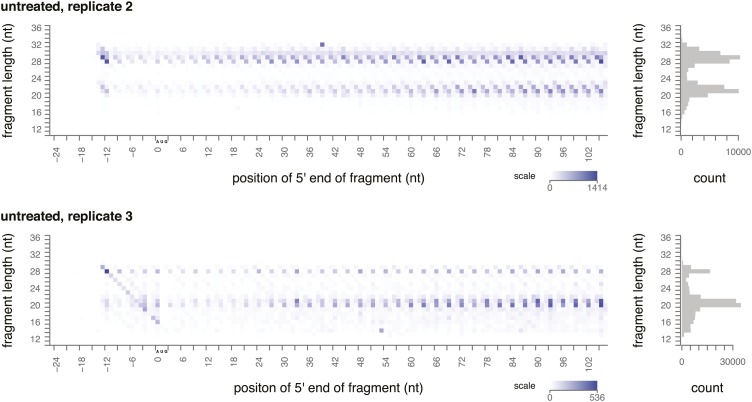
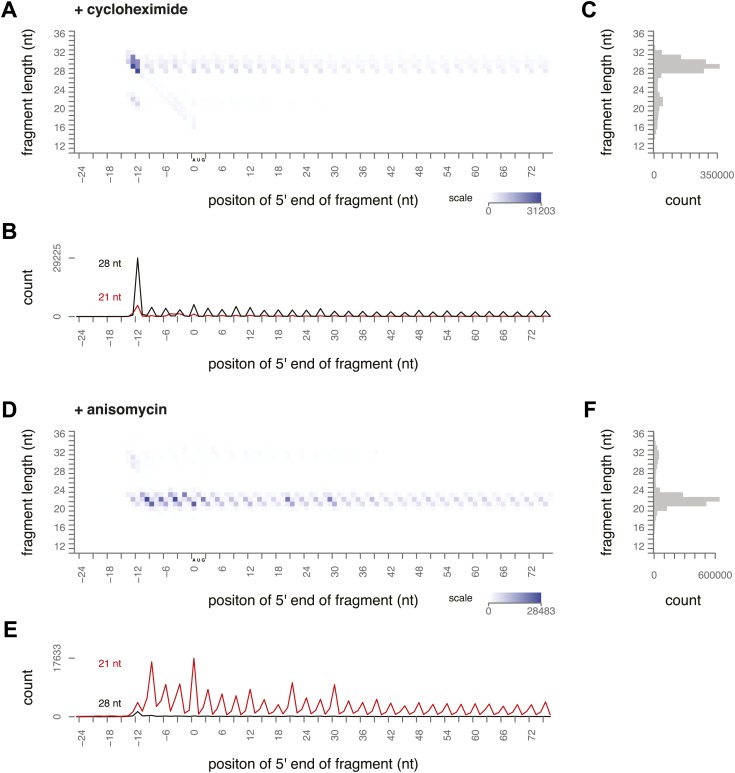
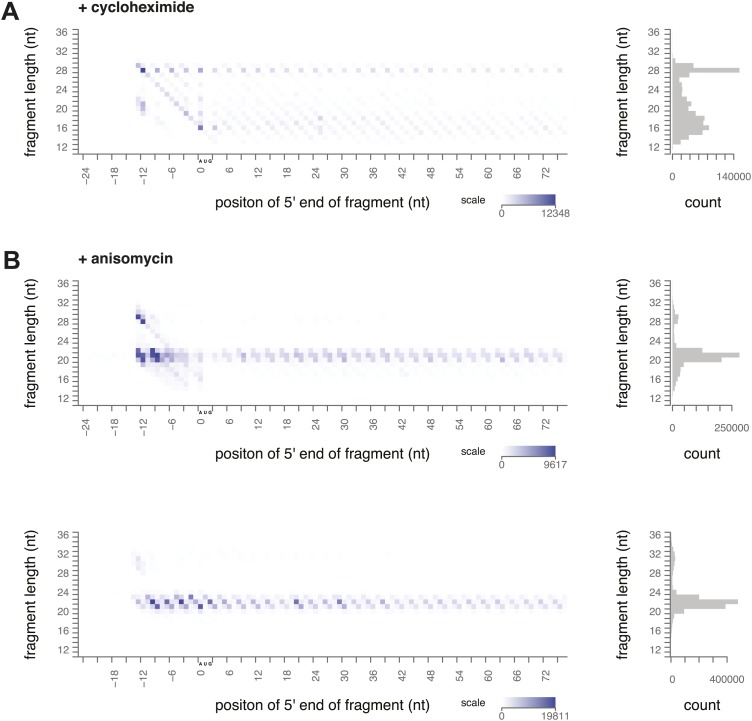
During translation elongation, the ribosome ratchets along its mRNA template, incorporating each new amino acid and translocating from one codon to the next. The elongation cycle requires dramatic structural rearrangements of the ribosome. We show here that deep sequencing of ribosome-protected mRNA fragments reveals not only the position of each ribosome but also, unexpectedly, its particular stage of the elongation cycle. Sequencing reveals two distinct populations of ribosome footprints, 28-30 nucleotides and 20-22 nucleotides long, representing translating ribosomes in distinct states, differentially stabilized by specific elongation inhibitors. We find that the balance of small and large footprints varies by codon and is correlated with translation speed. The ability to visualize conformational changes in the ribosome during elongation, at single-codon resolution, provides a new way to study the detailed kinetics of translation and a new probe with which to identify the factors that affect each step in the elongation cycle.DOI: http://dx.doi.org/10.7554/eLife.01257.001.

Keywords: ribosome; ribosome profiling; translation.


Conflict of interest statement

The authors declare that no competing interests exist.

Figures

Figure 1.
Figure 1.. Schematic representation of the eukaryotic elongation cycle.
Blue overlay denotes stages at which the ribosome has undergone a large inter-subunit rotation. Ribosome shapes are for illustration only, not a literal representation of the structure or degree of rotation. DOI: http://dx.doi.org/10.7554/eLife.01257.003
Figure 2.
Figure 2.. Ribosome-protected fragment positions and size distributions from yeast not treated with elongation inhibitors.
(A) The position of each fragment was calculated relative to the start codon of its gene. The 5′ end positions (x axis) and lengths of all fragments (y axis) were tallied across all genes with a coding region of at least 300 nt. Higher color intensity reflects more fragments. RNA fragments between 18 and 32 nucleotides were selected after gel electrophoresis; shorter and longer fragments are not entirely excluded but their read counts are presumed to be unrepresentative of their true abundance. (B) Profiles of the 5′ end positions of all 20 nt and 28 nt fragments relative to the start codon of their genes, as in (A). (C) Total counts of mapped fragment lengths. (D) Distribution of 21 nt and 28 nt fragments in coding regions and untranslated regions of mRNAs. (E) Positions of 21 nt and 28 nt fragments relative to the reading frame. (F) Interpretation of fragment positions on an arbitrary gene fragment. Arrowheads show hypothetical nuclease cleavage sites relative to a ribosome in a non-rotated or rotated conformation (shape is for illustration only). The resulting fragments are shown with the inferred decoding site (A site), and their positions in a grid as in Figure 2A are shown with corresponding colors. DOI: http://dx.doi.org/10.7554/eLife.01257.004
Figure 2—figure supplement 1.
Figure 2—figure supplement 1.. Ribosome-protected fragment positions and size distributions from yeast not treated with elongation inhibitors.
Two biological replicates of ribosome-protected fragment distribution, as in Figure 2A,C. DOI: http://dx.doi.org/10.7554/eLife.01257.005
Figure 3.
Figure 3.. Ribosome-protected fragment positions and size distributions from yeast treated with elongation inhibitors.
(A and B) As in Figure 2A,B, fragment position and size distribution for yeast treated with cycloheximide. (C) Distribution of mapped fragment lengths for yeast treated with cycloheximide. (D and E) Fragment position and size distribution for yeast treated with anisomycin. (F) Distribution of mapped fragment lengths for yeast treated with anisomycin. DOI: http://dx.doi.org/10.7554/eLife.01257.006
Figure 3—figure supplement 1.
Figure 3—figure supplement 1.. Ribosome-protected fragment positions and size distributions from yeast treated with elongation inhibitors.
(A) Biological replicate of ribosome-protected fragment distribution after cycloheximide treatment. (B) Biological replicate (top) and technical replicate (bottom; independent fractionation and library preparation from the same lysate as Figure 3) of fragment distribution after anisomycin treatment. DOI: http://dx.doi.org/10.7554/eLife.01257.007
Figure 4.
Figure 4.. Effect of 3-amino 1,4 triazole on translation of histidine codons.
(A) Schematic representation of the hypothesized effect of 3-AT. 3-AT reduces intracellular concentrations of histidyl-tRNA and thus is expected to increase time spent decoding histidine codons (i.e., in the decoding phase of the cycle, with a His codon in the A-site). (B) All 61 sense codons are plotted by the log2 of the relative abundance of large footprints with the specified codon in the A-site for untreated cells (x axis) against the log2 relative abundance of large footprints for yeast treated with 3-AT (y axis). Values shown are the average of three untreated replicates and two 3-AT treatments (10 min and 60 min). Histidine codons are denoted in red (CAT) and cyan (CAC). (C) As in (B), showing the relative abundance of small footprints. DOI: http://dx.doi.org/10.7554/eLife.01257.008
Figure 4—figure supplement 1.
Figure 4—figure supplement 1.. Effect of 3-amino 1,4 triazole on translation of histidine codons.
As in Figure 4, log2 relative occupancy, log2 large footprint abundance, and log2 small footprint abundance in comparisons of three untreated replicates and two 3-AT treated samples. Histidine codons are denoted in red (CAT) and cyan (CAC). DOI: http://dx.doi.org/10.7554/eLife.01257.009
Figure 5.
Figure 5.. Codon-specific variation in large and small footprint abundance.
(A) Distribution of ribosome footprint counts on the highly expressed gene FBA1, highlighting an arbitrary window, codons 250–279. Ribosome footprint counts per position were consistent between replicates and varied between instances of the same codon in this window. Relative occupancy was estimated based on the codon in the inferred A site. Total (large + small) footprint coverage at each codon of a gene was computed relative to the average coverage for that gene, then averaged by codon across all genes to provide per-codon relative occupancies. Relative abundance of small or large footprints was computed similarly, comparing the count of small or large footprints at each codon of a gene against the average coverage (large + small) for that gene, then averaged by codon across all genes. Examples of small and large footprint abundance values at two specific TTC codons in FBA1 are shown. (B) Relative occupancies of all 61 codons compared between two replicates, with Spearman correlation of 0.81. Stop codons and the first 50 codons of each gene were excluded from analysis. Similarly, small footprint abundance (C) and large footprint abundance (D) compared between replicates. DOI: http://dx.doi.org/10.7554/eLife.01257.010
Figure 5—figure supplement 1.
Figure 5—figure supplement 1.. Codon-specific variation in large and small footprint abundance.
(A) Relative occupancies based on the codon downstream of the inferred A site, compared to the A-site occupancies as in Figure 5. Similarly, small footprint abundance (B) and large footprint abundance (C) for the inferred A site and downstream codon. DOI: http://dx.doi.org/10.7554/eLife.01257.011
Figure 6.
Figure 6.. Correlates of footprint abundance.
(A) Small footprint abundance, averaged for all codons encoding the same amino acid plotted against Kd of transfer of side chain from vapor to water as a measure of polarity (Wolfenden, 2007), with Spearman correlation from the average of three samples. (B) Relative occupancy of directly paired codons vs relative occupancy of codons that recognize the same tRNA with wobble pairing. Values are the average of three replicates. Dashed line shows y = x, the expected relationship if occupancy were determined solely by tRNA identity. (C and D) As in (B), showing small and large footprint abundance. DOI: http://dx.doi.org/10.7554/eLife.01257.012

Similar articles

Cited by

References

    1. Agirrezabala X, Lei J, Brunelle JL, Ortiz-Meoz RF, Green R, Frank J. 2008. Visualization of the hybrid state of tRNA binding promoted by spontaneous ratcheting of the ribosome. Molecular Cell 32:190–197. doi: 10.1016/j.molcel.2008.10.001 - DOI - PMC - PubMed
    1. Barbacid M, Vazquez D. 1974. (3H)anisomycin binding to eukaryotic ribosomes. Journal of Molecular Biology 84:603–623. doi: 10.1016/0022-2836(74)90119-3 - DOI - PubMed
    1. Barbacid M, Vazquez D. 1975. Ribosome changes during translation. Journal of Molecular Biology 93:449–463. doi: 10.1016/0022-2836(75)90239-9 - DOI - PubMed
    1. Ben-Shem A, Garreau de Loubresse N, Melnikov S, Jenner L, Yusupova G, Yusupov M. 2011. The structure of the eukaryotic ribosome at 3.0 A resolution. Science 334:1524–1529. doi: 10.1126/science.1212642 - DOI - PubMed
    1. Ben-Shem A, Jenner L, Yusupova G, Yusupov M. 2010. Crystal structure of the eukaryotic ribosome. Science 330:1203–1209. doi: 10.1126/science.1194294 - DOI - PubMed

Publication types

MeSH terms

Grants and funding

The funders had no role in study design, data collection and interpretation, or the decision to submit the work for publication.