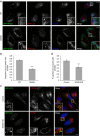
. 2014 May 13:5:3828.
doi: 10.1038/ncomms4828.

Mutation in VPS35 associated with Parkinson's disease impairs WASH complex association and inhibits autophagy

Affiliations
Free PMC article

Mutation in VPS35 associated with Parkinson's disease impairs WASH complex association and inhibits autophagy

Eszter Zavodszky et al. Nat Commun. .
Free PMC article

Abstract

Endosomal protein sorting controls the localization of many physiologically important proteins and is linked to several neurodegenerative diseases. VPS35 is a component of the retromer complex, which mediates endosome-to-Golgi retrieval of membrane proteins such as the cation-independent mannose 6-phosphate receptor. Furthermore, retromer is also required for the endosomal recruitment of the actin nucleation promoting WASH complex. The VPS35 D620N mutation causes a rare form of autosomal-dominant Parkinson's disease (PD). Here we show that this mutant associates poorly with the WASH complex and impairs WASH recruitment to endosomes. Autophagy is impaired in cells expressing PD-mutant VPS35 or lacking WASH. The autophagy defects can be explained, at least in part, by abnormal trafficking of the autophagy protein ATG9A. Thus, the PD-causing D620N mutation in VPS35 restricts WASH complex recruitment to endosomes, and reveals a novel role for the WASH complex in autophagosome formation.


Figures
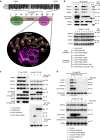
Figure 1
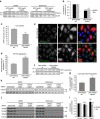
Figure 1. Effect of the D620N mutation on the assembly and protein–protein interactions of the retromer CSC.
(a) Schematic diagram showing an alignment of the human VPS35 sequence (residues 610–680) with homologues from other well-studied eukaryotes. The D620N mutation is highlighted along with the H675R mutation that blocks binding to VPS29. The position of the D620N mutation of VPS35 is shown on the three-dimensional structure along with the H675R mutation and the V90 and I91 residues of VPS29 that mediate binding to VPS35 (PDB ID. 2R17). (b) Cells stably expressing WT or D620N GFP-VPS35 or otherwise transiently transfected with a panel of GFP-VPS35 constructs were lysed and the respective GFP-tagged protein recovered by immunoprecipitation (IP). (c) Untransfected HeLa cells or cells stably expressing VPS29-GFP, GFP-VPS35 wild-type or GFP-VPS35 D620N were lysed and the lysates incubated with anti-VPS26 to IP the retromer CSC. (d) Cells stably expressing the VPS29-GFP V90D mutant that cannot assemble with VPS35 were transiently transfected with mCherry-tagged WT VPS35, D620N and H675R constructs, along with an additional control of mCherry-FAM21 tail. Cells were lysed 48 h post transfection, and VPS29-GFP V90D and associated proteins were recovered by anti-GFP native IP. Blots shown are representative of experiments replicated at least twice.
Figure 2
Figure 2. The D620N mutation destabilizes the retromer–WASH complex association.
(a) Cells expressing either WT GFP-VPS35 or the D620N mutant were treated with siRNA to abolish expression of endogenous VPS35. Each dish of cells was lysed in either HEPES lysis buffer (H) or PBS lysis buffer (P). Following centrifugation, equal portions of each lysate were combined to generate a mixed lysate (H/P). Each lysate was incubated with anti-GFP to recover the respective GFP-tagged VPS35 protein. (b) Similar to (a), but only cells expressing GFP-VPS35 wild type were analysed, either mock treated or treated with siRNA to silence FKBP15 expression. (c) Cells stably expressing WT or D620N GFP-VPS35 were treated with indicated siRNAs, lysed and immunoprecipitated as in (a).
Figure 3
Figure 3. The D620N mutation leads to reduced endosomal association of FKBP15 and the WASH complex.
(a,b) Cells expressing either WT or D620N GFP-VPS35 were treated with siRNA to silence expression of endogenous VPS35, fixed and labelled for GFP and FKBP15 (a) or FAM21 (b). Cells were imaged by fluorescence microscopy. Scale bar, 20 μm. (c) Cells stably expressing WT or D620N GFP-tagged VPS35 were treated with siRNA to abolish expression of endogenous VPS35 and subsequently fixed and labelled for GFP and either VPS26, FKBP15 or FAM21. The cells were imaged using Cellomics automated fluorescence microscopy. Approximately 250 cells per well in four wells were analysed for each cell line. The data for FKBP15 and FAM21 spot intensity were normalized to GFP-VPS35 and VPS26 signals. P<0.0002 for both FKBP15 and FAM21 spot intensity in D620N compared with WT. Error bars indicate s.d. (d) Cells stably expressing either WT GFP-VPS35 or the D620N mutant were treated with siRNA to silence the expression of endogenous VPS35. Cells were permeabilized by flash freezing followed by rapid thawing and centrifuged to separate supernatant (S) and membrane pellet (P) fractions. (e) The graph shows the percentage of membrane-associated FKBP15 and strumpellin and is the mean of three experiments. The error bars indicate s.e.m. A representative blot of three experiments is shown, indicating the efficacy of the knockdown of endogenous VPS35 and also further showing that membrane proteins such as the CIMPR are detected only in the pellet fraction.
Figure 4
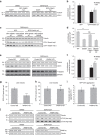
Figure 4. VPS35 D620N impairs autophagy, while VPS35 knockdown has only modest effects.
(a) HeLa cells stably expressing GFP-VPS35 WT and D620N were treated with bafilomycin A1 or DMSO vehicle control. Endogenous LC3-II and tubulin levels were examined by western blot. A representative experiment of six experiments is shown. (b) Quantification of the representative experiment in triplicate shown in a, in which endogenous LC3-II levels are normalized to tubulin and expressed as a ratio of levels in WT. ***P=7.86 × 10⁻⁶ (DMSO) and 3.81 × 10⁻⁵ (Baf) by 2-tailed Student’s t-test. (c) HeLa cells stably expressing GFP-VPS35 WT and D620N were transfected with mRFP-LC3. The number of LC3 vesicles was quantified by Cellomics automated fluorescence microscopy. A representative experiment of three independent experiments is shown, with 344 (WT) and 401 (D620N) cells analysed. ***P<0.0001 by 2-tailed Student’s t-test. (d) GFP-VPS35 WT and D620N-expressing cells were transfected with HA-Q74 and immunostained for HA. The percentage of transfected cells with aggregates was counted by a blinded experimenter. The quantification shows the mean of three experiments in triplicate with minimum 200 cells per replicate. ***P=0.00086 by 1-tailed Student’s t-test. (e) Confocal images representative of the experiment described in d. Scale bar, 20 μm. (f) Cells stably expressing WT and D620N GFP-VPS35 were transfected with GFP-α-synuclein A53T and GFP for 48 h and analyzed by western blotting. (g) Quantification of the representative experiment in triplicate in f, in which the level of α-synuclein was expressed as a ratio to GFP. A representative experiment of two independent experiments is shown. **P=0.0047 by 2-tailed Student’s t-test. (h) VPS35 was knocked down with two individual siRNA nucleotides in HeLa cells, and cells were treated with bafilomycin A1 and lysed as in a. A representative experiment is shown in triplicate. (i) Quantification of three independent experiments in triplicate. *P=0.026; other results non-significant by 2-tailed Student’s t-test. (j) Protein levels of CSC, including VPS35, VPS26 and VPS29), were assessed upon VPS35 knockdown, confirming previous results that knockdown of one component destabilizes the CSC. All error bars indicate s.e.m.
Figure 5
Figure 5. WASH complex binding to retromer is necessary for autophagy.
(a) HeLa cells were transfected with pEGFP vector or GFP-FAM21 tail for 48 h and subsequently treated with bafilomycin A1 as in Fig. 4. Endogenous LC3-II and tubulin levels were assessed by western blot. (b) Quantification of the representative experiment in triplicate shown in a, of two independent experiments. *P=0.02 (DMSO) and 0.08 (Baf) by 2-tailed Student’s t-test. (c) HeLa cells stably expressing GFP-VPS35 WT and D620N were transfected with pEGFP vector or GFP-FAM21, and subsequently treated with bafilomycin A1, lysed and subjected to western blot as in a. (d) Quantification of the representative experiment in triplicate shown in c, of two independent experiments. **P=0.008 by 2-tailed Student’s t-test. (e) Cells were depleted of WASH1, treated with bafilomycin A1 and examined for endogenous LC3-II, tubulin, WASH1 and GAPDH levels. A representative experiment of six independent experiments is shown. (f) Quantification of the representative experiment shown in e. **P=0.002 (DMSO) and P=0.0028 (Baf) by 2-tailed Student’s t-test. (g) HeLa cells depleted of WASH1 by siRNA were transfected with GFP-LC3 for 24 h. The number of LC3 vesicles was quantified by Cellomics automated fluorescence microscopy. A representative experiment of two independent experiments is shown, with 757 (control) and 695 (knockdown) cells analysed. ***P<0.0001 by 2-tailed Student’s t-test. (h) HeLa cells depleted of FKBP15 were transfected with GFP-LC3 and vesicles were quantified as in g. A representative experiment of two independent experiments in triplicate is shown, with 579 (control) and 815 (knockdown) cells analysed in total. (i) HeLa cells depleted of FKBP15 were subsequently transfected with a GFP-Q74 construct for 24 h and fixed in PFA. The percentage of transfected cells with aggregates was counted by a blinded experimenter. The quantification shows the mean of two experiments, each in triplicate with min 220 cells counted per replicate. (j) FKBP15 was depleted in HeLa cells as in e. A representative blot from three independent experiments in triplicate is shown. Error bars indicate s.e.m.
Figure 6
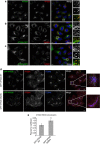
Figure 6. VPS35 D620N affects trafficking and localization of ATG9A.
(a) HeLa cells were immunostained for endogenous ATG9A and VPS35 and subjected to confocal microscopy. Magnified areas are shown on the right of the pictures. (b) HeLa cells were transfected with ATG9A-GFP for 24 h, and subsequently fixed, immunostained for endogenous WASH1 and subjected to confocal microscopy. (c) HeLa cells were transfected with ATG9A-GFP as in b, but immunostained instead for endogenous FAM21. (d) HeLa cells stably expressing GFP-VPS35 WT and D620N were depleted of endogenous VPS35 using 40 nM of siRNA, and subsequently immunostained for TGN46 and endogenous ATG9A and subjected to confocal microscopy. (e) Colocalization between TGN and ATG9A is expressed in terms of the Pearson’s Coefficient. n=25 cells (WT) and 33 cells (D620N). Error bars represent s.e.m. and **P=0.01 by 2-tailed Student’s t-test. Scale bars in (ad), 10 μm.
Figure 7
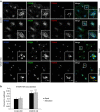
Figure 7. WASH1 depletion affects trafficking and localization of ATG9A.
(a) HeLa cells depleted of WASH1 with two successive siRNA treatments were either starved in Hank’s balanced salt solution for 1 h or kept in full medium. Following fixation, cells were immunostained for TGN46, ATG9A and VPS35 and subjected to confocal microscopy. Representative pictures with magnified areas are shown. Scale bar, 10 μm. (b) Colocalization between TGN and ATG9A is expressed in terms of the Pearson’s coefficient. Number of cells analysed: 38 (control basal), 46 (knockdown basal), 36 (control starved), 53 (knockdown starved). Error bars represent s.e.m. and ***P=0.0005 (basal) and P=0.0004 (starved) by 2-tailed Student’s t-test.
Figure 8
Figure 8. VPS35 D620N and WASH1 depletion impair ATG9A trafficking to autophagosomes.
(a) HeLa cells stably expressing GFP-VPS35 WT and D620N were transfected with mRFP-LC3 for 24 h, immunostained for endogenous ATG9A, and imaged by confocal microscopy. (b) Colocalization is expressed in terms of Mander’s coefficient M1 to indicate the proportion of LC3 intensities that also contain ATG9A intensities. A representative experiment of three independent experiments is shown, in which at least 33 cells were analysed per condition. Error bars indicate s.e.m., and ***P<0.001 by 2-tailed Student’s t-test. (c) HeLa cells depleted of WASH1 were transfected with GFP-LC3 for 24 h, immunostained for endogenous ATG9A, and imaged by confocal microscopy. (d) Colocalization expressed as M1, as in b. A representative experiment of two independent experiments is shown, in which at least 24 cells were analysed per condition. Error bars indicate s.e.m., and ***P<0.001 by 2-tailed Student’s t-test. Scale bars in (a,c), 10 μm. In b,d, colocalization was measured for the entire area of the cell slice in each image. In order to ensure that results were not confounded by diffuse nuclear staining often observed in the LC3 channel, the analyses were repeated with the nuclei excluded, and all of the results remained statistically significant.
Figure 9
Figure 9. WASH1 depletion decreases neuronal cell survival.
(a) SH-SY5Y cells were depleted of WASH1, treated with bafilomycin A1 and examined for LC3-II, tubulin, WASH1 and GAPDH levels. Blots shown are representative of two independent experiments in triplicate. (b) Quantification of the representative experiment in triplicate shown in (a), of two independent experiments. Error bars indicate s.e.m. **P=0.0058 by 1-tailed Student’s t-test. (c) WASH1-depleted SH-SY5Y cells were trypsinized, stained with propidium iodide and analysed by flow cytometry. Living cells, not stained with propidium iodide, are shown as a percentage of total cells. The graph depicts a representative experiment in triplicate out of two independent experiments, in which at least 10,000 cells were analysed in each replicate. Error bars indicate s.e.m. *P=0.045 by 1-tailed Student’s t-test.

Comment in

Similar articles

Cited by

References

    1. Seaman M. N. J. The retromer complex—endosomal protein recycling and beyond. J. Cell Sci. 125, 4693–4702 (2012). - PMC - PubMed
    1. Arighi C. N., Hartnell L. M., Aguilar R. C., Haft C. R. & Bonifacino J. S. Role of the mammalian retromer in sorting of the cation-independent mannose 6-phosphate receptor. J. Cell Biol. 165, 123–133 (2004). - PMC - PubMed
    1. Seaman M. N. J. Cargo-selective endosomal sorting for retrieval to the Golgi requires retromer. J. Cell Biol. 165, 111–122 (2004). - PMC - PubMed
    1. Harbour M. E. et al. The cargo-selective retromer complex is a recruiting hub for protein complexes that regulate endosomal tubule dynamics. J. Cell Sci. 123, 3703–3717 (2010). - PMC - PubMed
    1. Derivery E. et al. The Arp2/3 Activator WASH controls the fission of endosomes through a large multiprotein complex. Dev. Cell 17, 712–723 (2009). - PubMed

Publication types

MeSH terms

Supplementary concepts