. 2014 May 9;344(6184):1250494.
doi: 10.1126/science.1250494.

Structural basis for protein antiaggregation activity of the trigger factor chaperone

Affiliations

Structural basis for protein antiaggregation activity of the trigger factor chaperone

Tomohide Saio et al. Science. .

Abstract

Molecular chaperones prevent aggregation and misfolding of proteins, but scarcity of structural data has impeded an understanding of the recognition and antiaggregation mechanisms. We report the solution structure, dynamics, and energetics of three trigger factor (TF) chaperone molecules in complex with alkaline phosphatase (PhoA) captured in the unfolded state. Our data show that TF uses multiple sites to bind to several regions of the PhoA substrate protein primarily through hydrophobic contacts. Nuclear magnetic resonance (NMR) relaxation experiments show that TF interacts with PhoA in a highly dynamic fashion, but as the number and length of the PhoA regions engaged by TF increase, a more stable complex gradually emerges. Multivalent binding keeps the substrate protein in an extended, unfolded conformation. The results show how molecular chaperones recognize unfolded polypeptides and, by acting as unfoldases and holdases, prevent the aggregation and premature (mis)folding of unfolded proteins.


Figures

Fig. 1
Fig. 1. Substrate-binding sites in TF
(A) The TF residues identified by NMR to interact with unfolded protein substrates are colored blue on the crystal structure of free E. coli TF (PDB ID 1W26). The four main binding sites are labeled A, B, C, and D (in red). The dashed lines indicate the domain boundaries. The two structural protrusions in SBD are labeled arm 1 and arm 2. An additional binding site, located in arm 1, is used by TF to interact with some of the substrates (see Fig. 7A and fig. S11). (B) Expanded view of the four substrate-binding sites in TF identified by the NMR titration experiments. The hydrophobic residues that make up the substrate-binding sites are shown as sticks. (C) The hydrophobic residues in TF are colored green whereas all other residues are colored white. (D) TF sequence conservation is color mapped on the TF structure. The residues that make up the substrate-binding sites are the best conserved along with the ribosome-binding loop (RB loop) (see fig. S12).
Fig. 2
Fig. 2. TF-binding sites and secondary structure in unfolded PhoA
(A) Secondary structure propensity (SSP) values (59) of unfolded PhoA plotted as a function of the amino acid sequence. A SSP score at a given residue of 1 or −1 reflects a fully formed α-helical or β-structure (extended), respectively, whereas a score of, for example, 0.5 indicates that 50% of the conformers in the native state ensemble of the protein are helical at that position. The data show that several of the secondary structure elements in the folded PhoA retain some transient structure in the unfolded PhoA. The TF-binding sites (a–g) are indicated. (B) SSP values of unfolded PhoA that correspond to secondary structure elements present in folded PhoA are mapped on the structure of folded E. coli PhoA. The signal sequence region (residues 1-22) was modeled into the crystal structure of the mature form (PDB ID 1Y6V). Only one subunit of the dimeric PhoA is shown. (C) Plot of the hydrophobicity of PhoA as a function of its primary sequence. A hydrophobicity score (Roseman algorithm, window=9) higher than zero denotes increased hydrophobicity. The seven PhoA regions (labeled a through g) identified by NMR to interact with TF are highlighted in grey. (D) Mapping of the TF-binding sites (a to g) on the folded PhoA structure.
Fig. 3
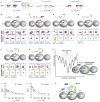
Fig. 3. Dynamic binding and energetics of PhoA by TF
(A) TF-binding sites in PhoA colored as in Fig. 2A. Three TF molecules are required for the simultaneous engagement of the entire PhoA. The Kd for each complex is shown. PhoA residues of sites a, b, and c whose intermolecular NOEs to TF residues are depicted on panels B to G are indicated. (B to G). The interaction of the independent PhoA site a (B), site b (C), subsite c1 (D), subsite c2 (E), subsites c1-c2 (F) and subsites c1-c2-c3 (site c) (G) with TF has been characterized by NMR and ITC. The four PhoA-binding sites in TF (A to D) are labeled in pink. In the rectangles labeled “HSQC peaks” representative peaks from 1H-15N correlated spectra of labeled TF (TFSBD-PPD) free (grey) and in complex (magenta) with the indicated PhoA site are shown. In the rectangles labeled “Inter-NOEs TF-PhoA” representative inter-molecular NOEs between the TF and PhoA residues are shown. The full NOESY strips are shown in fig. S13. The symbol X indicates the absence of such NOEs. The Kd values were determined by ITC and NMR. Solid arrows indicate experimentally observed binding of the PhoA site to the designated TF site. Broken arrows indicate transient interaction observed by chemical shift perturbation but for which no intermolecular NOEs were detected. The orange cross-peak (marked with an asterisk) for TF site A in panel F corresponds to the chemical shift observed for the binding of the individual subsite c2 to TF site A shown in panel E. Similarly, the orange and dark orange cross-peaks marked with asterisks in panel G for TF site B correspond to the chemical shifts for the binding of the individual subsite c1 (panel D) and the fragment c1-c2 (panel F), respectively. All these resonances fall on the same line connecting the free and PhoA site c-bound TF peaks (93), further supporting the observed synergistic binding between the PhoA sites as the length of PhoA increases, as well as the selectivity of certain PhoA sites for specific TF sites. (H) The progressive increase in PhoA length results in increased affinity for PhoA interaction with TF and when PhoA is sufficiently long to engage all four of the TF sites simultaneously, as is the case with PhoAa-c, a unique binding mode between PhoA and TF is observed as shown in this panel. The binding of PhoA to TF can be described by a rugged free energy landscape, with the conformational arrangement of the TF–PhoAa-c complex depicted in this panel corresponding to the lowest-energy, ground-state structure. The binding interactions shown in panels B to G correspond to higher energy states. The results for the interaction of PhoA sites d to g with TF are shown in fig. S17. (I,J) Representative relaxation dispersion profiles of three TF residues in complex with PhoA site a (I) and PhoAa-c (J). R2eff is the effective transverse relaxation rate, and νCPMG is the refocusing frequency of the CPMG train pulse. (K) Exchange rate constants (kex) determined experimentally for the complex between TF and PhoAa-c. The residence time of PhoAa-c bound to TF is ~20 ms at 25 °C.
Fig. 4
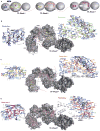
Fig. 4. Structural basis for the formation of the TF–PhoA complexes
(A) Schematic for the interaction of PhoA with TF based on the current structural data. The TF-binding sites in PhoA are colored as in Fig. 2 and 3A. (B to D) Lowest-energy structure of the three TF molecules in complex with the corresponding PhoA regions. TF is shown as a solvent-exposed surface and PhoA as a pink ribbon. The PhoA residues that directly interact with TF are drawn in a ball-and-stick representation, colored as in panel A. The pink arrows denote the direction of the PhoA chain, from the N to the C terminus. Close-up views of the structures are shown on the left for PPD (site D) and on the right for SBD (sites A, B, and C) bound to the corresponding PhoA sites. In the expanded views, the TF backbone is shown as a white cartoon whereas the PhoA backbone as a pink cartoon. The side chains of TF are colored blue, whereas the side chains of PhoA are colored using the color code for each site. The black broken lines denote hydrogen bonds (present in at least 70% of the conformers of the ensemble).
Fig. 5
Fig. 5. Effect of mutations in substrate-binding sites on TF activity
(A) Binding affinity determined by ITC for PhoAa-c to TFWT and TFmutB. TFmutB is a mutant in which four hydrophobic amino acids of the TF site B were substituted (fig. S23). The mutations result in 6-fold decrease in the affinity. (B) Aggregation of chemically denatured GADPH monitored by light scattering at 620 nm, in the absence or presence of TFWT and its variants. In contrast to TFWT, TFmutB has very poor anti-aggregation activity. The anti-aggregation activity is also compromised in TFmutC, a mutant in which a single hydrophobic amino acid of the TF site C was substituted (fig. S23), as well as in a TF construct wherein PPD has been deleted (TFΔPPD).
Fig. 6
Fig. 6. Substrate recognition conformational plasticity by TF
(A to D) Interaction and recognition patterns of the PhoA sites in the complexes with the three TF molecules. A close-up view of each one of the four substrate-binding sites in TF (labeled TF site A, B, C, and D) is shown with the backbone in white ribbon and the interacting residues in blue sticks. The position of hydrophobic residues from PhoA sites interacting with TF is projected on the TF structure and denoted as large (for aromatic or Ile/Leu residues) or small (for Ala/Val residues) circles. For clarity, only one TF molecule is shown. The substrate-binding sites A, B, and C in TF are decorated with polar residues (highlighted with grey circles) that form hydrogen bonds with PhoA. Only PhoA residues involved in nonpolar contacts are shown. The color code of the PhoA residues (in circles) is as follows: site a (blue), site c (green), site d (yellow), site e (orange), site f (magenta), site g (red). (E,F) Superposition of the TF substrate-binding sites (site B in E, site D in F) in indicated PhoA-bound complexes. PhoA is not shown for clarity. The TF side chains undergo significant rearrangement to interact with the different PhoA regions.
Fig. 7
Fig. 7. Anti-aggregation and unfoldase activity of TF
(A) Schematic of MBP unfolding and binding reactions between TF and MBPmut. ΔGf is the free energy of folding and ΔGb is the free energy of binding. The sites that TF uses to interact with the unfolded state of MBPmut, as determined by NMR, are colored red. (B) 1H-13C correlated methyl NMR spectra of the interaction between TF and MBPmut. The spectrum shown on the left was recorded at 38 °C using labeled TF and unlabeled MBPmut, whereas the spectrum shown on the right was recorded at 22 °C using the reverse labeling scheme. No interaction is observed at 22 °C, where the unfolded population of MBPmut is negligible, while binding was observed at 38 °C where the unfolded population of MBPmut is appreciable. For clarity, only the region of the Leu and Val methyl resonances is shown. The full-range spectra are shown in fig. S25. (C) 1H-13C correlated methyl NMR spectra of the fusion construct between TF and MBPmut (TF-f-MBPmut, yellow). The spectra of free TF (blue) and free MBPmut (orange) are also shown for comparison. The spectrum on the left depicts the region of the Leu and Val methyl resonances whereas the one on the right depicts the region of the Ile methyl resonances. The disappearance of the peaks belonging to MBPmut residues residing in folded regions and the appearance of peaks in the random-coil region indicates that MBPmut is unfolded when fused to TF. Addition of maltose (green resonances on the Ile spectrum) stabilizes MBPmut and prevents its unfolding by TF.

Comment in

Similar articles

Cited by

References

    1. Bukau B, Weissman J, Horwich A. Molecular chaperones and protein quality control. Cell. 2006;125:443–451. - PubMed
    1. Kramer G, Boehringer D, Ban N, Bukau B. The ribosome as a platform for co-translational processing, folding and targeting of newly synthesized proteins. Nat Struct Mol Biol. 2009;16:589–597. - PubMed
    1. Ulrich Hartl F, Hayer-Hartl M. Converging concepts of protein folding in vitro and in vivo. Nat Struct Mol Biol. 2009;16:574–581. - PubMed
    1. Horwich AL. Protein folding in the cell: an inside story. Nat Med. 2011;17:1211–1216. - PubMed
    1. Hartl FU, Bracher A, Hayer-Hartl M. Molecular chaperones in protein folding and proteostasis. Nature. 2011;475:324–332. - PubMed

Publication types

MeSH terms