. 2014 May 7:5:3780.
doi: 10.1038/ncomms4780.

Single-vesicle architecture of synaptobrevin2 in astrocytes

Affiliations

Single-vesicle architecture of synaptobrevin2 in astrocytes

Priyanka Singh et al. Nat Commun. .

Abstract

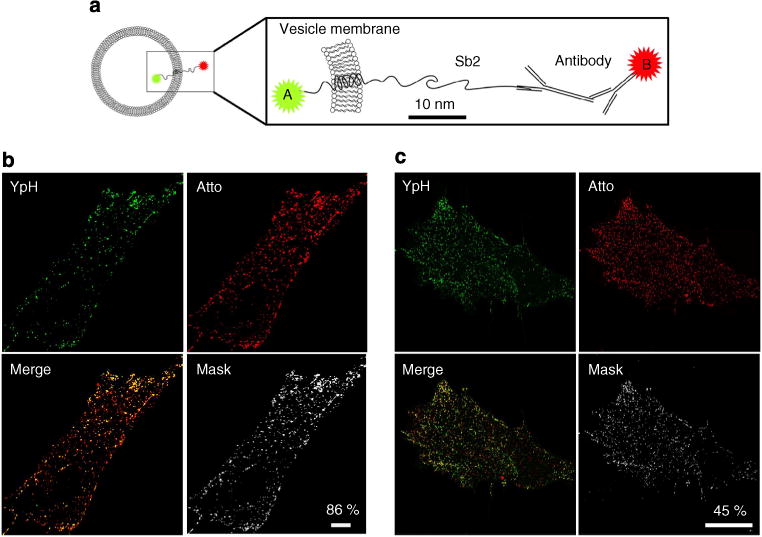
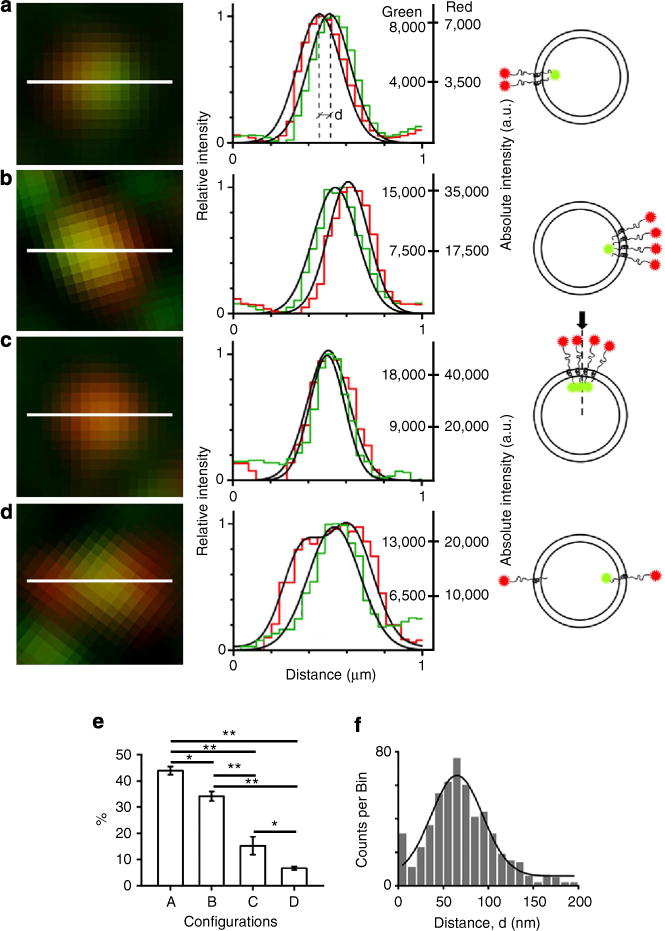
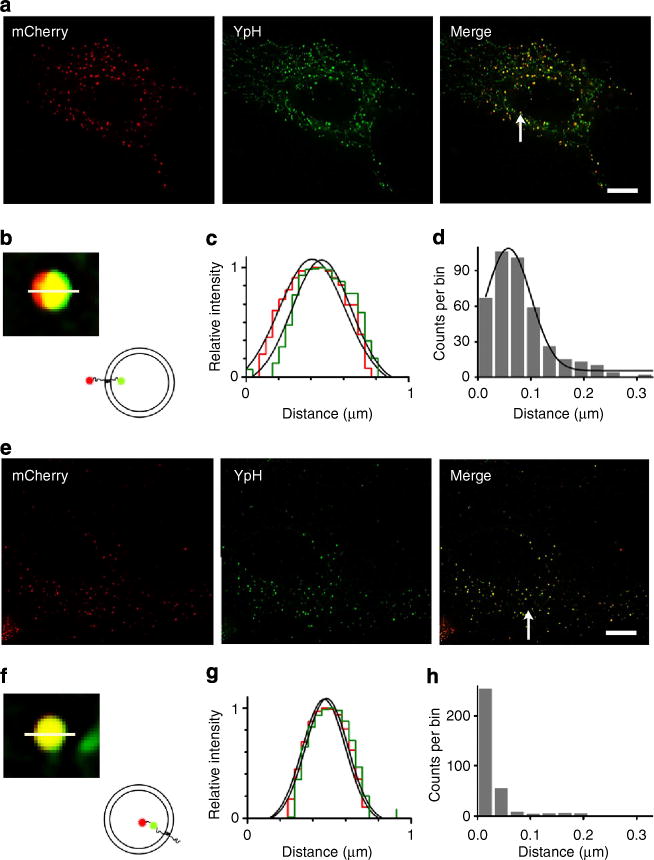
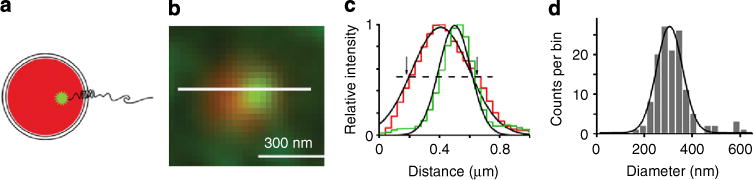
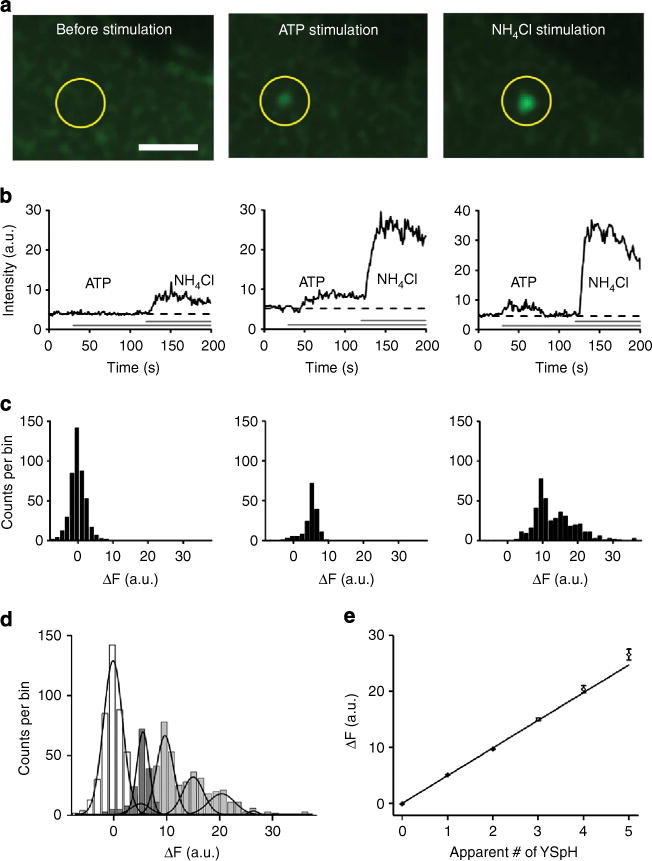
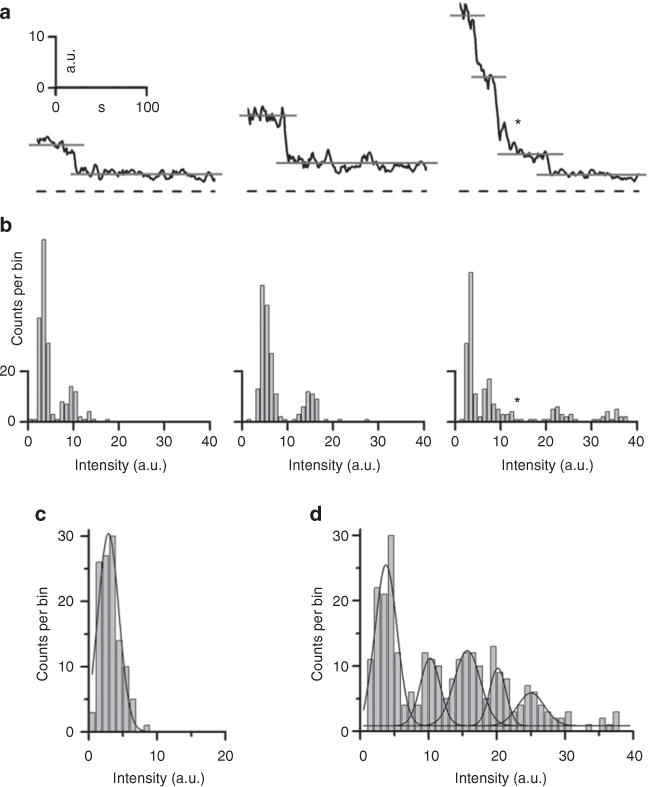
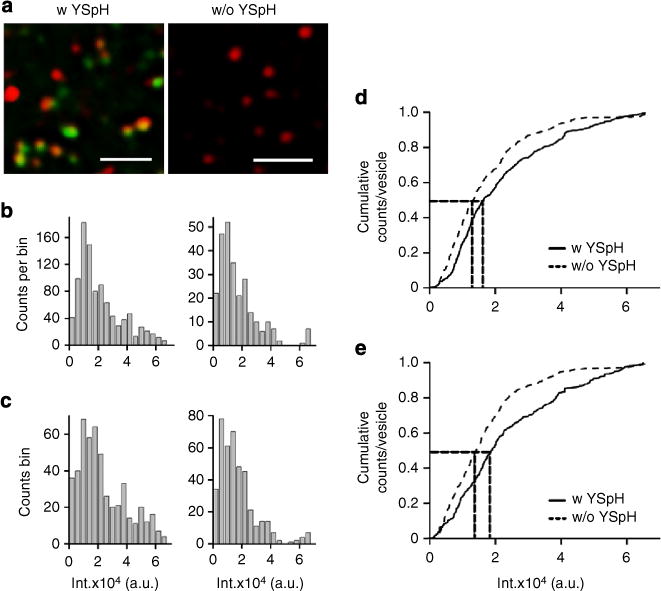
Exocytic transmitter release is regulated by the SNARE complex, which contains a vesicular protein, synaptobrevin2 (Sb2). However, Sb2 vesicular arrangement is unclear. Here we use super-resolution fluorescence microscopy to study the prevalence and distribution of endogenous and exogenous Sb2 in single vesicles of astrocytes, the most abundant glial cells in the brain. We tag Sb2 protein at C- and N termini with a pair of fluorophores, which allows us to determine the Sb2 length and geometry. To estimate total number of Sb2 proteins per vesicle and the quantity necessary for the formation of fusion pores, we treat cells with ATP to stimulate Ca2+-dependent exocytosis, increase intracellular alkalinity to enhance the fluorescence presentation of yellow-shifted pHluorin (YpH), appended to the vesicle lumen domain of Sb2, and perform photobleaching of YpH fluorophores. Fluorescence intensity analysis reveals that the total number of endogenous Sb2 units or molecules per vesicle is ≤25.


Conflict of interest statement

Competing financial interests: The authors declare no competing financial interests.

Figures

Figure 1
Figure 1. Vesicle-associated membrane protein Sb2 fluorescently labelled at the luminal and cytoplasmic sides of the vesicle membrane
(a) The diagram represents an astrocytic vesicle (left) in which a version of Sb2 is expressed, with a fluorescent protein in the vesicle lumen (fluorophore A, that is, YpH) and with an immunolabelled cytoplasmic domain (fluorophore B, that is, Atto 594). The boxed diagram on right shows the architecture of Sb2 across the vesicle membrane, drawn to scale by considering the length of Sb2,. b and c are images from CLSM and SIM, respectively. To stain Sb2 in vesicle lumen, astrocytes were transfected with a plasmid encoding YSpH (green). To stain the N-terminal part of Sb2 located on the cytosolic side of the vesicle membrane, primary antibody against Sb2 and a secondary antibody conjugated to Atto 594 (Atto; red) were used. Merge panels show overlay of YSpH and Atto signals arising from the vesicle lumen and the cytoplasm. Mask panels show only the colocalized pixels between YpH and Atto. Bar, 10 μm. Note the smaller amount of colocalization (percent, shown for representative single astrocytes) in the SIM image than in the CLSM image.
Figure 2
Figure 2. Patterns of two Sb2-associated fluorophores reveal nonuniform vesicular distribution of Sb2
(a–d) Each panel contains (left to right) a SIM image, a graph and a drawing. SIM images (left column) show different patterns of Atto (red) and YpH (green) fluorophores tagging Sb2. Graphs (middle column) show normalized/relative fluorescence intensity profiles (red and green fluorescence along the section, that is, line, in corresponding SIM image). The right ordinates of the intensity profiles show absolute intensity (a.u., arbitrary unit) of green and red fluorescent puncta. Schematics in the right column show possible arrangements of two fluorophores in a single vesicle. The arrow and vertical dash-line are drawn to visualize the top view of the fluorophore pair (c). The order of images (a–d) is according to abundance (shown in %) of the pattern observed in astrocytes as summarized in graph (e). The error bars represent s.e.m. We analyzed three astrocytes in which a total of 349 vesicles were examined. *P<0.02 and **P<0.001 (ANOVA). As indicated in line profile in a, distance (proximity) between the green and red fluorophores, d, can be determined as the distance between the peaks. The frequency distribution plot of inter-fluorophore distance measured for all YpH-Atto pairs is shown in f The mean value for the distance between YpH and Atto is 65±2 nm (mean ± s.e.m.), which is calculated by fitting a Gaussian curve (f) on a frequency distribution plot of the form Counts/bin = {A/[σ(√2π)]} × exp{− [x − μ)2/2σ2]} (Equation 1) where × = distance (nm), total count A = (4,295 ± 503); σ = 28.6; μ = (65 ± 2) nm. The squared correlation coefficient R2 = 0.90, n = 541 vesicles, 5 cells; difference from zero was statistically significant (P< 0.001; ANOVA).
Figure 3
Figure 3. SIM measurements of the distance between fluorescent proteins appended to Sb2 termini
a and e are the SIM images showing astrocytes transfected with mCherry-YSpH and YSpH-7aa-mCherry plasmids, respectively. Bar, 10mm. Merge panels show the overlay of the fluorescence of mCherry (red) and YpH (green) signals. b and f are close-up images of the mCherry and YpH pairs obtained from the images (Merge, arrow) in a and e respectively. The inset drawings indicate the orientation of YpH and mCherry decorating Sb2. c and g show relative fluorescence intensity profiles along the lines drawn in b and f. The histograms d and h show frequency distribution plots of the distances between the two fluorophores. (d) In case of mCherry-YSpH, the mean value of the distance (peak-to-peak, as in Fig. 2a) between YpH (intravesicular) and mCherry (cytoplasmic) is 57±1 nm (mean±s.e.m.) (R2 = 0.98, n= 403 vesicles, 7 cells; significantly different than zero, P<0.001; ANOVA). To measure the peak-to-peak distance, we fitted Gaussian curves using Equation 1. (h) In the case of YSpH-7aa-mCherry, the mean distance between two fluorophores juxta-positioned (spacing provided by a 7-aa linker) in the vesicular lumen is negligible (0±5 nm; n = 338 vesicles, 6 cells).
Figure 4
Figure 4. Measurement of vesicle diameter in live astrocytes by SIM
(a) Diagram of an astrocytic vesicle loaded with LysoTracker DND-99 (red), expressing YSpH (green) and (b) the corresponding SIM image in a live astrocyte. Bar, 300 nm. (c) Fluorescence intensity profile of LysoTracker and YpH in the vesicle lumen along the line drawn in b. The dashed line indicates how the apparent diameter of a vesicle was determined, by measuring the FWHM of Gaussian curve of the red fluorophore. Note the intersection with Gaussian curve drawn on normalized intensity of the red fluorophore, marked with arrows. (d) The frequency distribution plot for apparent vesicle diameter, as defined in c. The mean value (mean±s.e.m.) of the apparent vesicle diameter is 305±3 nm (n =129 vesicles, 9 cells), measured by fitting a Gaussian curve of the form described in Equation 1 (R2 = 0.94; significantly different from zero, P<0.001; ANOVA).
Figure 5
Figure 5. Stimulation of YSpH-labelled vesicles by ATP and NH4Cl reveals the number of YSpH molecules present on a single astrocytic vesicle
(a) Time series frames of a representative YSpH-positive vesicle (circle) recorded by CLSM before and after successive stimulations with ATP and NH4Cl. Bar, 1 mm. (b) Examples of time-dependent changes in the fluorescence intensity of individual vesicles: left panel, ATP failed to evoke an increase in fluorescence intensity, however, NH4Cl elicited an increase; middle panel, application of ATP elicited a sustained increase in fluorescence intensity that was augmented by NH4Cl; and right panel, ATP elicited a transient increase in fluorescence intensity, which was followed with NH4Cl-elicited increase. Horizontal grey bars indicate the timing of ATP/NH4Cl applications. (c) Amplitude distributions of the change in YSpH fluorescence intensity (ΔF) recorded in nine astrocytes before and after stimulations (bin width =1.5 a.u.). Left panel, the change in YSpH intensity plot represents a background, which was obtained by monitoring changes in YSpH intensity before and after addition (at 30 s for 10 s) of ATP (bottom horizontal line) in recordings where ATP failed to elicit a significant increase in YSpH. Middle panel, after ATP, and, right panel, subsequent NH4Cl applications, the intensity distribution incrementally shifts to the right as vesicles alkalinize due to the pore formation (ATP) and subsequent chemical alkalinization (NH4Cl), respectively. (d) Combined plot of the change in YSpH intensity distributions for all vesicles (n = 1,045) from nine astrocytes: background (white) and after stimulation with ATP (dark grey) and NH4Cl (light grey). The Gaussian curves are fitted by keeping the s.d. as determined in the background shown in left panel and using Equation 1 (where x = ΔF (a.u.), for fitting parameters see Table 1). (e) The peaks of the Gaussian fits of different modes of intensities (obtained in d) are plotted as a function of modes, that is, number of YSpH packets; the relationship can be described using a liner regression in the form: ΔF (a.u.) = (4.95 ± 0.04) × apparent # of YSpH+(−0.02 ± 0.05), where # is the number or multiples of YSpH molecules (R2 = 0.997; significantly different from zero, P< 0.001; ANOVA).
Figure 6
Figure 6. Photobleaching of NH4Cl-alkalinized YSpH-laden vesicles confirms the number of YSpH molecules present on a single astrocytic vesicle
(a) Examples of time-dependent changes in the fluorescence intensity signals of individual vesicles: left panel, a single step decrease in the YpH fluorescence, middle panel, a single step decrease in the YpH fluorescence with double amplitude, compared with the event shown in the left panel, and, right panel, multiple step decreases in YpH fluorescence with three discrete steps, ‘*’ denotes another step decrease, which according to frequency plot does not represent a discrete step, but rather belongs to the distribution of the final discrete step. Dashed lines represent the baseline (zero-line) and grey lines show the levels of YpH fluorescence signals at discrete steps. (b) The respective distributions of the fluorescence intensity amplitudes of signals shown in the panel a. The first peak in amplitude plots denotes the lowest intensity observed. (c) The intensity distribution of the background, which was obtained by measuring the fluorescence intensity of the vesicle surroundings after 180 s of bleaching (R2 = 0.95; n = 108 events; bin width = 1.5 a.u.). (d) Fluorescence intensity distribution of YSpH-labelled vesicles after bleaching (R2 = 0.91; n = 277 vesicles; bin width = 1.5 a.u.). The Gaussian curves are fitted by using Equation 1 (× = Intensity (a.u.); see fitting parameters in Table 2).
Figure 7
Figure 7. Quantification of the ratio between the number of YSpH and endogenous Sb2 molecules in astrocytic vesicles
(a) Left fluorescent micrograph shows vesicles in cells transfected by YSpH and labelled by the Atto red dye (note that not all vesicles are labelled by both fluorophores), whereas the right panel shows vesicles in astrocytes labelled by the Atto dye only. Bar, 10 μm. (b,c) We obtained the distributions of Atto fluorescence intensity of Sb2 immunolabelled vesicles containing only endogenous Sb2 (w/o YSpH) and those that additionally contain exogenous Sb2 in form of YSpH (w YSpH). (b) Measurements were performed on vesicles within astrocytes expressing YSpH; some vesicles contained both endogenous Sb2 and YSpH (b, left) (n = 958), while others were devoid of YSpH, expressing only endogenous Sb2 (b, right) (n = 262). (d) The normalized cumulative counts of the Atto intensity in b show significantly different distributions (D = 0.134, P<0.001, Kolmogorov–Smirnov test). The vertical dotted lines drawn indicate the median value of 18,772 a.u. (with YSpH) and 14,115 a.u. (without YSpH) for Atto signals; horizontal dotted line indicates 50% of the total vesicle population. The difference between these two median values (4,657 a.u.) likely denotes the quantum fluorescence of exogenous Sb2, that is, YSpH, which was ~1/3 of that found in vesicles containing only endogenous Sb2. (c) Similar distribution as in b, only that we measured Atto fluorescence intensities of Sb2 immunolabelled vesicles in YSpH-expressing (c, left) (n = 499) and in non-transfected astrocytes (c, right) (n = 419), respectively. (e) The normalized cumulative counts of the Atto intensity in c show significantly different distributions (D = 0.184, P<0.001, Kolmogorov–Smirnov test); the median values at 16,316 a.u. and 13,382 a.u. for Atto signals of w and w/o YSpH vesicles and the difference between these two median values (2,934 a.u.) suggests that exogenous Sb2 molecules represent ~1/5 of the number of endogenous Sb2 molecules; dotted lines as in d.

Similar articles

Cited by

References

    1. Nedergaard M, Ransom B, Goldman SA. New roles for astrocytes: redefining the functional architecture of the brain. Trends Neurosci. 2003;26:523–530. - PubMed
    1. Parpura V, Zorec R. Gliotransmission: exocytotic release from astrocytes. Brain Res Rev. 2010;63:83–92. - PMC - PubMed
    1. Halassa MM, Fellin T, Haydon PG. The tripartite synapse: roles for gliotransmission in health and disease. Trends Mol Med. 2007;13:54–63. - PubMed
    1. Wienisch M, Klingauf J. Vesicular proteins exocytosed and subsequently retrieved by compensatory endocytosis are nonidentical. Nat Neurosci. 2006;9:1019–1027. - PubMed
    1. Hua Y, et al. A readily retrievable pool of synaptic vesicles. Nat Neurosci. 2011;14:833–839. - PubMed

Publication types

LinkOut - more resources