

Rpb4 subunit functions mainly in mRNA synthesis by RNA polymerase II
- PMID: 24802753
- PMCID: PMC4067182
- DOI: 10.1074/jbc.M114.568014
Rpb4 subunit functions mainly in mRNA synthesis by RNA polymerase II
Abstract
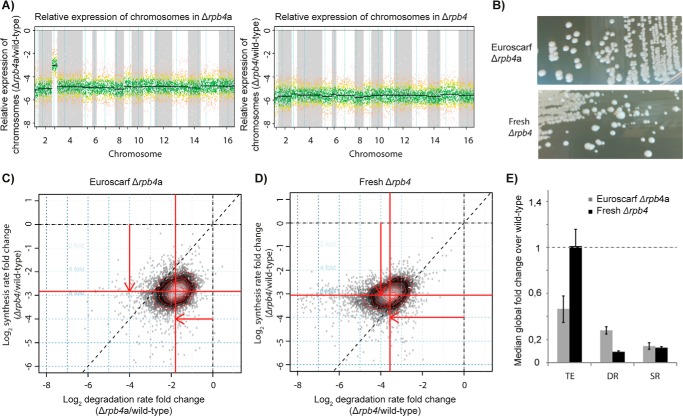
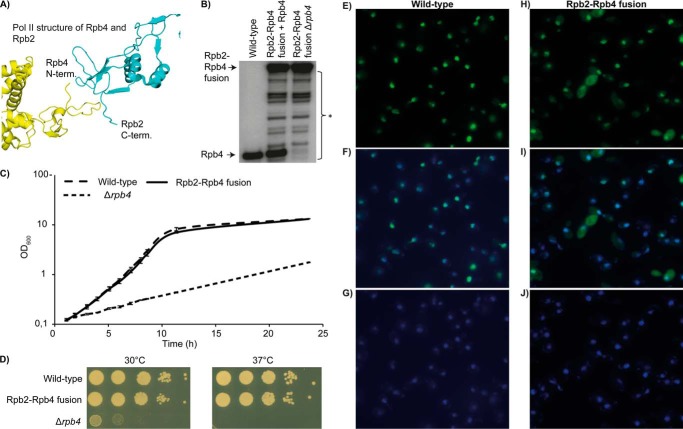
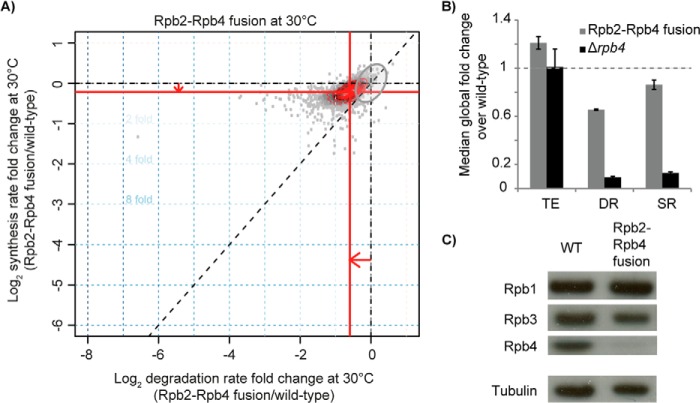
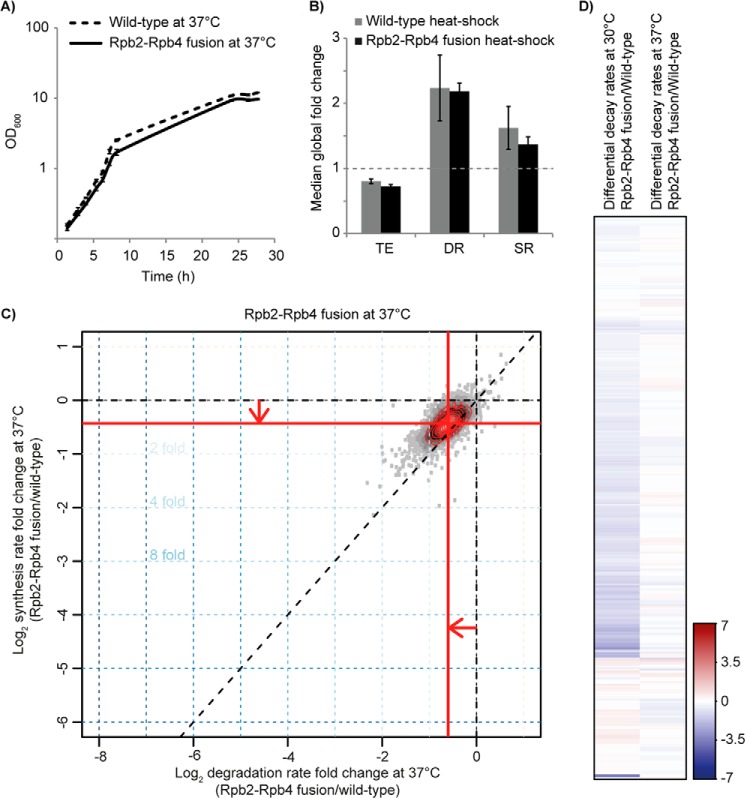
RNA polymerase II (Pol II) is the central enzyme that carries out eukaryotic mRNA transcription and consists of a 10-subunit catalytic core and a subcomplex of subunits Rpb4 and Rpb7 (Rpb4/7). Rpb4/7 has been proposed to dissociate from Pol II, enter the cytoplasm, and function there in mRNA translation and degradation. Here we provide evidence that Rpb4 mainly functions in nuclear mRNA synthesis by Pol II, as well as evidence arguing against an important cytoplasmic role in mRNA degradation. We used metabolic RNA labeling and comparative Dynamic Transcriptome Analysis to show that Rpb4 deletion in Saccharomyces cerevisiae causes a drastic defect in mRNA synthesis that is compensated by down-regulation of mRNA degradation, resulting in mRNA level buffering. Deletion of Rpb4 can be rescued by covalent fusion of Rpb4 to the Pol II core subunit Rpb2, which largely restores mRNA synthesis and degradation defects caused by Rpb4 deletion. Thus, Rpb4 is a bona fide Pol II core subunit that functions mainly in mRNA synthesis.
Keywords: RNA Metabolism; RNA Polymerase II; RNA Turnover; Transcription; mRNA Decay; mRNA Degradation.
© 2014 by The American Society for Biochemistry and Molecular Biology, Inc.
Figures
Similar articles
-
Dissociation of Rpb4 from RNA polymerase II is important for yeast functionality.PLoS One. 2018 Oct 25;13(10):e0206161. doi: 10.1371/journal.pone.0206161. eCollection 2018. PLoS One. 2018. PMID: 30359412 Free PMC article.
-
Unstructured N terminus of the RNA polymerase II subunit Rpb4 contributes to the interaction of Rpb4.Rpb7 subcomplex with the core RNA polymerase II of Saccharomyces cerevisiae.J Biol Chem. 2008 Feb 15;283(7):3923-31. doi: 10.1074/jbc.M708746200. Epub 2007 Dec 4. J Biol Chem. 2008. PMID: 18056993
-
The Rpb4/7 module of RNA polymerase II is required for carbon catabolite repressor protein 4-negative on TATA (Ccr4-not) complex to promote elongation.J Biol Chem. 2014 Nov 28;289(48):33125-30. doi: 10.1074/jbc.C114.601088. Epub 2014 Oct 14. J Biol Chem. 2014. PMID: 25315781 Free PMC article.
-
RNA polymerase II phosphorylation and gene looping: new roles for the Rpb4/7 heterodimer in regulating gene expression.Curr Genet. 2020 Oct;66(5):927-937. doi: 10.1007/s00294-020-01084-w. Epub 2020 Jun 7. Curr Genet. 2020. PMID: 32508001 Review.
-
Rpb4 and Rpb7: subunits of RNA polymerase II and beyond.Trends Biochem Sci. 2004 Dec;29(12):674-81. doi: 10.1016/j.tibs.2004.10.007. Trends Biochem Sci. 2004. PMID: 15544954 Review.
Cited by
-
Feedback to the central dogma: cytoplasmic mRNA decay and transcription are interdependent processes.Crit Rev Biochem Mol Biol. 2019 Aug;54(4):385-398. doi: 10.1080/10409238.2019.1679083. Epub 2019 Oct 27. Crit Rev Biochem Mol Biol. 2019. PMID: 31656086 Free PMC article. Review.
-
Multiple direct and indirect roles of Paf1C in elongation, splicing, and histone post-translational modifications.bioRxiv [Preprint]. 2024 Apr 25:2024.04.25.591159. doi: 10.1101/2024.04.25.591159. bioRxiv. 2024. Update in: Cell Rep. 2024 Sep 24;43(9):114730. doi: 10.1016/j.celrep.2024.114730 PMID: 38712269 Free PMC article. Updated. Preprint.
-
Multiple direct and indirect roles of the Paf1 complex in transcription elongation, splicing, and histone modifications.Cell Rep. 2024 Sep 24;43(9):114730. doi: 10.1016/j.celrep.2024.114730. Epub 2024 Sep 7. Cell Rep. 2024. PMID: 39244754 Free PMC article.
-
Rpb4 and Puf3 imprint and post-transcriptionally control the stability of a common set of mRNAs in yeast.RNA Biol. 2021 Aug;18(8):1206-1220. doi: 10.1080/15476286.2020.1839229. Epub 2020 Nov 1. RNA Biol. 2021. PMID: 33094674 Free PMC article.
-
Identification of a transcriptional activation domain in yeast repressor activator protein 1 (Rap1) using an altered DNA-binding specificity variant.J Biol Chem. 2017 Apr 7;292(14):5705-5723. doi: 10.1074/jbc.M117.779181. Epub 2017 Feb 14. J Biol Chem. 2017. PMID: 28196871 Free PMC article.
References
-
- Sun M., Schwalb B., Pirkl N., Maier K. C., Schenk A., Failmezger H., Tresch A., Cramer P. (2013) Global analysis of eukaryotic mRNA degradation reveals Xrn1-dependent buffering of transcript levels. Mol. Cell 52, 52–62 - PubMed
-
- Bregman A., Avraham-Kelbert M., Barkai O., Duek L., Guterman A., Choder M. (2011) Promoter elements regulate cytoplasmic mRNA decay. Cell 147, 1473–1483 - PubMed
MeSH terms
Substances
LinkOut - more resources
Full Text Sources
Other Literature Sources
Molecular Biology Databases
