. 2014 May 15;5(9):2635-47.
doi: 10.18632/oncotarget.1862.

Glutaminase 2 negatively regulates the PI3K/AKT signaling and shows tumor suppression activity in human hepatocellular carcinoma

Affiliations

Glutaminase 2 negatively regulates the PI3K/AKT signaling and shows tumor suppression activity in human hepatocellular carcinoma

Juan Liu et al. Oncotarget. .

Abstract

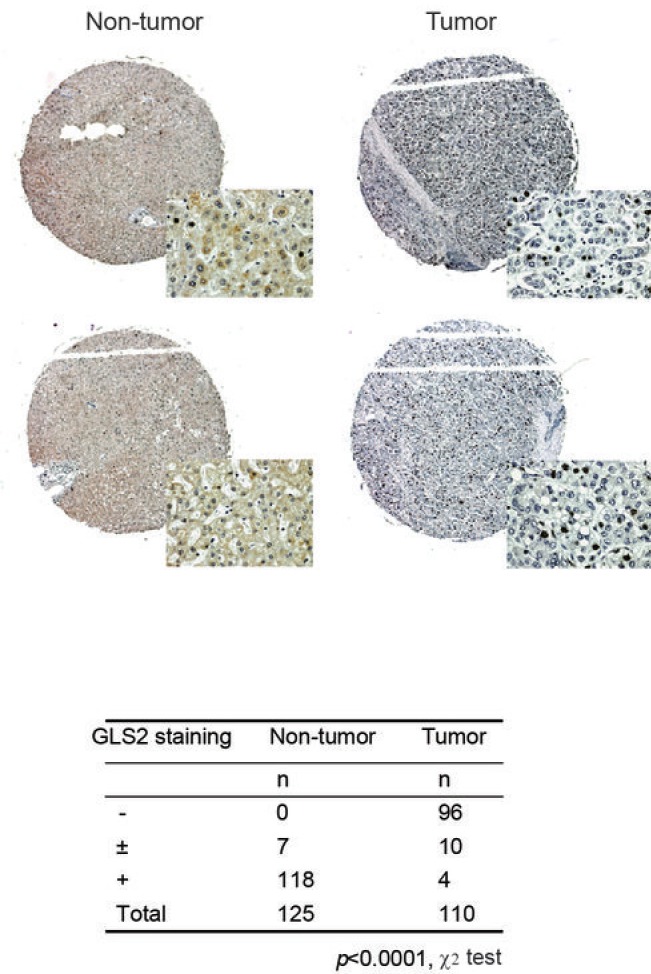
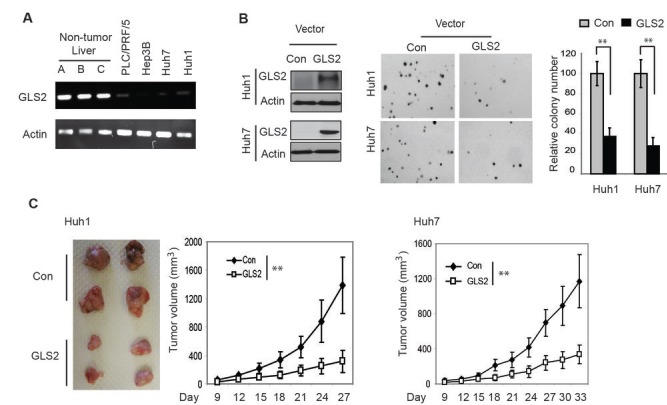
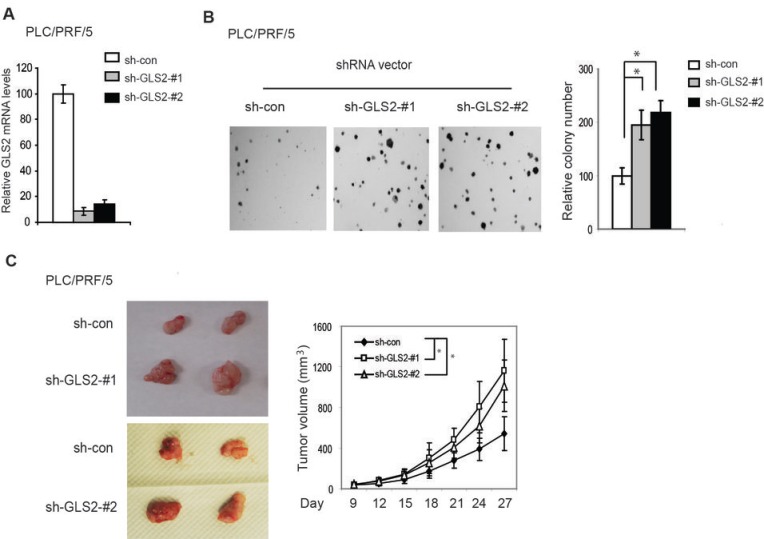
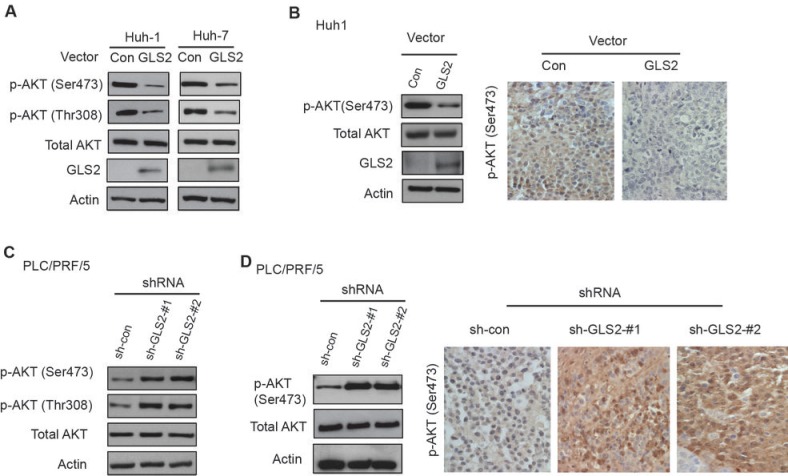
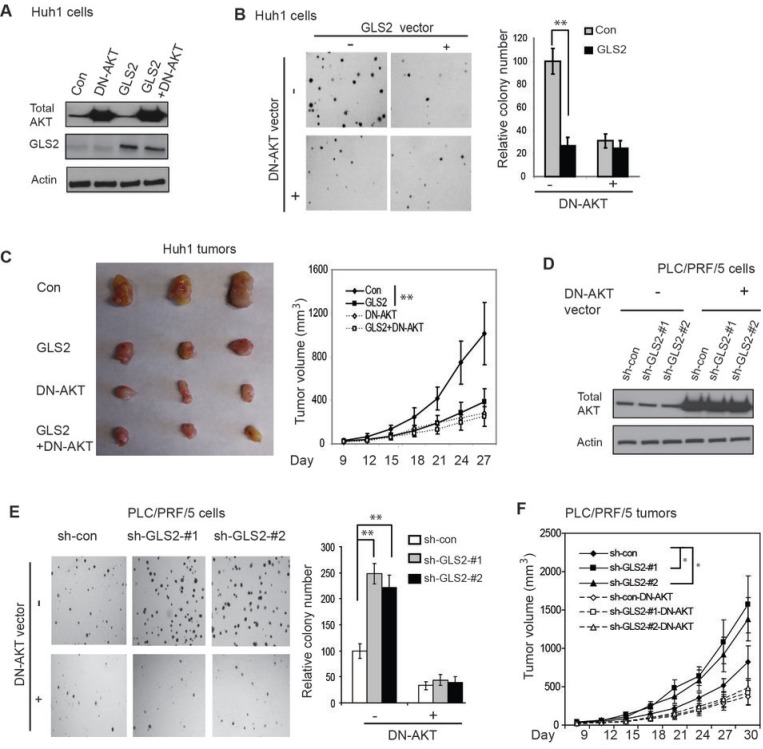
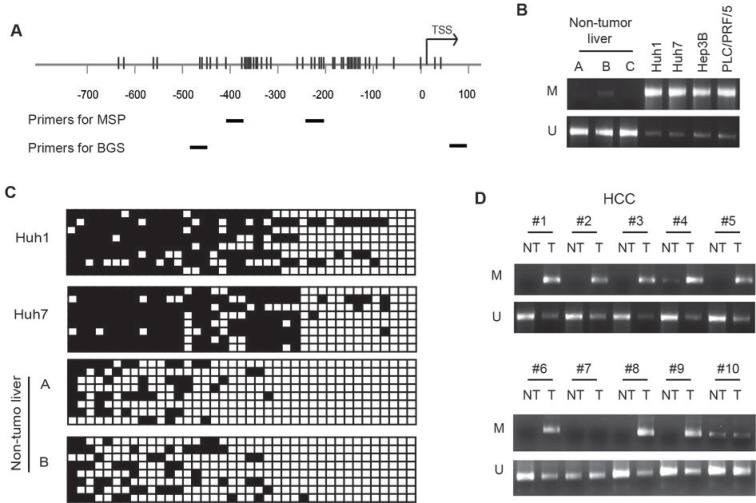
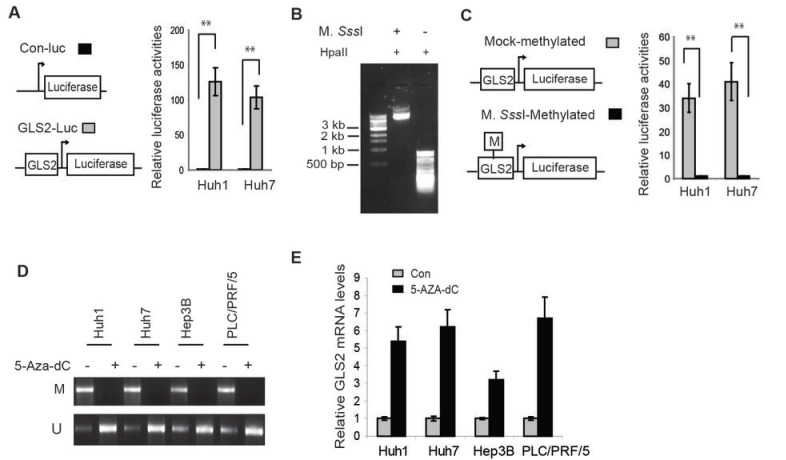
The tumor suppressor p53 and its signaling pathway play a critical role in tumor prevention. As a direct p53 target gene, the role of glutaminase 2 (GLS2) in tumorigenesis is unclear. In this study, we found that GLS2 expression is significantly decreased in majority of human hepatocellular carcinoma (HCC). Restoration of GLS2 expression in HCC cells inhibits the anchorage-independent growth of cells and reduces the growth of HCC xenograft tumors. Interestingly, we found that GLS2 negatively regulates the PI3K/AKT signaling, which is frequently activated in HCC. Blocking the PI3K/AKT signaling in HCC cells largely abolishes the inhibitory effect of GLS2 on the anchorage-independent cell growth and xenograft tumor growth. The GLS2 promoter is hypermethylated in majority of HCC samples. CpG methylation of GLS2 promoter inhibits GLS2 transcription, whereas reducing the methylation of GLS2 promoter induces GLS2 expression. Taken together, our results demonstrate that GLS2 plays an important role in tumor suppression in HCC, and the negative regulation of PI3K/AKT signaling contributes greatly to this function of GLS2. Furthermore, hypermethylation of GLS2 promoter is an important mechanism contributing to the decreased GLS2 expression in HCC.


Conflict of interest statement

The authors declare no conflict of interest.

Figures

Figure 1
Figure 1. The decreased protein expression of GLS2 in human primary HCCs
The GLS2 protein expression in HCC samples in three tissue microarrays (TMAs; US Biomax) as measured by IHC assays. The three TMAs contain totally 110 primary HCCs and 125 non-tumor liver samples. Upper panels: Representative IHC staining of GLS2 in 2 HCCs which showed negative staining (-) and 2 non-tumor liver tissues which showed positive staining (+). Lower panel: IHC staining results in the TMA. -: 0% positive staining cells; ±: <10% positive staining cells; +: ≥10% positive staining cells. The p values were calculated using χ2 tests. The clinico-pathological information of HCC samples was presented in Supplementary Tables S1 & S2.
Figure 2
Figure 2. GLS2 inhibits anchorage-independent growth of HCC cells and growth of HCC xenograft tumors
(A). GLS2 mRNA expression in different HCC cell lines and 3 non-tumor liver tissues (provided by Origene) as measured by semi-quantitative RT-PCR. (B) Ectopic expression of GLS2 in Huh1 and Huh7 cells inhibited anchorage-independent growth of cells in soft agar. Left panel: Huh1 and Huh7 cells were stably transduced with pLPCX-GLS2 vectors expressing GLS2 or control empty vectors. GLS2 expression in cells was detected by Western-blot assays. Middle panel: Representative images of anchorage-independent growth of cells in soft agar. Right Panel: relative colony number of cells with ectopic GLS2 expression or control cells in soft agar. Data are presented as mean ± SD (n = 5). **: p<0.001; Student t-tests. (C) Ectopic expression of GLS2 in Huh1 and Huh7 cells inhibited the growth of xenograft tumors. Left panel: Representative images of xenograft tumors formed by Huh1 cells with or without ectopic GLS2 expression at day 27 after inoculation of cells. Middle panel: The growth curves of xenograft tumors formed by Huh1 cells with or without ectopic GLS2 expression. Right panel: The growth curves of xenograft tumors in nude mice formed by Huh7 cells with or without ectopic GLS2 expression. Data are presented as mean ± SD (n=10); **: p<0.001; ANOVA followed by Student’s t-tests.
Figure 3
Figure 3. Knockdown of GLS2 promotes anchorage-independent growth of HCC cells and growth of HCC xenograft tumors
(A) Knockdown of endogenous GLS2 in PLC/PRF/5 cells measured by Taqman real-time PCR assays. Cells were stably transduced with control shRNA vectors (sh-con) or 2 different vectors against GLS2 (sh-GLS2-#1 and sh-GLS2-#2). The mRNA levels of GLS2 were measured by real-time PCR and normalized with Actin. The relative levels of GLS2 in control cells were designated as 1. (B) Knockdown of GLS2 promoted anchorage-independent growth of PLC/PRF/5 cells in soft agar. Left panel: Representative images of anchorage-independent growth of cells in soft agar. Right panel: relative colony number of cells with GLS2 knockdown or control cells in soft agar. (C) Knockdown of GLS2 in PLC/PRF/5 cells promoted the growth of xenograft tumors. Left panel: Representative images of xenograft tumors formed by control cells or cells with stable GLS2 knockdown by 2 different shRNA vectors at day 27 after inoculation of cells. Right Panel: The growth curves of xenograft tumors formed by PLC/PRF/5 cells with or without GLS2 knockdown. Data are presented as mean ± SD (n = 3 in A; n=5 in B; n=10 in C). * p<0.01. Student’s t-tests in B; ANOVA followed by Student’s t-tests in C.
Figure 4
Figure 4. GLS2 negatively regulates the PI3K/AKT signaling in HCC cells
(A) Ectopic expression of GLS2 reduced AKT phosphorylation at Ser473 and Thr308 in Huh1 and Huh7 cells as measured by Western-blot assays. (B) Ectopic expression of GLS2 reduced AKT phosphorylation at Ser473 in xenograft tumors formed by Huh1 cells as detected by Western-blot (left) and IHC staining (right) assays, respectively. (C) GLS2 knockdown by 2 different shRNA vectors increased AKT phosphorylation at Ser473 and Thr308 in PLC/PRF/5 cells as measured by Western-blot assays. GLS2 knockdown was presented in Figure 3A. (D) GLS2 knockdown by shRNA vectors increased AKT phosphorylation at Ser473 in xenograft tumors formed by PLC/PRF/5 cells as detected by Western-blot (left) and IHC staining (right) assays, respectively.
Figure 5
Figure 5. GLS2 negatively regulates the PI3K/AKT signaling to inhibit anchorage-independent growth of HCC cells and growth of xenograft HCC tumors
(A) Ectopic expression of GLS2 and/or a dominant negative AKT (DN-AKT, K179M) in Huh1 cells measured by Western-blot assays. Cells were stably transduced with pLPCX-GLS2 vectors and/or pLHCX-DN-AKT (K179M) vectors. Control cells were transduced with control empty vectors (Con). (B) Expression of DN-AKT largely abolished the inhibitory effect of GLS2 on anchorage-independent growth of Huh1 cells in soft agar. Left panels: Representative images of anchorage-independent growth of Huh1 cells in soft agar. Right Panel: Relative colony number of Huh1 cells in soft agar. (C) DN-AKT largely abolished the inhibitory effect of GLS2 on the growth of xenograft tumors formed by Huh1 cells. Left panels: Representative images of xenograft tumors formed by Huh1 cells at day 27 after inoculation of cells. Right Panel: The growth curves of xenograft tumors formed by Huh1 cells. (D) Ectopic expression of the DN-AKT (K179M) in PLC/PRF/5 cells with GLS2 knockdown measured by Western-blot assays. PLC/PRF/5 cells with GLS2 knockdown (shown in Figure 3A) were transduced with the DN-AKT vectors. (E & F). DN-AKT largely abolished the promoting effect of GLS2 knockdown on anchorage-independent growth of PLC/PRF/5 cells (E) and on the growth of xenograft tumors formed by PLC/PRF/5 cells (F). Left panels in E: Representative images of anchorage-independent growth of PLC/PRF/5 cells in soft agar. Right panel in E: Relative colony number of PLC/PRF/5 cells. Data are presented as mean ± SD (n = 5 in B & E; n=10 in C & F). **: p<0.001; *: p<0.01; Student’s t-tests in B & E, and ANOVA followed by Student’s t-tests in C & F.
Figure 6
Figure 6. Hypermethylation of the GLS2 promoter in HCC cells and primary HCCs
(A) CpG sites in the GLS2 promoter region. CpG sites and their genomic positions in the GLS2 promoter region are represented by vertical lines. Nucleotide positions are numbered relative to the transcriptional start site (TSS; +1). Positions of primers for methylation-specific PCR (MSP) and bisulfite genomic sequencing (BGS) assays are labeled. (B) Hypermethylation of the GLS2 promoter in HCC cells detected by MSP analysis. The methylation status of GLS2 promoter in 4 HCC cell lines and 3 non-tumor liver tissues (provided by Origene) were analyzed by MSP. U: PCR with unmethylation-specific primers; M: PCR with methylation-specific primers. (C) Hypermethylation of the GLS2 promoter in HCC cell lines analyzed by BGS analysis. Eight clones of PCR products of bisulfite-treated DNA from 2 HCC cell lines and 2 non-tumor liver tissues (Origene) were sequenced. Black and white squares represent methylation and unmethylation, respectively. (D) Hypermethylation of the GLS2 promoter in primary HCCs detected by MSP. The 21 pairs of primary HCCs and their matched non-tumor liver tissues were analyzed by MSP. Representative images are MSP results of samples #1-10. NT: Non-tumor liver tissue; T: Tumor.
Figure 7
Figure 7. Promoter hypermethylation reduces GLS2 expression in HCC cells
(A) GLS2 promoter activated the luciferase reporter vectors in Huh1 and Huh7 cells. Left panel: Schematic representations of control luciferase reporter vectors (Con-Luc) and reporter vectors containing GLS2 promoter region (GLS2-Luc). The relative luciferase activities of control reporter were designated as 1. (B) Complete methylation of the pGL2-GLS2 reporter vectors as revealed by digestion of HpaII. The vectors methylated by M. SssI or mock-methylated were digested with HpaII and separated on an agrose gel. (C) Methylation of GLS2 promoter reduced the luciferase activities of reporter vectors in Huh1 and Huh7 cells. Left panel: Schematic representations of the unmethylated pGL2 luciferase reporter vectors containing methylated or mock-methylated GLS2 promoter. The relative luciferase activities of the reporter vectors containing methylated GLS2 promoter were designated as 1. (D) 5-Aza-dC reduced methylation of GLS2 promoter in HCC cells as measured by MSP assays. Cells were treated with 5-Aza-dC (5 μM) or DMSO for 7 days. U: PCR with unmethylation-specific primers; M: PCR with methylation-specific primers. (E) 5-Aza-dC induced GLS2 mRNA levels in HCC cells. GLS2 mRNA levels were measured by Taqman real-time PCR assays and normalized with Actin. The relative GLS2 levels in control cells treated with DMSO were designated as 1. Data are presented as mean ± SD (n = 3). **: p<0.001; Student t-tests.

Similar articles

Cited by

References

    1. Levine AJ, Hu W, Feng Z. The P53 pathway: what questions remain to be explored? Cell Death Differ. 2006;13(6):1027–1036. - PubMed
    1. Vousden KH, Prives C. Blinded by the Light: The Growing Complexity of p53. Cell. 2009;137(3):413–431. - PubMed
    1. Levine AJ, Oren M. The first 30 years of p53: growing ever more complex. Nat Rev Cancer. 2009;9(10):749–758. - PMC - PubMed
    1. Greenblatt MS, Bennett WP, Hollstein M, Harris CC. Mutations in the p53 tumor suppressor gene: clues to cancer etiology and molecular pathogenesis. Cancer Res. 1994;54(18):4855–4878. - PubMed
    1. Staib F, Hussain SP, Hofseth LJ, Wang XW, Harris CC. TP53 and liver carcinogenesis. Hum Mutat. 2003;21(3):201–216. - PubMed

Publication types

MeSH terms