. 2014 May 1;10(5):e1004077.
doi: 10.1371/journal.ppat.1004077. eCollection 2014 May.

Severe acute respiratory syndrome coronavirus envelope protein ion channel activity promotes virus fitness and pathogenesis

Affiliations

Severe acute respiratory syndrome coronavirus envelope protein ion channel activity promotes virus fitness and pathogenesis

Jose L Nieto-Torres et al. PLoS Pathog. .

Abstract

Deletion of Severe Acute Respiratory Syndrome Coronavirus (SARS-CoV) envelope (E) gene attenuates the virus. E gene encodes a small multifunctional protein that possesses ion channel (IC) activity, an important function in virus-host interaction. To test the contribution of E protein IC activity in virus pathogenesis, two recombinant mouse-adapted SARS-CoVs, each containing one single amino acid mutation that suppressed ion conductivity, were engineered. After serial infections, mutant viruses, in general, incorporated compensatory mutations within E gene that rendered active ion channels. Furthermore, IC activity conferred better fitness in competition assays, suggesting that ion conductivity represents an advantage for the virus. Interestingly, mice infected with viruses displaying E protein IC activity, either with the wild-type E protein sequence or with the revertants that restored ion transport, rapidly lost weight and died. In contrast, mice infected with mutants lacking IC activity, which did not incorporate mutations within E gene during the experiment, recovered from disease and most survived. Knocking down E protein IC activity did not significantly affect virus growth in infected mice but decreased edema accumulation, the major determinant of acute respiratory distress syndrome (ARDS) leading to death. Reduced edema correlated with lung epithelia integrity and proper localization of Na+/K+ ATPase, which participates in edema resolution. Levels of inflammasome-activated IL-1β were reduced in the lung airways of the animals infected with viruses lacking E protein IC activity, indicating that E protein IC function is required for inflammasome activation. Reduction of IL-1β was accompanied by diminished amounts of TNF and IL-6 in the absence of E protein ion conductivity. All these key cytokines promote the progression of lung damage and ARDS pathology. In conclusion, E protein IC activity represents a new determinant for SARS-CoV virulence.


Conflict of interest statement

The authors have declared that no competing interests exist.

Figures

Figure 1
Figure 1. Engineering of rSARS-CoVs lacking E protein ion channel (IC) activity.
SARS-CoV genome is represented at the top, and the region expanded shows wild type SARS-CoV E protein sequence (wt) and its different domains: amino terminal (N-terminal), transmembrane (TMD) and carboxy terminal (C-terminal). To generate viruses lacking E protein ion channel activity (rSARS-CoV-EIC) the amino acid changes N15A or V25F were introduced within viral genome to generate two recombinant viruses. The positions of the mutated residues within the transmembrane domain of a simplified E protein oligomer inserted in a lipid membrane are shown at the bottom.
Figure 2
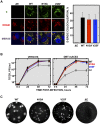
Figure 2. Subcellular localization of rSARS-CoV-EIC E proteins, growth kinetics and plaque size.
(A) Vero E6 cells were infected either with the mutant viruses (N15A and V25F), the parental virus (wt) or a virus lacking E gene (ΔE) at an MOI of 0.3, fixed at 24 hpi and E protein (green) and ERGIC (red) were labeled with specific antibodies. Nuclei were stained with DAPI (blue). Original magnification was 126×. Right graphic on the panel represents the percentage of colocalization between E protein and ERGIC, calculated with Leica LAS AF v2.6.0 software. (B) Vero E6 and DBT-mACE2 cells were infected at an MOI of 0.001 with mutant viruses lacking IC activity (N15A and V25F), the parental virus (wt) or a virus lacking E gene (ΔE), and viral progeny was titrated at the indicated times post-infection. Error bars represent the standard deviation of three independent experiments. (C) Plaque morphology of the parental, the mutant viruses N15A and V25F and a ΔE virus.
Figure 3
Figure 3. Effect of SARS-CoV E protein IC activity on viral fitness.
Competition assays between the parental virus (wt, black circles) displaying IC activity (EIC+) and a mutant virus (N15A, red squares) lacking IC activity (EIC) were performed. Vero E6 cells were co-infected with mutant and parental viruses at a ratio 7∶3 and supernatants were serially passaged 20 times every 24 hours. Relative abundance of each virus was determined by sequencing E gene within viral progeny. Error bars represent the standard deviation from three independent experiments.
Figure 4
Figure 4. Pathogenesis caused by rSARS-CoV-EIC in BALB/c mice.
Groups of five 16 week-old BALB/c mice were mock infected (Mock, green circles) or infected with 100000 PFU of either the parental virus (wt, black circles) or several clones of the mutant viruses missing IC activity: N15A C1, N15A C2 and N15A C3 (red, orange and deep-red squares, respectively), and V25F C1, V25F C2 and V25F C3 (dark blue, blue and light blue triangles, respectively). Mean weight losses (left graph) and survival (right graph) during 10 days following infection are represented for each group. Error bars represent the standard deviation for mice weights per experimental condition.
Figure 5
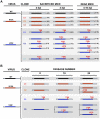
Figure 5. Stability of rSARS-CoV-EIC after serial infections.
(A) Groups of eleven 16 week-old BALB/c mice were infected with 100000 PFU of either the parental virus (wt) or three clones of the mutant viruses missing IC activity: N15A C1, N15A C2, N15A C3, V25F C1, V25F C2 and V25F C3. At 2 dpi and 4 dpi 3 mice of each group were sacrificed, lung RNA was extracted, and E gene was sequenced. The rest of the mice (5 per group) participated in the weight-loss and survival experiment. When any mouse died, from 4 to 10 dpi, lung RNA was extracted and E gene was sequenced. Bars represent different E protein sequences, either that of parental or the mutant viruses. The central colored part represents the transmembrane domain of the protein. Letters and numbers in red represent the amino acid changes detected after viral evolution and their relative position within transmembrane domain, respectively. Numbers accompanying bars indicate from how many mice (first number) out of the total of the animals analyzed (second number) arose the indicated sequence change. Dead mice are indicated by a †. (B) Vero E6 cells were infected with the wt virus or the mutant clones N15A C1 and N15A C2, V25F C1 and V25F C2 at an initial MOI of 0.5, and supernatants were serially passaged for 24 times every 24 hours. E gene in the viral population was sequenced at passages 0, 8, 16 and 24. Colored bars represent the transmembrane domain of different E protein sequences and letters and numbers in red represent the amino acid mutations identified and their relative position, respectively.
Figure 6
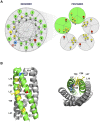
Figure 6. Spatial distribution of the mutations obtained in rSARS-CoV-EIC after serial infections.
(A) Left diagram represents a top view of E protein transmembrane domain and the spatial distribution of the amino acids within the alpha helix. Blue and red circles correspond to amino acids N15 and V25, respectively, originally mutated to inhibit IC activity. Yellow circles surround the amino acids that changed after evolution of V25F mutant. Arrow at position 15 points the lumen of the ion channel pore. Right graphic depicts the pentamer conformation of E protein that forms the ion conductive pore and the positions of both the mutated residue at position 25 and the evolved mutations at positions 19, 25, 26, 27, 30 and 37. Evolved changes map close to the originally mutated residue in the monomer-monomer interface. (B) Pentameric model of SARS-CoV E protein from a lateral (left) or a top view (right). This model was first proposed from linear dichroism of isotopically labeled E protein transmembrane peptides in lipid bilayers , . The residues involved in ion channel inhibition (N15 in blue and V25 in red) or mutated after viral evolution (L19, F26, L27, T30 and L37 in yellow) are highlighted.
Figure 7
Figure 7. E protein IC activity of the rSARS-CoV-EIC evolved variants.
Synthetic peptides representing E protein transmembrane domain of the parental virus (wt) the mutant viruses (MUT) lacking IC activity (N15A and V25F) and their evolved revertants (REV) obtained after infections of mice or cell culture (N15D, V25L, V25F L19A, V25F F26C, V25F L27S, V25F T30I and V25F L37R) were reconstituted in artificial lipid bilayers, and their IC activity was analyzed as mean conductance values. Negative controls (C) indicate conductance values obtained in the absence of any peptide. Error bars represent the variations obtained in 100 independent experiments.
Figure 8
Figure 8. Pathogenesis caused by rSARS-CoV-EICrev in BALB/c mice.
Groups of five 16 week-old BALB/c mice were mock infected (Mock, green circles) or infected with 100000 PFU of either the parental virus (wt, black circles) or the genetically engineered revertant viruses recovering IC activity: N15D (deep-red diamonds), V25F L27S (fuchsia triangles), V25F T30I (pink triangles) and V25F L37R (green triangles). Mean weight losses (left graph) and survival (right graph) during 10 days are represented for each group. Error bars represent the standard deviation for mice weights per experimental condition.
Figure 9
Figure 9. Effects of SARS-CoV E protein IC activity on virus growth in BALB/c mice lungs.
Groups of six 16 week-old BALB/c mice were infected with 100000 PFU of viruses displaying E protein IC activity (EIC+), either the parental virus (wt, black columns) or the genetically engineered revertant viruses V25F T30I (purple columns) and N15D (deep-red columns) or with the mutant lacking IC activity (EIC) N15A (red columns). At 2 and 4 days post infection (dpi) 3 mice from each group were sacrificed to determine virus titers.
Figure 10
Figure 10. SARS-CoV E protein IC activity and lung pathology.
Groups of six 16 week-old BALB/c mice were mock infected (Mock) or infected with 100000 PFU of viruses displaying E protein IC activity (EIC+), either the parental virus (wt) or the genetically engineered revertant viruses V25F T30I and N15D or with the mutant lacking IC activity (EIC) N15A. At 2 and 4 dpi 3 mice from each group were sacrificed and their lungs were collected. (A) Lungs were fixed in formalin, paraffin embedded, sectioned and processed for hematoxylin and eosin staining. Asterisks indicate edema accumulation in both bronchiolar and alveolar airways. Original magnification was 20×. (B) When collected and prior to fixation lungs were weighted. Error bars indicate the standard deviation from 3 mice lungs per each condition. Statistically significant data are indicated with an asterisk (Student's t-test p-value<0.05).
Figure 11
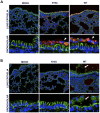
Figure 11. Lung epithelia disassembly in SARS-CoV infected BALB/c mice.
16 week-old BALB/c mice were mock infected (Mock) or infected with 100000 PFU of the parental virus (wt) displaying E protein IC activity or the mutant virus lacking IC activity N15A. At 2 (A) and 4 (B) dpi mice were sacrificed and their lungs were fixed in formalin, paraffin embedded, sectioned and processed for immunofluorescence. Na+/K+ ATPase was labeled in green, SARS-CoV N protein was labeled in red to detect infected cells and cell nuclei are shown in blue. A general view of lung epithelia at an original magnification of 40× is shown in the upper rows of the panels. Magnified bronchiolar epithelia at an original magnification of 189× are shown in the rows of the bottom. White arrowheads indicate cell desquamation in the bronchiolar barrier. White arrows show epithelium disassembly and mislocated Na+/K+ ATPase staining away from basolateral cell membranes, and present within air spaces.
Figure 12
Figure 12. SARS-CoV E protein IC activity and induction of inflammatory cytokines involved in lung injury.
Groups of six 16 week-old BALB/c mice were mock infected or infected with 100000 PFU of the parental virus (wt) displaying E protein IC activity or the mutant virus lacking IC activity N15A. At 2 dpi 3 mice from each group were sacrificed and their lungs were collected. (A) Total RNA was extracted and levels of pro-IL-1β mRNA, and 18s rRNA (18S), as a control, were analyzed by RT-qPCR. Error bars indicate the standard deviation from samples of 3 mice per experimental setting. (B) Lung protein extracts were prepared and levels of inactive pro-IL-1β (35 kDa) and beta-actin, as a loading control, were detected by Western blot and quantified by densitometry analysis. Bottom of the figure represents the ratio pro-IL-1β/beta-actin relative to the mock-infected animals levels, as a reference. Bronchoalveolar lavages (BAL) of infected mice were collected and the concentration of (C) the active form of IL-1β protein at 2 dpi, (D) TNF protein at 2 dpi and (E) IL-6 protein at 2 and 4 dpi within the lavages were determined using the Luminex technology. Error bars indicate the standard deviation from samples of 3 mice per condition. Discontinuous lines indicate the limit of the detection of the technique. Statistically significant data are indicated with an asterisk (Student's t-test p-value<0.05).

Similar articles

Cited by

References

    1. Perlman S, Netland J (2009) Coronaviruses post-SARS: update on replication and pathogenesis. Nat Rev Microbiol 7: 439–450. - PMC - PubMed
    1. Rota PA, Oberste MS, Monroe SS, Nix WA, Campganoli R, et al. (2003) Characterization of a novel coronavirus associated with severe acute respiratory syndrome. Science 300: 1394–1399. - PubMed
    1. Drosten C, Gunther S, Preiser W, van der Werf S, Brodt HR, et al. (2003) Identification of a novel coronavirus in patients with severe acute respiratory syndrome. N Engl J Med 348: 1967–1976. - PubMed
    1. Pyrc K, Berkhout B, van der Hoek L (2007) The novel human coronaviruses NL63 and HKU1. J Virol 81: 3051–3057. - PMC - PubMed
    1. Zaki AM, van Boheemen S, Bestebroer TM, Osterhaus AD, Fouchier RA (2012) Isolation of a novel coronavirus from a man with pneumonia in Saudi Arabia. N Engl J Med 367: 1814–1820. - PubMed

Publication types

MeSH terms