Impact of artifact removal on ChIP quality metrics in ChIP-seq and ChIP-exo data
- PMID: 24782889
- PMCID: PMC3989762
- DOI: 10.3389/fgene.2014.00075
Impact of artifact removal on ChIP quality metrics in ChIP-seq and ChIP-exo data
Abstract
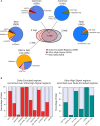
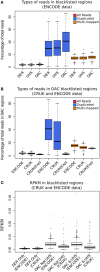
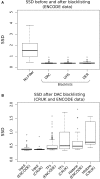
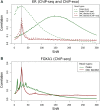
With the advent of ChIP-seq multiplexing technologies and the subsequent increase in ChIP-seq throughput, the development of working standards for the quality assessment of ChIP-seq studies has received significant attention. The ENCODE consortium's large scale analysis of transcription factor binding and epigenetic marks as well as concordant work on ChIP-seq by other laboratories has established a new generation of ChIP-seq quality control measures. The use of these metrics alongside common processing steps has however not been evaluated. In this study, we investigate the effects of blacklisting and removal of duplicated reads on established metrics of ChIP-seq quality and show that the interpretation of these metrics is highly dependent on the ChIP-seq preprocessing steps applied. Further to this we perform the first investigation of the use of these metrics for ChIP-exo data and make recommendations for the adaptation of the NSC statistic to allow for the assessment of ChIP-exo efficiency.
Keywords: ChIP-exo; ChIP-seq; QC; blacklist; duplicates.
Figures


Similar articles
-
PeakPass: Automating ChIP-Seq Blacklist Creation.J Comput Biol. 2020 Feb;27(2):259-268. doi: 10.1089/cmb.2019.0295. Epub 2019 Dec 18. J Comput Biol. 2020. PMID: 31855064
-
Data exploration, quality control and statistical analysis of ChIP-exo/nexus experiments.Nucleic Acids Res. 2017 Sep 6;45(15):e145. doi: 10.1093/nar/gkx594. Nucleic Acids Res. 2017. PMID: 28911122 Free PMC article.
-
Detrimental effects of duplicate reads and low complexity regions on RNA- and ChIP-seq data.BMC Bioinformatics. 2015;16 Suppl 13(Suppl 13):S10. doi: 10.1186/1471-2105-16-S13-S10. Epub 2015 Sep 25. BMC Bioinformatics. 2015. PMID: 26423047 Free PMC article.
-
Role of ChIP-seq in the discovery of transcription factor binding sites, differential gene regulation mechanism, epigenetic marks and beyond.Cell Cycle. 2014;13(18):2847-52. doi: 10.4161/15384101.2014.949201. Cell Cycle. 2014. PMID: 25486472 Free PMC article. Review.
-
Genome Wide Approaches to Identify Protein-DNA Interactions.Curr Med Chem. 2019;26(42):7641-7654. doi: 10.2174/0929867325666180530115711. Curr Med Chem. 2019. PMID: 29848263 Review.
Cited by
-
TbsP and TrmB jointly regulate gapII to influence cell development phenotypes in the archaeon Haloferax volcanii.Mol Microbiol. 2024 Apr;121(4):742-766. doi: 10.1111/mmi.15225. Epub 2024 Jan 11. Mol Microbiol. 2024. PMID: 38204420
-
Locus folding mechanisms determine modes of antigen receptor gene assembly.J Exp Med. 2024 Feb 5;221(2):e20230985. doi: 10.1084/jem.20230985. Epub 2024 Jan 8. J Exp Med. 2024. PMID: 38189780 Free PMC article.
-
Integrative Epigenome Map of the Normal Human Prostate Provides Insights Into Prostate Cancer Predisposition.Front Cell Dev Biol. 2021 Aug 26;9:723676. doi: 10.3389/fcell.2021.723676. eCollection 2021. Front Cell Dev Biol. 2021. PMID: 34513844 Free PMC article.
-
Engrailed 1 coordinates cytoskeletal reorganization to induce myofibroblast differentiation.J Exp Med. 2021 Sep 6;218(9):e20201916. doi: 10.1084/jem.20201916. Epub 2021 Jul 14. J Exp Med. 2021. PMID: 34259830 Free PMC article.
-
Ritornello: high fidelity control-free chromatin immunoprecipitation peak calling.Nucleic Acids Res. 2017 Dec 1;45(21):e173. doi: 10.1093/nar/gkx799. Nucleic Acids Res. 2017. PMID: 28981893 Free PMC article.
References
Grants and funding
LinkOut - more resources
Full Text Sources
Other Literature Sources

