. 2014 Jul 15;391(2):230-40.
doi: 10.1016/j.ydbio.2014.04.005. Epub 2014 Apr 26.

Huntingtin protein is essential for mitochondrial metabolism, bioenergetics and structure in murine embryonic stem cells

Affiliations

Huntingtin protein is essential for mitochondrial metabolism, bioenergetics and structure in murine embryonic stem cells

Ismail Ismailoglu et al. Dev Biol. .

Abstract

Mutations in the Huntington locus (htt) have devastating consequences. Gain-of-poly-Q repeats in Htt protein causes Huntington's disease (HD), while htt(-/-) mutants display early embryonic lethality. Despite its importance, the function of Htt remains elusive. To address this, we compared more than 3700 compounds in three syngeneic mouse embryonic stem cell (mESC) lines: htt(-/-), extended poly-Q (Htt-Q140/7), and wild-type mESCs (Htt-Q7/7) using untargeted metabolite profiling. While Htt-Q140/7 cells did not show major differences in cellular bioenergetics, we find extensive metabolic aberrations in htt(-/-) mESCs, including (i) complete failure of ATP production despite preservation of the mitochondrial membrane potential; (ii) near-maximal glycolysis, with little or no glycolytic reserve; (iii) marked ketogenesis; (iv) depletion of intracellular NTPs; (v) accelerated purine biosynthesis and salvage; and (vi) loss of mitochondrial structural integrity. Together, our findings reveal that Htt is necessary for mitochondrial structure and function from the earliest stages of embryogenesis, providing a molecular explanation for htt(-/-) early embryonic lethality.

Keywords: AMP kinase; Embryonic stem cells; Glycolysis; Huntington׳s Disease; LC-MS/MS; Metabolism; Metabolomics; Mitochondria; Mitochondrial bioenergetics; Mitochondrial respiration; Oxygen consumption; Untargeted metabolite profiling.


Figures

Figure 1
Figure 1
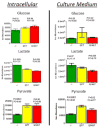
Measurement of relative levels of glucose, lactate and pyruvate in cells and cell culture medium indicates an increased rate of glycolysis in htt-/- mESCs, but no significant effect of Htt-Q140/7 mutation. Bars depict relative ion abundances measured by LC-MS for the indicated metabolites, measured both in cells (left panels) and in culture media (right panels). Observed fold-changes and p-values are quantified for htt-/- mESC (green bars) and Htt-Q140/7 mutant mESC (red bars), in comparison with wildtype Htt-Q7/7 mESC (yellow bars). Error bars are SEM.
Figure 2
Figure 2
High-energy nucleotide triphosphate levels are significantly decreased in htt-/- mESCs and nucleotide di- and mono-phosphate levels are significantly increased, as compared with Htt-Q7/7 control mESC. In contrast, Htt-Q140/7 mutation does not alter the levels of nucleotide Tri-, di- or mono-phosphates. Results are mean values +/- SD (n = 9-10). * Denotes a significant difference with p<0.05.
Figure 3
Figure 3
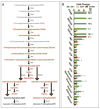
There is a marked intracellular accumulation of metabolites of de novo purine biosynthesis and purine salvage pathways in htt-/- compared with Htt-Q7/7 wildtype and Htt-Q140/7 mutant mESCs. The colors of fonts denote metabolites in htt-/- mESC with abundances that are significantly increased (red), decreased (blue), unchanged (black) and undetected (grey), in comparison with Htt-Q7/7 mESC. For each observed change, the measured p-values and fold-changes are given. * Denotes a significant difference with p<0.05. The nomenclature for labeling of metabolic enzymes (names given adjacent to pathway arrows) is from the Kyoto Encyclopedia of Genes and Genomes (KEGG) pathway map. Abbreviations: PPAT, Phosphoribosyl Pyrophosphate Amidotransferase; GART, Phosphoribosylglycinamide Formyltransferase; PFAS, Phosphoribosylformylglycinamidine Synthase; PAICS, Phosphoribosylaminoimidazole Carboxylase; ADSL, Adenylosuccinate Lyase; ATIC, 5-Aminoimidazole-4-Carboxamide Ribonucleotide Formyltransferase; GMPS, Guanine Monphosphate Synthetase; GUK, Guanylate Kinase; NME, Nucleoside Diphosphate Kinase; 5′-NT, 5′-Nucleotidase; PNP, Purine Nucleoside Phosphorylase; AMPD, Adenosine Monophosphate Deaminase; AK1, Adenylate Kinase 1; NME7, NME/NM23 Family Member 7.
Figure 4
Figure 4
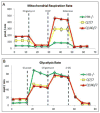
Influence of htt-/- and Htt-Q140/7 mutations on mitochondrial and glycolytic fluxes in mESCs. (A) Mitochondrial ATP synthesis rate, based on oligomycin-inhibited oxygen consumption rate (OCR). At the indicated time, oligomycin was added to reveal the extent to which oxygen is being consumed for ATP synthesis. FCCP, an uncoupler of mitochondrial respiration was subsequently added to define the maximal capacity of cells for mitochondrial respiration. Finally, the combination of rotenone and antimycin was added to elucidate total mitochondrial oxygen consumption. Results demonstrated that ATP synthesis and synthetic capacity are dramatically impaired in htt-/- mESC, while ATP production rate and capacity are relatively increased in Htt-Q140/7 cells. (B) Glycolysis rate, based on glucose-dependent extracellular acidification rate (ECAR). Initially, cells are in glucose-free medium, followed by addition of glucose at the indicated time. Oligomycin is subsequently added to block mitochondrial respiration and reveal the glycolytic reserve capacity (i.e., maximal rate of glycolysis). Finally, an inhibitor of glycolysis, 2-deoxyglucose (2-DG), is added to ascertain the extent to which OCR derives from glycolysis. These results demonstrate that htt-/- mESC conduct glycolysis at a near-maximal rate for energy production. In both panels, points depict mean values for 8 replicate determinations +/- SEM.
Figure 5
Figure 5
Mitochondrial EM structure is profoundly aberrant in htt-/-, relative to Htt-Q7/7 mESCs, whereas neither mitochondrial abundance nor membrane potential is significantly affected. (A-F) EM images at 15000X (top panels), and 60000X (bottom panels) comparing htt-/-(A-B), Htt-Q7/7 (C-D), and Htt-Q140/7 (E-F) mESC. Results reveal profound structural aberrations in htt-/- mESC, indicative of loss of inner membrane cristae. Scale bars are shown at lower right. (G) Counts from EM images of healthy (Good) and unhealthy (Poor) mitochondria show htt-/- mESC have more poor quality mitochondria. Mitochondria were counted in a blind manner. Error bars are standard deviation. (H) Relative mitochondrial abundance in htt-/- and Htt-Q140/7 mESCs, compared with wildtype Htt-Q7/7 mESCs, expressed on a per cell basis. Selective staining with MitoTracker red fluorescent dye, followed by FACS analysis was used to assess relative mitochondria abundance. Fluorescence values are given as mean values +/- SD. Notably, MitoTracker fluorescence was indistinguishable for all three htt mESC lines tested. (I) Equivalent mitochondrial abundance is shown by western blot analysis of whole cell lysate of htt-/-, Htt-Q7/7, and Htt-Q140/7 for the micochondrial protein VDAC1, Cytochrome b-c1 subunit RISP, and Cytochrome c. Equal amounts of protein were loaded and Actin were used controls. (J) Mitochondria from htt-/- mESC are polarized like mitochondria from Htt-Q7/7 and Htt-Q140/7 mESCs. FACS analysis assessed mitochondria potential after staining htt-/-, Htt-Q140/7 and Htt-Q7/7 mESCs with the mitochondrial voltage-sensitive fluorescent dye, JC-1. Negative control with the mitochondrial uncoupling agent CCCP depicts fluorescence spectral changes that occur when the mitochondrial potential was eliminated. Notably, JC-1 fluorescence results reveal polarization of mitochondria in all 3 htt lines. (K) Mitochondria from htt-/- mESC are polarized like mitochondria from Htt-Q7/7 and Htt-Q140/7 mESCs. FACS analysis assessed mitochondria potential after staining htt-/-, Htt-Q140/7 and Htt-Q7/7 mESCs with the mitochondrial voltage-sensitive fluorescent dye, TMRE. (L) The ratio of polarization to the number of mitochondria is roughly equivalent between htt-/-, Htt-Q7/7 and Htt-Q140/7. Intensity levels of TMRE were divided by the intensity levels of MitoTracker.
Figure 6
Figure 6
Schematic depicting two alternative models that may explain the existence of a mitochondrial inner membrane potential in htt-/- mESC, despite a lack of mitochondrial ATP generation by these cells. The two models are distinguished as arising via either a mitochondria autonomous mechanism, wherein the respiratory complexes generate a proton gradient, but ATP synthase is unable to effectively use this proton gradient for ATP production (left panel), or arising via a mitochondria non-autonomous mechanism, wherein glycolysis-generated ATP serves to drive mitochondrial ATP synthase in reverse, resulting in a proton gradient at the expense of glycolysis-derived ATP (right panel). Details of these models are considered in the text (Adapted from Takeda et al, 2004).

Similar articles

Cited by

References

    1. Duyao MP, Auerbach AB, Ryan A, Persichetti F, Barnes GT, McNeil SM, Ge P, Vonsattel JP, Gusella JF, Joyner AL. Inactivation of the mouse Huntington's disease gene homolog Hdh. Science. 1995 Jul;269(no. 5222):407–410. - PubMed
    1. Woda JM, Calzonetti T, Hilditch-Maguire P, Duyao MP, Conlon RA, MacDonald ME. Inactivation of the Huntington's disease gene (Hdh) impairs anterior streak formation and early patterning of the mouse embryo. BMCDev Biol. 2005;5:17. - PMC - PubMed
    1. Jacobsen JC, Gregory GC, Woda JM, Thompson MN, Coser KR, Murthy V, Kohane IS, Gusella JF, Seong IS, MacDonald ME, Shioda T, Lee JM. HD CAG-correlated gene expression changes support a simple dominant gain of function. Hum Mol Genet. 2011 Jul;20(no. 14):2846–2860. - PMC - PubMed
    1. Reiner A, Albin RL, Anderson KD, D'Amato CJ, Penney JB, Young AB. Differential loss of striatal projection neurons in Huntington disease. Proc Natl Acad Sci U S A. 1988 Aug;85(no. 15):5733–5737. - PMC - PubMed
    1. Tabrizi SJ, Scahill RI, Durr A, Roos RA, Leavitt BR, Jones R, Landwehrmeyer GB, Fox NC, Johnson H, Hicks SL, Kennard C, Craufurd D, Frost C, Langbehn DR, Reilmann R, Stout JC, TRACK-HD Investigators Biological and clinical changes in premanifest and early stage Huntington's disease in the TRACK-HD study: the 12-month longitudinal analysis. Lancet Neurol. 2011 Jan;10(no. 1):31–42. - PubMed

Publication types

MeSH terms