Epithelial microvilli establish an electrostatic barrier to microbial adhesion
- PMID: 24778113
- PMCID: PMC4097645
- DOI: 10.1128/IAI.01681-14
Epithelial microvilli establish an electrostatic barrier to microbial adhesion
Abstract
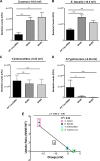
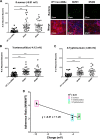
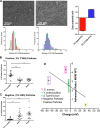
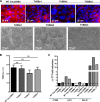
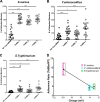
Microvilli are membrane extensions on the apical surface of polarized epithelia, such as intestinal enterocytes and tubule and duct epithelia. One notable exception in mucosal epithelia is M cells, which are specialized for capturing luminal microbial particles; M cells display a unique apical membrane lacking microvilli. Based on studies of M cell uptake under different ionic conditions, we hypothesized that microvilli may augment the mucosal barrier by providing an increased surface charge density from the increased membrane surface and associated glycoproteins. Thus, electrostatic charges may repel microbes from epithelial cells bearing microvilli, while M cells are more susceptible to microbial adhesion. To test the role of microvilli in bacterial adhesion and uptake, we developed polarized intestinal epithelial cells with reduced microvilli ("microvillus-minus," or MVM) but retaining normal tight junctions. When tested for interactions with microbial particles in suspension, MVM cells showed greatly enhanced adhesion and uptake of particles compared to microvillus-positive cells. This preference showed a linear relationship to bacterial surface charge, suggesting that microvilli resist binding of microbes by using electrostatic repulsion. Moreover, this predicts that pathogen modification of electrostatic forces may contribute directly to virulence. Accordingly, the effacement effector protein Tir from enterohemorrhagic Escherichia coli O157:H7 expressed in epithelial cells induced a loss of microvilli with consequent enhanced microbial binding. These results provide a new context for microvillus function in the host-pathogen relationship, based on electrostatic interactions.
Copyright © 2014, American Society for Microbiology. All Rights Reserved.
Figures



Similar articles
-
Remodeling of the intestinal brush border underlies adhesion and virulence of an enteric pathogen.mBio. 2014 Aug 19;5(4):e01639-14. doi: 10.1128/mBio.01639-14. mBio. 2014. PMID: 25139905 Free PMC article.
-
Intestinal adherence associated with type IV pili of enterohemorrhagic Escherichia coli O157:H7.J Clin Invest. 2007 Nov;117(11):3519-29. doi: 10.1172/JCI30727. J Clin Invest. 2007. PMID: 17948128 Free PMC article.
-
Electrostatic properties of confluent Caco-2 cell layer correlates to their microvilli growth and determines underlying transcellular flow.Biotechnol Bioeng. 2013 Oct;110(10):2742-8. doi: 10.1002/bit.24939. Epub 2013 Jun 27. Biotechnol Bioeng. 2013. PMID: 23613195
-
Exploitation of host cells by enteropathogenic Escherichia coli.Proc Natl Acad Sci U S A. 2000 Aug 1;97(16):8799-806. doi: 10.1073/pnas.97.16.8799. Proc Natl Acad Sci U S A. 2000. PMID: 10922038 Free PMC article. Review.
-
Attaching effacing Escherichia coli and paradigms of Tir-triggered actin polymerization: getting off the pedestal.Cell Microbiol. 2008 Mar;10(3):549-56. doi: 10.1111/j.1462-5822.2007.01103.x. Epub 2007 Dec 4. Cell Microbiol. 2008. PMID: 18053003 Review.
Cited by
-
M Cells: Intelligent Engineering of Mucosal Immune Surveillance.Front Immunol. 2019 Jul 2;10:1499. doi: 10.3389/fimmu.2019.01499. eCollection 2019. Front Immunol. 2019. PMID: 31312204 Free PMC article. Review.
-
Induction of Colonic M Cells during Intestinal Inflammation.Am J Pathol. 2016 May;186(5):1166-79. doi: 10.1016/j.ajpath.2015.12.015. Epub 2016 Mar 3. Am J Pathol. 2016. PMID: 26948422 Free PMC article.
-
Intestinal permeability in the pathogenesis of liver damage: From non-alcoholic fatty liver disease to liver transplantation.World J Gastroenterol. 2019 Sep 7;25(33):4814-4834. doi: 10.3748/wjg.v25.i33.4814. World J Gastroenterol. 2019. PMID: 31543676 Free PMC article. Review.
-
Liver Steatosis, Gut-Liver Axis, Microbiome and Environmental Factors. A Never-Ending Bidirectional Cross-Talk.J Clin Med. 2020 Aug 14;9(8):2648. doi: 10.3390/jcm9082648. J Clin Med. 2020. PMID: 32823983 Free PMC article. Review.
-
Intestinal Barrier and Permeability in Health, Obesity and NAFLD.Biomedicines. 2021 Dec 31;10(1):83. doi: 10.3390/biomedicines10010083. Biomedicines. 2021. PMID: 35052763 Free PMC article. Review.
References
-
- Fallingborg J. 1999. Intraluminal pH of the human gastrointestinal tract. Dan. Med. Bull. 46:183–196 - PubMed
Publication types
MeSH terms
Substances
Grants and funding
LinkOut - more resources
Full Text Sources
Other Literature Sources

