. 2014 Apr 22;7(322):ra37.
doi: 10.1126/scisignal.2004872.

Nuclear envelope lamin-A couples actin dynamics with immunological synapse architecture and T cell activation

Affiliations

Nuclear envelope lamin-A couples actin dynamics with immunological synapse architecture and T cell activation

José María González-Granado et al. Sci Signal. .

Abstract

In many cell types, nuclear A-type lamins regulate multiple cellular functions, including higher-order genome organization, DNA replication and repair, gene transcription, and signal transduction; however, their role in specialized immune cells remains largely unexplored. We showed that the abundance of A-type lamins was almost negligible in resting naïve T lymphocytes, but was increased upon activation of the T cell receptor (TCR). The increase in lamin-A was an early event that accelerated formation of the immunological synapse between T cells and antigen-presenting cells. Polymerization of F-actin in T cells is a critical step for immunological synapse formation, and lamin-A interacted with the linker of nucleoskeleton and cytoskeleton (LINC) complex to promote F-actin polymerization. We also showed that lamin-A expression accelerated TCR clustering and led to enhanced downstream signaling, including extracellular signal-regulated kinase 1/2 (ERK1/2) signaling, as well as increased target gene expression. Pharmacological inhibition of the ERK pathway reduced lamin-A-dependent T cell activation. Moreover, mice lacking lamin-A in immune cells exhibited impaired T cell responses in vivo. These findings underscore the importance of A-type lamins for TCR activation and identify lamin-A as a previously unappreciated regulator of the immune response.


Figures
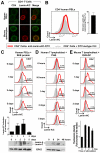
Fig. 1
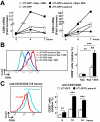
Fig. 1. A-type lamins are increased in abundance upon T cell activation
(A) Human CD4+ PBLs and mouse splenocytes were incubated with antibodies specific for lamin-A/C (red) and CD4 (green) and then were analyzed by confocal microscopy. A single confocal plane is shown. (B) Human PBLs were incubated with antibodies specific for CD4 and lamin-A/C and then were analyzed by flow cytometry. Cells stained with isotype control antibody were used as negative control (gray). The graph shows quantification of the percentage of CD4+ T cells that have lamin-A/C. Data are means ± SEM from five donors. (C to E) Time course of the increase in lamin-A/C abundance in CD4+ PBLs and T lymphoblasts. (C) SEE-treated human PBLs were analyzed by flow cytometry and Western blot. Top: representative flow cytometry histograms. Middle: Quantification of flow cytometry histograms. Bottom: representative Western blot. (D) Phytohemagglutinin (PHA)-treated human T lymphoblasts were analyzed by flow cytometry and Western blot. Top: representative flow cytometry histograms. Bottom: representative Western blot. (E) T lymphoblasts from OTII transgenic mice were stimulated with OVA-loaded DCs and analyzed by flow cytometry. Top: representative flow cytometry histograms. Bottom: quantification of flow cytometry histograms. Hstograms of cells stained with isotype control are filled in gray. Graphs show the fold increase in the abundance in lamin-A/C with respect to the quantity at day 0 before stimulation. Data are means ± SEM from three to five donors.
Fig. 2
Fig. 2. Loss of A-type lamins impairs T cell activation in vitro and in vivo
(A) Wild-type (WT) and Lmna−/− splenocytes were unstimulated or stimulated for 2 hours with anti-CD3 and anti-CD28 antibodies, PMA and ionomycin (PMA+Iono), or concanavalin A and then were analyzed by quantitative PCR to determine their relative amounts of Cd25 mRNA. The graphs show the amount of mRNA relative to that in wild-type cells without stimulation and are means ± SEM from three independent experiments, analyzed by one-way ANOVA. (B) CD4+ splenocytes isolated from pools of two to nine Lmna−/− ) or WT mice were stimulated with anti-CD3 and anti-CD28 antibodies for 24 hours and then were analyzed by flow cytometry to determine the cell-surface abundances of CD69 and CD25. The graphs show the percentages of CD25+ or CD69+ cells relative to those among wild-type cells and are means ± SEM from three independent experiments. Representative histograms of CD25 or CD69 staining are shown. (C) CD4+ splenocytes isolated from pools of three to nine OTII Lmna−/− or OTII WT mice were stimulated with either non-loaded or OVA peptide-loaded DCs for 24 hours, and then were analyzed by flow cytometry to determine cell-surface CD25 abundance. The graph shows the percentages of CD25+ cells relative to those among wild-type cells and are means ± SEM from three independent experiments. Representative histograms of CD25 staining are shown. (D) Measurement of the contact hypersensitivity response to oxalazone in the ears of lethally-irradiated WT recipient mice that were reconstituted with bone marrow cells from WT or Lmna−/− mice. Data represent the extent of ear swelling in 10 mice of each group and are means ± SEM, analyzed by two-way ANOVA. (E) CD4+ T-cells from CD45.2+ WT and CD45.2+ Lmna−/− mice were isolated and adoptively transferred into different groups of CD45.1+ WT mice before the first application of oxazolone. Three days after the second application, the percentages of transferred CD45.2+CD4+ T cells relative to the recipient CD45.1+CD4+ T cells in the ears were quantified by flow cytometry. Data are means ± SEM from six to seven mice. (F) CD4+ T-cells from CD45.2+CD45.1+ WT and CD45.2+ Lmna−/− mice were isolated, mixed at a 1:1 ratio, and adoptively transferred to CD45.1+ WT mice before the application of oxazolone. Left histogram shows a representative experiment with the proportions of CD45.2+ and CD45.1+CD45.2+ cells that were adoptively transferred. Three days after the second application of oxazolone, the percentages of CD45.2+ Lmna−/− and CD45.1+CD45.2+ WT CD4+ T cells relative to the total number of CD4+CD45.2+ T cells in the ears, draining lymph nodes, and spleens were quantified by flow cytometry, as shown in the representative histograms. Data are means ± SEM from eight mice.
Fig. 3
Fig. 3. Lamin-A enhances the activation of human J77 cells
(A) J77 cells stably expressing GFP (J77-GFP) or GFP-Lamin-A (J77-GFP-Lamin-A) were incubated with either unloaded Raji cells or SEE-loaded Raji cells for the indicated times before being subjected to quantitative PCR analysis to determine the relative amounts of CD69 and CD25 mRNAs. (B) J77-GFP or J77-GFP-Lamin-A cells were stimulated with either unloaded Raji cells or SEE-loaded Raji cells for 16 hours and then were analyzed by flow cytometry to determine the cell-surface abundance of CD69. Histograms show a representative experiment. The graph shows the percentages of CD69+ cells in the indicated conditions relative to those among J77-GFP cells conjugated with unloaded Raji cells and are means ± SEM from three independent experiments, analyzed by one-way ANOVA. (C) J77-GFP or J77-GFP-Lamin-A cells were stimulated for 6, 18, or 24 hours with anti-CD3 and anti-CD28 antibodies and then were analyzed by flow cytometry to determine the cell-surface abundance of CD69. The histogram shows a representative experiment at 18 hours, and the graph shows fold changes in the percentage of CD69+ cells at the indicated times relative to the percentage of J77-GFP cells that were CD69+ after stimulation with anti-CD3 and anti-CD28 antibodies for 6 hours. Data are means ± SEM from three independent experiments and were analyzed by two-way ANOVA.
Fig. 4
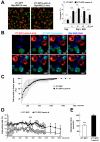
Fig. 4. Lamin-A modulates the dynamics of human J77 cell-Raji cell interactions
(A) J77-GFP or J77-GFP-Lamin-A cells were incubated with CMAC-labeled, unloaded or SEE-loaded Raji cells , incubated with an anti-α-tubulin antibody, and then analyzed by confocal microscopy. Representative images are of cell conjugates formed after 5 min. Raji cells are in red, whereas staining with the anti-α-tubulin antibody is in green. A single confocal plane is shown. Graph shows the percentages of cell conjugates at the indicated times. Data are means ± SEM of 300 to 500 conjugates from two independent experiments and were analyzed by two-way ANOVA. (B to E) J77-GFP cells (cyan and green) and J77-GFP-Lamin-A cells (red) were mixed in equal amounts and added onto SEE-loaded Raji cells (dark blue) that had been plated onto PLL-coated coverslips. (B) Representative confocal video microscopy images of the conjugation of J77-GFP cells or J77-GFP-Lamin-A cells with SEE-loaded Raji cells at the indicated times. A single confocal plane is shown. (C) Percentages of cells that arrived at the focal plane by the indicated time frame. (D) Percentages of the indicated J77 cells that formed conjugates with Raji cells over time. Data are means ± SEM from thee independent experiments, and were analyzed by two-way ANOVA. (E) Duration of the interactions between the indicated J77 cells and Raji cells. Data are means ± SEM from three independent experiments.
Fig. 5
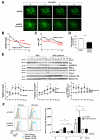
Fig. 5. Lamin-A is required for optimal movement of TCR-CD3 complexes within the plasma membrane and TCR-dependent signaling
J77 cells were co-transfected with plasmids encoding CD3ζ-EGFP and either dsRED or dsRED-Lamin-A, sorted by flow cytometry on the basis of the detection of dsRED and GFP, plated onto anti-CD3 antibody-coated coverslips, and analyzed by TIRF microscopy at a penetration depth of ~90 nm. (A) Representative TIRF microscopy images of CD3ζ-EGFP at the indicated times. (B to D) The graphs show (B) the number of microclusters at each time point, (C) the area of the cSMAC at each time point, and (D) the duration of the tracks of each CD3 microcluster at the plasma membrane. Data are means ± SEM of 10 to 13 cells of each condition from three independent experiments. (E) J77-GFP and J77-GFP-lamin-A cells were allowed to form conjugates with SEE-loaded Raji cells for the indicated times before being lysed and analyzed by Western blotting to detect total and phosphorylated forms of Vav, ERK1/2, PLC-γ1, and myosin IIA. MW: Molecular weight marker. Representative blots are shown. Graphs show quantification of the ratios of phosphorylated to total proteins and are means ± SEM from three independent experiments. (F) J77-GFP or J77-GFP-lamin-A cells were allowed to form conjugates with unloaded (time 0) or SEE-loaded Raji cells for the indicated times in the presence or absence of the MEK1/2 inhibitor U0126. Cells were then incubated with antibody against CD69 and analyzed by flow cytometry. Histograms show a representative experiment. Graph shows the fold-change in the cell-surface abundance of CD69 in the indicated cells relative to that in J77-GFP cells incubated with unloaded Raji cells. Data are means ± SEM from three independent experiments, and were analyzed by one-way ANOVA.
Fig. 6
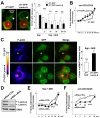
Fig. 6. A-type lamins promote MTOC translocation and F-actin polymerization in activated T cells
(A) J77-GFP and J77-GFP-lamin-A cells were allowed to form conjugates with CMAC-labeled, unloaded or SEE-loaded Raji cells (red) for the indicated times before they were stained with an anti-α-tubulin antibody and analyzed by confocal microscopy. Representative images are of cell conjugates at 5 min. Tubulin is in green, arrowheads point to the MTOC, and asterisks indicate Raji cells. A single confocal plane is shown. The graph shows quantification of the distance (in μm) between the MTOC and the J77 cell–Raji cell contact area at the indicated times after conjugate formation. Data are means ± SEM of at least 300 conjugates from three independent experiments and were analyzed by two-way ANOVA. (B) J77-GFP (white) and J77-GFP-lamin-A (black) cells were stimulated with coated anti-CD3 antibody and soluble anti-CD28 antibody, stained for phalloidin, and analyzed by flow cytometry. Data represent the fold change in the extent of F-actin polymerization relative to that in J77-GFP cells without antibodies at time zero. Data are means ± SEM from three independent experiments and were analyzed by two-way ANOVA. (C) J77-GFP and J77-GFP-lamin-A cells conjugated with SEE-loaded Raji cells were stained with phalloidin to detect F-actin and were analyzed by confocal microscopy. Representative projections of confocal stack images are shown in which F-actin staining is depicted in pseudocolor intensity-coding format (maximum intensity is white), GFP is in green, and merged images depict GFP in green and F-actin staining in red. White asterisks indicate Raji cells. Right graph shows the amount of F-actin accumulation at the immunological synapse. Data are means ± SEM of 200 conjugates from three independent experiments. (D) Western blotting analysis of human T lymphoblasts transfected with control siRNA (siRNA-CTRL) or lamin-A/C-specific siRNA (siRNA-LMNA). (E and F) Human T lymphoblasts transfected with siRNA-CTRL or siRNA-LMNA were stimulated with (E) SEE-loaded Raji cells or (F) anti-CD3 and anti-CD28 antibodies for the indicated times, stained for F-actin, and then analyzed by flow cytometry. Data represent fold-changes in the amount of F-actin polymerization relative to that in (E) siRNA-CTRL-treated cells incubated with unloaded Raji B cells or (F) T lymphoblasts that were not stimulated with antibodies. Data are means ± SEM from three independent experiments and were analyzed by two-way ANOVA.
Fig. 7
Fig. 7. The lamin-A–mediated increase in the extent of T cell activation requires a physical connection between the nucleus and the cytoskeleton through the LINC complex
(A) J77-GFP and J77-GFP-lamin-A cells expressing Cherry or a Cherry-tagged dominant negative form of the nesprin KASH domain (DN KASH) were conjugated for 16 hours with SEE-loaded Raji cells, incubated with antibody for CD69, and analyzed by flow cytometry. Histograms show a representative experiment. Right graph represents the fold increase in the percentage of CD69+ cells with respect to the GFP+ Cherry-expressing cells (first bar). (B) J77-GFP-lamin-A cells expressing DN KASH (black) or Cherry (white) were conjugated with SEE-loaded Raji cells for the indicated times, fixed, permeabilized, stained for F-actin, and then analyzed by flow cytometry. Data are the fold-change in F-actin content with respect to that in Cherry-expressing cells in the absence of SEE-loaded Raji cells (0 min). Data are means ± SEM from three independent experiments and were analyzed by two-way ANOVA. (C) J77-GFP-lamin-A cells expressing Cherry (white) or Cherry and DN SUN (black) were incubated with SEE-loaded Raji cells for the indicated times, fixed, permeabilized, stained for F-actin, and then analyzed by flow cytometry. Data are the fold-change in F-actin content in the indicated cells relative to that in Cherry-expressing cells in the absence of SEE-loaded Raji cells (0 min). Data in (A) and (B) are means ± SEM from three independent experiments and were analyzed by two-way ANOVA.

Comment in

Similar articles

Cited by

References

    1. Andrés V, González JM. Role of A-type lamins in signaling, transcription, and chromatin organization. J Cell Biol. 2009;187:945–957. - PMC - PubMed
    1. Broers JL, Ramaekers FC, Bonne G, Yaou RB, Hutchison CJ. Nuclear lamins: laminopathies and their role in premature ageing. Physiol Rev. 2006;86:967–1008. - PubMed
    1. Houben F, Willems CH, Declercq IL, Hochstenbach K, Kamps MA, Snoeckx LH, Ramaekers FC, Broers JL. Disturbed nuclear orientation and cellular migration in A-type lamin deficient cells. Biochim Biophys Acta. 2009;1793:312–324. - PubMed
    1. Starr DA, Fridolfsson HN. Interactions between nuclei and the cytoskeleton are mediated by SUN-KASH nuclear-envelope bridges. Annu Rev Cell Dev Biol. 2010;26:421–444. - PMC - PubMed
    1. Burke B, Stewart CL. The nuclear lamins: flexibility in function. Nat Rev Mol Cell Biol. 2012;14:13–24. - PubMed

Publication types

MeSH terms

LinkOut - more resources