

Transcriptional profiling of Mycobacterium tuberculosis replicating ex vivo in blood from HIV- and HIV+ subjects
- PMID: 24755630
- PMCID: PMC3995690
- DOI: 10.1371/journal.pone.0094939
Transcriptional profiling of Mycobacterium tuberculosis replicating ex vivo in blood from HIV- and HIV+ subjects
Abstract
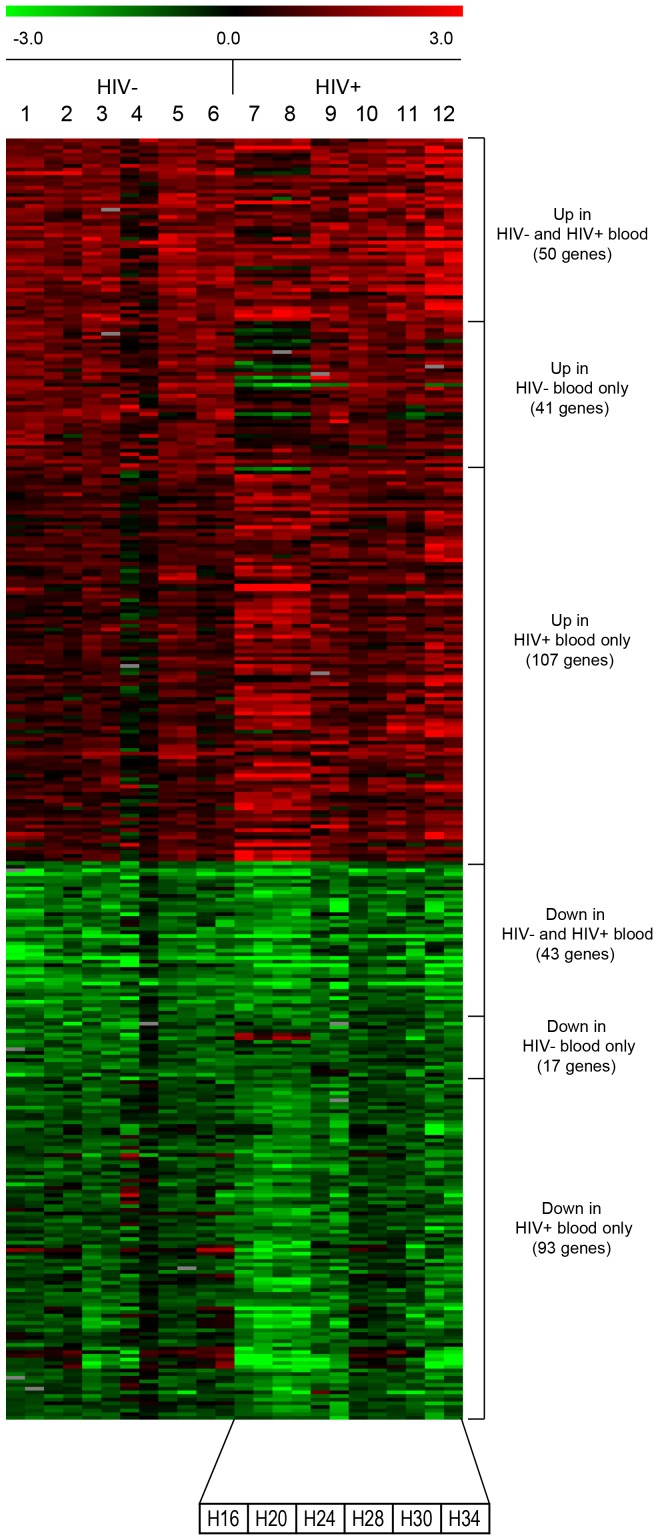
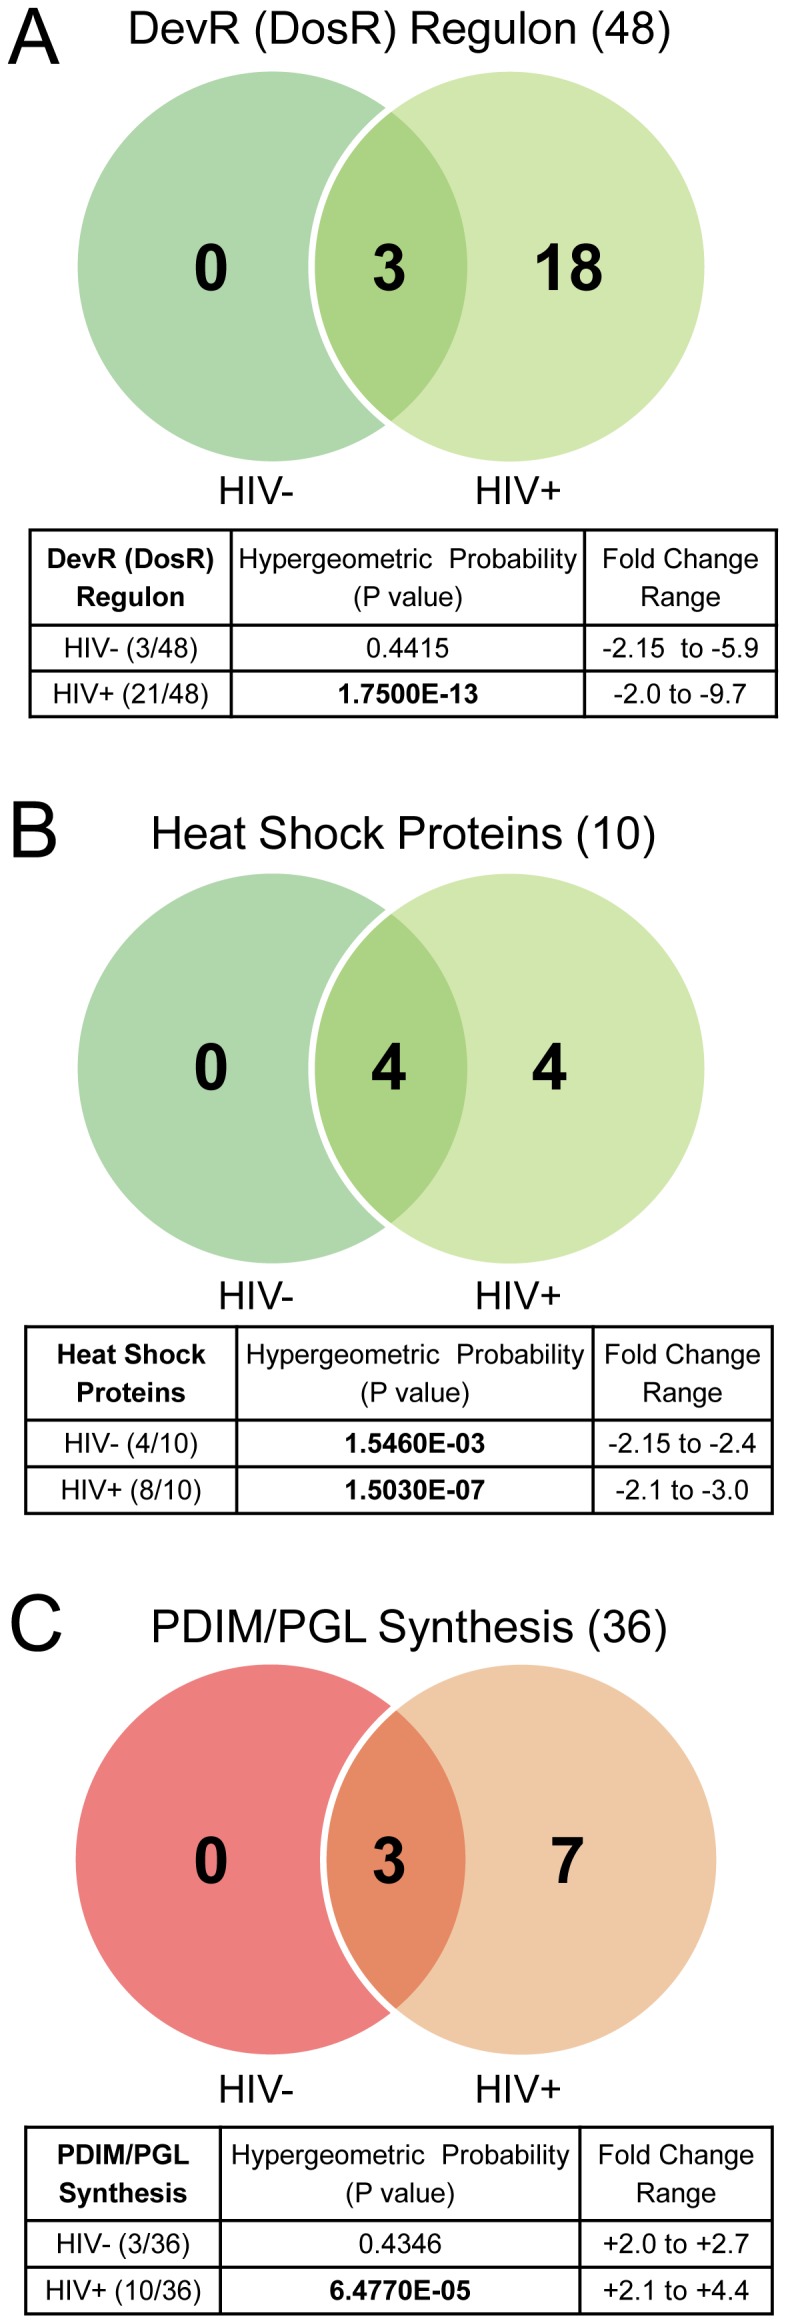
Hematogenous dissemination of Mycobacterium tuberculosis (M. tb) occurs during both primary and reactivated tuberculosis (TB). Although hematogenous dissemination occurs in non-HIV TB patients, in ∼80% of these patients, TB manifests exclusively as pulmonary disease. In contrast, extrapulmonary, disseminated, and/or miliary TB is seen in 60-70% of HIV-infected TB patients, suggesting that hematogenous dissemination is likely more common in HIV+ patients. To understand M. tb adaptation to the blood environment during bacteremia, we have studied the transcriptome of M. tb replicating in human whole blood. To investigate if M. tb discriminates between the hematogenous environments of immunocompetent and immunodeficient individuals, we compared the M. tb transcriptional profiles during replication in blood from HIV- and HIV+ donors. Our results demonstrate that M. tb survives and replicates in blood from both HIV- and HIV+ donors and enhances its virulence/pathogenic potential in the hematogenous environment. The M. tb blood-specific transcriptome reflects suppression of dormancy, induction of cell-wall remodeling, alteration in mode of iron acquisition, potential evasion of immune surveillance, and enhanced expression of important virulence factors that drive active M. tb infection and dissemination. These changes are accentuated during bacterial replication in blood from HIV+ patients. Furthermore, the expression of ESAT-6, which participates in dissemination of M. tb from the lungs, is upregulated in M. tb growing in blood, especially during growth in blood from HIV+ patients. Preliminary experiments also demonstrate that ESAT-6 promotes HIV replication in U1 cells. These studies provide evidence, for the first time, that during bacteremia, M. tb can adapt to the blood environment by modifying its transcriptome in a manner indicative of an enhanced-virulence phenotype that favors active infection. Additionally, transcriptional modifications in HIV+ blood may further accentuate M. tb virulence and drive both M. tb and HIV infection.
Conflict of interest statement
Figures


Similar articles
-
Transcriptional profile of Mycobacterium tuberculosis replicating in type II alveolar epithelial cells.PLoS One. 2015 Apr 6;10(4):e0123745. doi: 10.1371/journal.pone.0123745. eCollection 2015. PLoS One. 2015. PMID: 25844539 Free PMC article.
-
Mycobacterium tuberculosis Primary Infection and Dissemination: A Critical Role for Alveolar Epithelial Cells.Front Cell Infect Microbiol. 2019 Aug 21;9:299. doi: 10.3389/fcimb.2019.00299. eCollection 2019. Front Cell Infect Microbiol. 2019. PMID: 31497538 Free PMC article. Review.
-
Transcriptional analysis of ESAT-6 cluster 3 in Mycobacterium smegmatis.BMC Microbiol. 2009 Mar 4;9:48. doi: 10.1186/1471-2180-9-48. BMC Microbiol. 2009. PMID: 19257911 Free PMC article.
-
Identification of a novel role of ESAT-6-dependent miR-155 induction during infection of macrophages with Mycobacterium tuberculosis.Cell Microbiol. 2012 Oct;14(10):1620-31. doi: 10.1111/j.1462-5822.2012.01827.x. Epub 2012 Jul 11. Cell Microbiol. 2012. PMID: 22712528
-
[A review of studies on differential transcriptional profile of Mycobacterium tuberculosis in vivo and in vitro].Zhonghua Jie He He Hu Xi Za Zhi. 2013 Aug;36(8):597-600. Zhonghua Jie He He Hu Xi Za Zhi. 2013. PMID: 24252738 Review. Chinese. No abstract available.
Cited by
-
Transcriptional profile of Mycobacterium tuberculosis replicating in type II alveolar epithelial cells.PLoS One. 2015 Apr 6;10(4):e0123745. doi: 10.1371/journal.pone.0123745. eCollection 2015. PLoS One. 2015. PMID: 25844539 Free PMC article.
-
A comprehensive map of genome-wide gene regulation in Mycobacterium tuberculosis.Sci Data. 2015 Mar 31;2:150010. doi: 10.1038/sdata.2015.10. eCollection 2015. Sci Data. 2015. PMID: 25977815 Free PMC article.
-
Mycobacterium tuberculosis Primary Infection and Dissemination: A Critical Role for Alveolar Epithelial Cells.Front Cell Infect Microbiol. 2019 Aug 21;9:299. doi: 10.3389/fcimb.2019.00299. eCollection 2019. Front Cell Infect Microbiol. 2019. PMID: 31497538 Free PMC article. Review.
-
The transition from iron starvation to iron sufficiency as an important step in the progression of infection.Sci Prog. 2014;97(Pt 4):371-82. doi: 10.3184/003685014X14151846374739. Sci Prog. 2014. PMID: 25638949 Free PMC article. Review.
-
Transcriptome analysis of mycobacteria in sputum samples of pulmonary tuberculosis patients.PLoS One. 2017 Mar 10;12(3):e0173508. doi: 10.1371/journal.pone.0173508. eCollection 2017. PLoS One. 2017. PMID: 28282458 Free PMC article.
References
-
- Ho RS, Fok JS, Harding GE, Smith DW (1978) Host-parasite relationships in experimental airborne tuberculosis. VII. Fate of Mycobacterium tuberculosis in primary lung lesions and in primary lesion-free lung tissue infected as a result of bacillemia. J Infect Dis 138: 237–241. - PubMed
-
- McMurray DN (2003) Hematogenous reseeding of the lung in low-dose, aerosol-infected guinea pigs: unique features of the host-pathogen interface in secondary tubercles. Tuberculosis (Edinb) 83: 131–134. - PubMed
-
- Lincoln EM (1935) Hematogenous tuberculosis in children. American Journal of Diseases of Children 50: 84–103.
-
- Barrios-Payan JA, Saqui-Salces M, Jeyanathan M, Vazquez AA, Arreola MC, et al. (2012) Extrapulmonary Location of Mycobacterium tuberculosis DNA During Latent Infection; accepted for publication. The Journal of Infectious Diseases. - PubMed
Publication types
MeSH terms
Substances
Grants and funding
LinkOut - more resources
Full Text Sources
Other Literature Sources
Molecular Biology Databases
