. 2014 Jun 15;74(12):3317-31.
doi: 10.1158/0008-5472.CAN-14-0772-T. Epub 2014 Apr 22.

IDH1 mutations alter citric acid cycle metabolism and increase dependence on oxidative mitochondrial metabolism

Affiliations

IDH1 mutations alter citric acid cycle metabolism and increase dependence on oxidative mitochondrial metabolism

Alexandra R Grassian et al. Cancer Res. .

Abstract

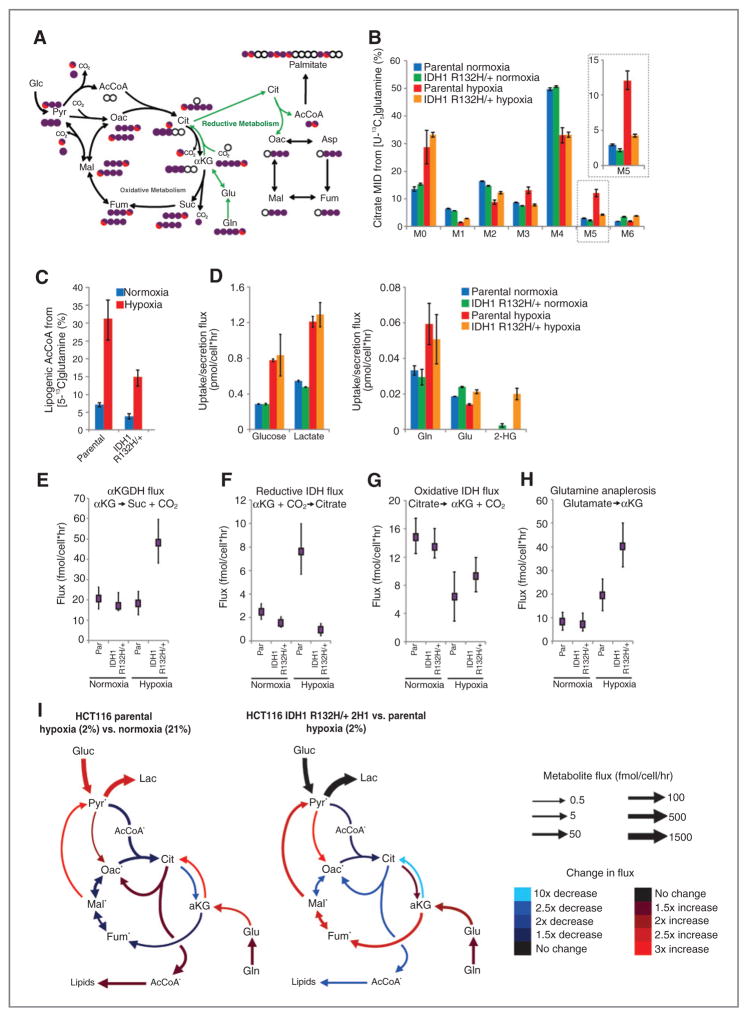
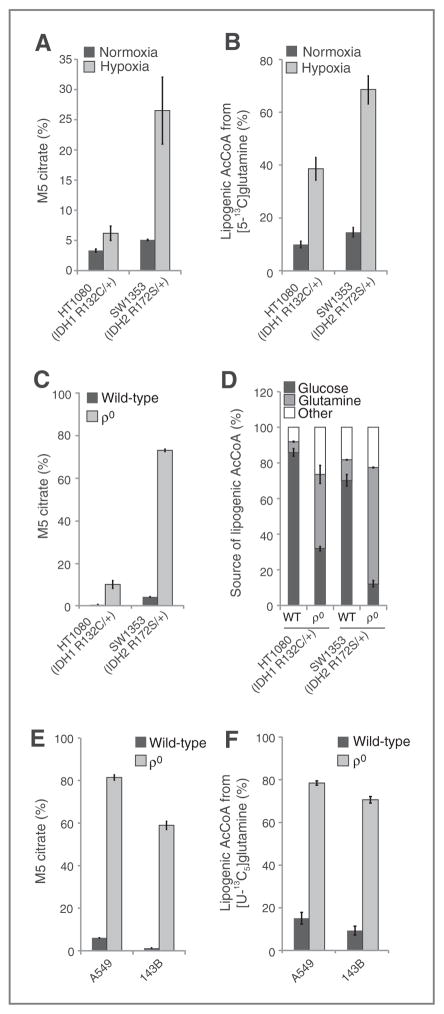
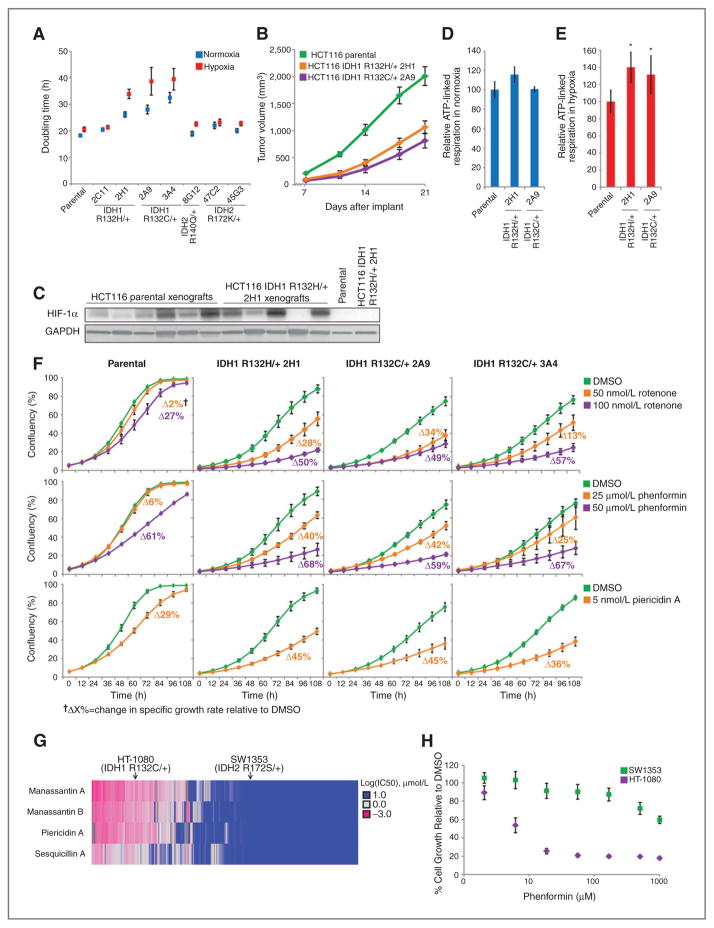
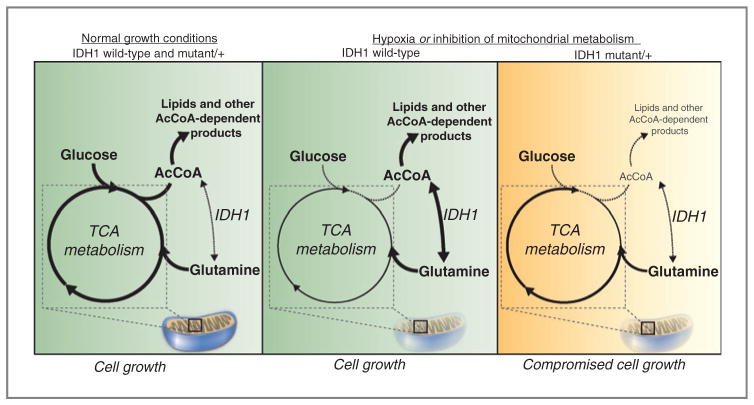
Oncogenic mutations in isocitrate dehydrogenase 1 and 2 (IDH1/2) occur in several types of cancer, but the metabolic consequences of these genetic changes are not fully understood. In this study, we performed (13)C metabolic flux analysis on a panel of isogenic cell lines containing heterozygous IDH1/2 mutations. We observed that under hypoxic conditions, IDH1-mutant cells exhibited increased oxidative tricarboxylic acid metabolism along with decreased reductive glutamine metabolism, but not IDH2-mutant cells. However, selective inhibition of mutant IDH1 enzyme function could not reverse the defect in reductive carboxylation activity. Furthermore, this metabolic reprogramming increased the sensitivity of IDH1-mutant cells to hypoxia or electron transport chain inhibition in vitro. Lastly, IDH1-mutant cells also grew poorly as subcutaneous xenografts within a hypoxic in vivo microenvironment. Together, our results suggest therapeutic opportunities to exploit the metabolic vulnerabilities specific to IDH1 mutation.


Conflict of interest statement

Disclosure of Potential Conflicts of Interest

A.S. Divakaruni is a consultant/advisory board member of Seahorse Bioscience. M.G. Vander Heiden has ownership interest and is a consultant/advisory board member of Agios Pharmaceuticals. A.N. Murphy received a commercial research grant and is a consultant/advisory board member of Seahorse Bioscience. C. Straub, J.D. Growney, and R. Pagliarini have ownership interest in Novartis. C.M. Metallo has honoraria from the speakers’ bureau of Agios Pharmaceuticals. No potential conflicts of interest were disclosed by the other authors.

Figures

Figure 1
Figure 1
Isogenic IDH1 mutation compromises metabolic reprogramming under hypoxia. A, carbon atom (represented by circles) transitions and tracers used to detect changes in flux: [U-13C5]glutamine (purple circles) or [5-13C]glutamine (circle with red). The fifth carbon is lost during oxidative TCA metabolism but is retained on citrate, AcCoA, and palmitate in the reductive pathway (green arrows). B, citrate MID labeling from [U-13C5]glutamine from HCT116 parental and HCT116 IDH1 R132H/+ clone 2H1 cells cultured in normoxia or hypoxia (2% oxygen) for 72 hours. Data, representative of more than three independent experiments. Inset highlights changes in % M5 citrate. C, contribution of [5-13C]glutamine to lipogenic AcCoA from cells cultured as in Fig. 1B. D, uptake and secretion fluxes for cells cultured as in Fig. 1B. E–H, α-Ketoglutarate dehydrogenase (E), reductive IDH (F), oxidative IDH (G), and glutamine anaplerosis (H) flux estimates and 95% confidence intervals by the 13C MFA model. I, graphical representation of fluxes determined via MFA. Arrow thickness, level of flux in HCT116 cells cultured in hypoxia. Color, fold difference between hypoxic and normoxic parental HCT116 cells (left) or between hypoxic HCT116 IDH1 R132H/+ 2H1 cells and hypoxic HCT116 parental cells (right).*, metabolites that were modeled as existing in separate mitochondrial and cytosolic pools. aKG, α-Ketoglutarate; cit, citrate; fum, fumarate; gluc, glucose; glu, glutamate; gln, glutamine; lac, lactate; mal, malate; oac, oxaloacetate; pyr, pyruvate. See also Supplementary Methods, Supplementary Fig. S2, and Supplementary Tables S1–S4 for details of MFA model, results, and data.
Figure 2
Figure 2
Compromised reductive TCA metabolism is specific to cells with mutant IDH1. A, relative level of reductive glutamine metabolism, determined by M5 labeling of citrate from [U-13C5] glutamine in HCT 116 parental cells with or without 10 mmol/LD-2-HG, or HCT116 IDH1/2-mutant isogenic cells cultured in normoxia orhypoxia (2% oxygen). Percentage of M5 citrate levels are normalized to HCT116 parental cells in normoxia for each experiment. B, Western blot of HCT116 parental, HCT116 IDH1 R132H/+ clone 2C11, and HCT116 IDH1 R132H/+ clone 2H1 showing levels of IDH1 R132H and total levels of IDH1. C, ratio of α-ketoglutarate to citrate from cells cultured as in Fig. 2A. D, contribution of [U-13C5]glutamine to lipogenic AcCoA from cells cultured as in Fig. 2A. Four independent experiments are shown. E, correlation of reductive glutamine metabolism in 2% oxygen (as measured by % M5 citrate from [U-13C5]glutamine) to 2-HG ng/1 million cells. Note that HCT116 IDH2 R172K/+ 45G9 and 59F10 are not included in this figure. F, relative level of reductive glutamine metabolism, determined by M5 labeling of citrate from [U-13C5]glutamine in HCT116 parental cells, which were stably infected with doxycycline-inducible shRNA’s targeting IDH1 or IDH2, or nontargeting control (NTC). Cells were cultured for 48 hours in normoxia or hypoxia (1% oxygen) in the presence of 100 ng/mL doxycycline. Citrate labeling was determined via liquid chromatography/mass spectrometry. G, relative level of reductive glutamine metabolism, determined by M5 labeling of citrate from [U-13C5]glutamine in MCF-10A cells cultured in normoxia or hypoxia (2% oxygen) for 72 hours. H, contribution of [U-13C5]glutamine to lipogenic AcCoA from cells cultured as in Fig. 2G.
Figure 3
Figure 3
Cells with endogenous IDH1 and IDH2 mutations respond differently to mitochondrial stress. A, relative level of reductive glutamine metabolism, determined by M5 labeling of citrate from [U-13C5]glutamine in HT-1080 and SW1353 cells cultured in normoxia or hypoxia (2% oxygen) for 72 hours. B, contribution of [5-13C]glutamine to lipogenic AcCoA from HT-1080 and SW1353 cells cultured in normoxia or hypoxia (1% oxygen) for 72 hours. C, relative level of reductive glutamine metabolism, determined by M5 labeling of citrate from [U-13C5]glutamine in HT-1080 and SW1353 WT or ρ0 cells. D, contribution of [U-13C5]glutamine and [U-13C6]glucose to lipogenic AcCoA from cells cultured as in Fig. 3C. E, relative level of reductive glutamine metabolism, determined by M5 labeling of citrate from [U-13C5]glutamine in A549 and 143B WT or ρ0 cells. F, contribution of [U-13C5]glutamine to lipogenic AcCoA from cells cultured as in Fig. 3E.
Figure 4
Figure 4
Mutant IDH1 affects TCA metabolism in vivo. A and B, box–whisker plots showing [1-13C]glutamine enrichment in plasma (A) and tumor (B) from mice with xenografts derived from the indicated cell lines. Black dot, mean; center line, median; box, interquartile range; whiskers, maximum and minimum values. C, relative 2-HG levels from xenografts, normalized to HCT116 parental xenografts. D, percentage of M1 αKG derived from [1-13C]glutamine in tumor xenografts. E, nMols αKG/nMols citrate ratio from xenografts grown from the indicated HCT116 cells. F, glutamine anaplerosis, as determined by M1 labeling of αKG relative to M1 labeling of glutamine from xenografts grown from the indicated HCT116 cells.
Figure 5
Figure 5
Inhibition of mutant IDH1 does not rescue reprogramming of TCA metabolism. A, structure and biochemical data for mutant IDH1 inhibitor, IDH1i A. Note that this is the (S) enantiomer. B, 2-HG levels in HCT116 IDH1 R132H/+ 2H1 and HCT116 IDH1 R132C/+ 2A9 cell lines treated with the indicated concentrations of IDH1i A for 3 days. C, doubling time of cells cultured with or without 10 μmol/L of IDH1i A. D, change in total metabolite levels of HCT116 IDH1 R132H/+ 2H1 and HCT116 IDH1 R132C/+ 2A9 cells cultured in the presence or absence of 10 μmol/L of IDH1i A for 3 or 31 days, the final 72 hours of which the cells are grown in hypoxia (2% oxygen). E, citrate MID labeling from [U-13C5]glutamine from cells cultured as in Fig. 5D. Dotted line over M5 citrate represents average % M5 citrate observed in HCT116 parental cells cultured in hypoxia. F, αKG/citrate ratio from cells cultured as in Fig. 5D. G, contribution of [U-13C5]glutamine to lipogenic AcCoA from cells cultured as in Fig. 5D. H, 2-HG levels in HCT116 IDH1 R132H/+ 2H1 and HCT116 IDH1 R132C/+ 2A9 cell lines treated with the indicated concentration of IDH1-C227 for 3 days. I, relative level of reductive glutamine metabolism, determined by M5 labeling of citrate from [U-13C5]glutamine in HCT116 IDH1 R132H/+ 2H1 and HCT116 IDH1 R132C/+ 2A9 cell lines treated with 1 μmol/L of IDH1-C227 for 3 or 12 days, the final 72 hours of which the cells are grown in hypoxia (2% oxygen). J, αKG/citrate ratio from cells cultured as in Fig. 5I. K, contribution of [U-13C5]glutamine to lipogenic AcCoA from cells cultured as in Fig. 5I.
Figure 6
Figure 6
Cells expressing mutant IDH1 are sensitive to pharmacologic inhibition of mitochondrial oxidative metabolism. A, doubling times of HCT116 cells cultured in normoxia or hypoxia (2% oxygen) for 72 hours. B, growth curves for HCT116 parental and IDH1-mutant xenografts. C, Western blot showing HIF1α expression in HCT116 parental and HCT116 IDH1 R132H/+ 2H1 cells grown in normoxia in cell culture (last two lanes) or as xenografts. D, ATP-linked oxygen consumption for the indicated cell lines grown in normoxia. E, ATP-linked oxygen consumption for the indicated cell lines grown in hypoxia (3% O2). F, growth charts from cells cultured as indicated. Images were acquired every 12 hours to measure confluency. Change in growth relative to DMSO treatment (ΔX%) was calculated using a generalized logistics growth model for batch culture and represents the change in the specific growth rate relative to the DMSO treatment for the indicated cell line. G, heatmap displaying IC50 values to four inhibitors of mitochondrial metabolism for more than 500 cancer cell lines; HT-1080 and SW1353 cells are indicated. H, growth of HT-1080 and SW1353 cells under the indicated concentration of phenformin for 48 hours.
Figure 7
Figure 7
Mutant IDH1 sensitizes cells to inhibition of oxidative mitochondrial metabolism. Left, under normal growth conditions, glucose is metabolized oxidatively in the mitochondria, and AcCoA and lipids are derived mainly from glucose carbons. Middle, in IDH1 WT cells, inhibition of oxidative mitochondrial metabolism (induced by growth in hypoxia or pharmacologic inhibitors of the ETC) limits glucose flux to the mitochondria, and cells instead rely on reductive glutamine metabolism via IDH1 to provide carbons for AcCoA generation and lipid synthesis. Right, when oxidative mitochondrial metabolism is inhibited, cells with a mutant IDH1 allele are unable to fully induce reductive glutamine metabolism and are thus compromised for AcCoA and lipid production, leading to decreased cell growth.

Similar articles

Cited by

References

    1. Arai M, Nobusawa S, Ikota H, Takemura S, Nakazato Y. Frequent IDH1/2 mutations in intracranial chondrosarcoma: a possible diagnostic clue for its differentiation from chordoma. Brain Tumor Pathol. 2012;29:201–6. - PubMed
    1. Cairns RA, Iqbal J, Lemonnier F, Kucuk C, de Leval L, Jais JP, et al. IDH2 mutations are frequent in angioimmunoblastic T-cell lymphoma. Blood. 2012;119:1901–3. - PMC - PubMed
    1. Hayden JT, Fruhwald MC, Hasselblatt M, Ellison DW, Bailey S, Clifford SC. Frequent IDH1 mutations in supratentorial primitive neuroectodermal tumors (sPNET) of adults but not children. Cell Cycle. 2009;8:1806–7. - PubMed
    1. Parsons DW, Jones S, Zhang X, Lin JC, Leary RJ, Angenendt P, et al. An integrated genomic analysis of human glioblastoma multiforme. Science. 2008;321:1807–12. - PMC - PubMed
    1. Yan H, Parsons DW, Jin G, McLendon R, Rasheed BA, Yuan W, et al. IDH1 and IDH2 mutations in gliomas. N Engl J Med. 2009;360:765–73. - PMC - PubMed

Publication types